How to use lognormal distributions in Python

I’ve made an iPython Notebook that explains how to use lognormal distributions in Python/SciPy.  Python is a free and open source programming language that is becoming increasingly popular with scientists as a replacement for Matlab or IDL.  I hope that the notebook will be helpful to anyone who works with grainsize data e.g. volcanologists, sedimentologists, atmospheric scientists.  View it by clicking the picture below:

iPython Lognormal distributions notebook

iPython notebooks contain formula, code, equations and text. Click for notebook on Using the Lognormal Distribution in Python.

The page includes a button to download the notebook so that you can play around with it on your own machine.

iPython notebooks are amazing; if you use Python for science and haven’t tried them yet, then I urge you to have a look.  They let you run Python code in little chunks, displaying the results immediately and interspersed with comments and LaTeX-rendered equations.  You can also render publicly-available notebooks using the iPython Notebook Viewer website, as I have done here.  I think that they are The Future.

iPython notebooks come nicely packaged for Windows and Mac in the Anaconda Python distribution (and probably others such as Enthought, too).  You can install the ipython-notebook package on Ubuntu-like Linux distributions with a single command (sudo apt-get install ipython-notebook), but to get the most up-to-date versions it is better to use pip:

sudo apt-get install python-pip
sudo pip install ipython

# Depending on what is already installed, 
# you may also need to add some dependencies.

sudo apt-get install pandoc python-zmq python-tornado
Categories: Uncategorized

Volcanoes of Southern Iceland

The panorama above shows the volcanoes of Southern Iceland highlighted by early Autumn snows.  Click the image for a full size version.  It was taken near the town of Hella.  From left to right, they are Hekla, Torfajökull, Tindfjallajökull, Katla (low, distant glacier in the background) and Eyjafjallajökull.

Volcanoes of Southern Iceland, as seen from Hella.  Fresh September snow highlights the higher volcanic peaks.

Volcanoes of Southern Iceland, as seen from Hella. Fresh September snow highlights the higher volcanic peaks.  Click to enlarge.

The image lists the dates of “historic eruptions”.  For Iceland, this is since the country was settled in 871+/-2 A.D.  The dates are taken from the catalogue of the Global Volcanism Program.  The 870 A.D. eruption of Torfajökull produced pale-coloured rhyolite magma and coincided with the eruption of dark-coloured basaltic magma from the Veiðivötn fissure further northeast.  The combination of eruptions produced distinctive two-coloured tephra (pumice and ash) marker layer that can be found in soil across the country called the Settlement Layer or Landnám tephra.  It can be used to look for environmental changes since people (and their sheeps) arrived in Iceland.

Only Hekla looks like the classic cone-shaped volcano that a child might draw (and even then it is only from this angle, it is actually a SW-NE running ridge).  The other volcanoes were mainly constructed by eruptions when Iceland was covered by ice over 1000 m thick.  Instead of lava flows, they contain lots of broken rock fragments, shattered when the hot magma hit cold meltwater (called hyaloclastite) and piled up where they erupted.  Most of the Hekla cone has formed since the ice melted, around 8,000 years ago.  Tindfjallajökull has had no historic eruptions, but it has some lavas that haven’t been affected by glaciers, so has had at least one eruption since then.

The image was stitched using Hugin, a free/open source panorama stitching program, and annotated with Inkscape, a free/open source Adobe Illustrator/Corel Draw.  They can be installed on Ubuntu-like Linux systems with the command sudo apt-get install inkscape hugin, and is also available for Windows and Mac.  My photos don’t really do the scene justice, so you should probably just go to Iceland and see for yourself.

Categories: Uncategorized

Volcano suit / What to wear in Iceland

I have a special volcano suit. It isn’t a silvery heatproof number for sampling red-hot lava, though. It’s a fleece-lined boiler suit. I bought it for fieldwork in Iceland and it works very well.  This post describes the suit, then lists the clothing that I recommend more generally for hiking, camping or exploring the country.

Edit: 08 September 2013.  I have updated this post slightly, following an early autumn Iceland trip with a tight schedule that forced us to work in some very wet and fairly cold weather.  The new text is coloured blue.

Volcano Suit

The Icelandic name for these suits is kuldagalli. They are sold in hardware stores and used by people working outdoors over the winter, or when riding snowmobiles. In my current project, sampling the deposits of the Hekla 3 and Hekla 4 eruptions from a camper van, I do a lot of work within 20 minutes walk from the road. I dig a hole in the soil, then spend up to 3 hours recording ash layers and measuring pumices within it.
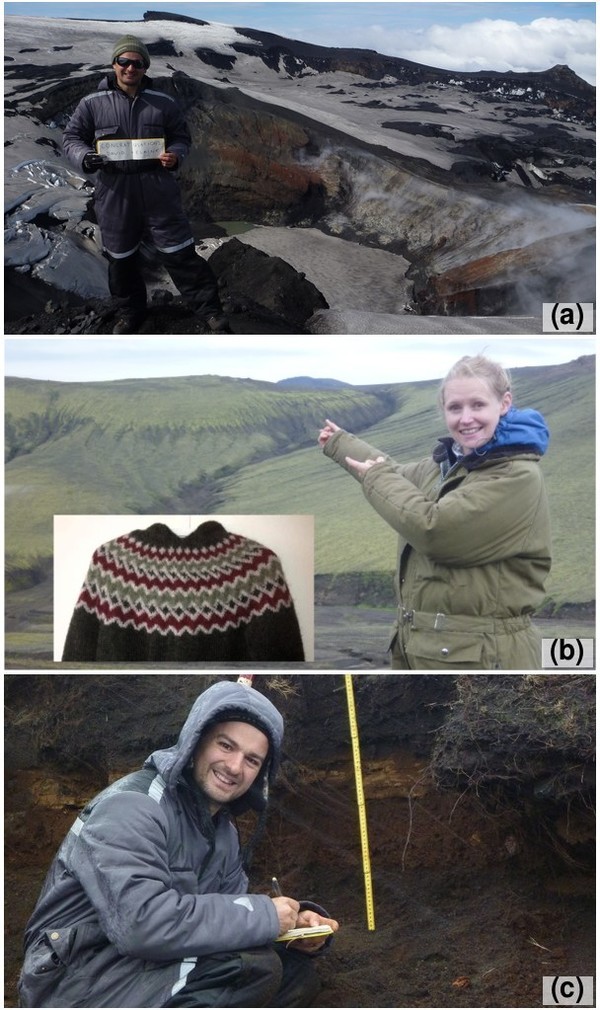
My volcano suit

Volcano suits. (a) Wearing the volcano suit at the summit crater of Eyjafjallajökull (notebook says “Congratulations David and Elaine”. (b) Gemma models a kuldagalli, while the hill behind models a lopapeysa (Icelandic wool sweater). Inset: Lopapeysa knitted by Dr Morgan Jones (@drmorganjones). (c) Sampling in a light sleet shower in perfect comfort.

My suit is very warm, with thick pile insulation and a tough polycotton exterior. It has a fluffy hood, and no gaps where the wind can get in. It isn’t waterproof, but that doesn’t really matter because it is still warm when it is damp (more on this below). It is perfect for long periods sitting still and, because I never walk far, I don’t get cooked when I do move about. Best of all, when I come back to the van, covered in mud, I can just take it off and throw it in the back so I don’t mess up the interior.

A few words on Iceland’s Weather

The weather in Iceland during summer is similar to the hills of the UK in spring or autumn, and the weather in Iceland during spring or autumn is similar to the hills of the UK in winter. So this advice applies in the UK, too.  Rain is common and is often light or showery, but wind is the most important factor in how you feel.  If you have the flexibility, use the weather forecast (www.vedur.is) to plan your trip.  The best weather is usually found on the opposite side of the island to where the wind is blowing from.

What to wear in Iceland

The following list describes what I currently wear for fieldwork in Iceland, and has evolved over 12 years of working there. There is one message that I want to get across: take waterproofs, but aim to wear them as little as possible. Instead, I recommend a ‘soft shell’, approach based on pile and Pertex.  Pertex is a fabric that few outside the UK have heard of.  It isn’t waterproof, but is very tough, windproof and breathable, and is much less stiff than waterproof fabrics. British climber, Andy Kirkpatrick (@psychovertical), gives a great description of the soft shell concept and how it is based on the traditional clothing of native Arctic hunters:

This single layer of skin and fur provided excellent insulation even when damp, providing the wearer’s body with enough warmth to stay alive and, in doing so, dry out the insulation from within rather than rob it of what heat it had left.

The main idea is that windproofing is most important, and that it doesn’t matter if you get wet as long as the clothing is breathable enough to take the water away from your skin. This philosophy is perfectly suited to Iceland’s climate, where you are frequently wet, but not too wet.  It lets you be warm and comfortable while others ask  “Aren’t you cold?  Don’t you need a jacket?”

Waterproof membrane layers, even with modern fabrics such as Gore Tex, trap sweat and make you cold.  They should only be worn only if you are forced to be out in heavy or persistent rain. On my recent fieldwork I decided that if it was wet enough to need Gore Tex it was too wet to take samples anyway, so I sat out the showers in the van.

Clothes for your torso

Wicking baselayer:  This is probably the most important item on this list. It takes the moisture away from your skin, so sweating doesn’t chill you.  Cotton t-shirts (or jeans) do not wick like this and are very slow to dry.  If you are wearing a waterproof jacket, however, even these layers will get wet with sweat.  Helly Hansen make the classic wicking base layer. I often wear a winter version when I’m in Iceland, which is thicker and contains Merino wool, and wear a wicking t-shirt on warmer days.

Lumberjack shirt:  I like to wear shirts in the field for three reasons. Firstly, they let you fine-tune your temperature by undoing buttons and rolling up sleeves. Secondly, you can use the collar to keep the sun off your neck. Thirdly, the breast pockets are handy for a hand-lens and compass-clinometer, with the strings larks-footed through the button holes. Being made of cotton is less of an issue when it isn’t next to the skin, but if it gets really wet in the rain it will take a long time to dry so it is better to leave it behind if the weather is poor.

The soft shell jacket (or smock) lets you keep your waterproofs in your bag. When the wind starts to cool you, put this on instead.  I love my Buffalo Teclite Shirt. It is, without doubt, the most versatile and useful piece of outdoor clothing that I have ever owned. As well as for fieldwork, I’ve used it climbing, mountain biking, running, cycle touring, skiing and caving. It’s been on every adventure that I’ve had in the last 8 years, from the Arctic to the Equator and from 5000 m altitude to 100 m underground.
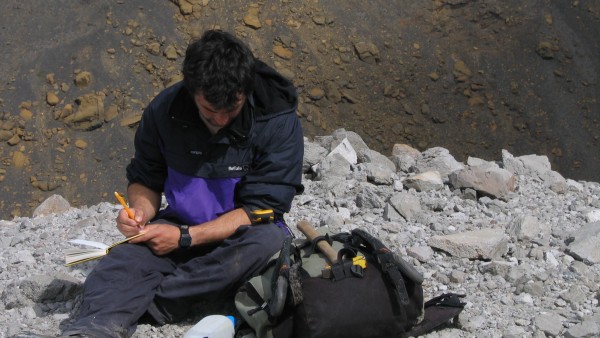
Buffalo in the wild

My Buffalo Teclite Shirt made its field début at Prestahnúkur, near Langjökull, in June 2005 and has had many adventures since. Teva sandals strapped to rucksack were used for river crossings.  Photo by Dave McGarvie (@subglacial).

It is so useful because it is so light (the ‘classic’ Buffalo Mountain Shirts are too hot and heavy), but by blocking the wind it still feels really warm.  I wear my Buffalo over my wicking base layer and can put more insulation or waterproof layers on top if necessary. When it is cold, I use the hood; when it is hot, I use the side vents and roll up the sleeves. It also has big pockets for maps and notebooks. If it gets wet it is still warm and the best way to dry it out is just to keep wearing it.  If it gets ripped, you can stitch it back up again.

Páramo, Montane and RAB (Vapour Rise) also do pile and Pertex soft shell gear.  Fleeces with a wind/waterproof membrane don’t count.  It requires a slight change in outlook to wear this system. You have to accept that being wet is OK, and that it isn’t the kind of thing that you would wear around town. But if you spend a lot of time outdoors, you will love how well it works.

The lopapeysa is the classic Icelandic wool sweater. These are popular for a good reason: they are very warm, even when damp. I wear mine instead of the Buffalo once I get back to the van or to civilisation. You can wear it over the top of a soft shell if it gets really cold.  Treat it like a belay jacket that you can wear indoors.

During prolonged, heavy rain, the pile and Pertex system cannot shift the moisture as quickly as it is coming at you.  For this reason, you still need to carry a waterproof jacket for when it gets really wet and you have no choice to be outside, for example when hiking between camps. It is also necessary in light rain if you aren’t moving much e.g. when making measurements or cooking outside your tent.  It seems that this “beyond Buffalo” rainfall corresponds to around 3-6mm/3hrs (green on the Iceland Met Office rainfall maps) and may be less if the wind is strong.  If the outer layer saturates and the rain is still falling it is time to put on waterproof outer shell layers. 

I just invested in a Mountain Hardware Morpheus. It is an outer shell and little more. I chose it because it should be useful for work (big front pocket for maps/notebook) and play (pockets accessible with a harness on and hood goes over a helmet). In the second-most recent 14 days in Iceland, I only wore it twice.  In the most recent 8 days in the field, it was needed on 6.  Keeping it in my bag stopped me sweating and stopped it getting ruined on the lava and the scree and the ash.

Clothes for your legs

Lined hiking trousers: Craghoppers hiking trousers are good for fieldwork because they have good notebook/map pockets. The winter ones have a tightly-woven polycotton outer, but are lined with fleece so they act in a similar way to pile and Pertex. They are excellent, because you never feel the cold against your legs, even if the outside is damp. This way you don’t need waterproof trousers unless the rain is pouring down.
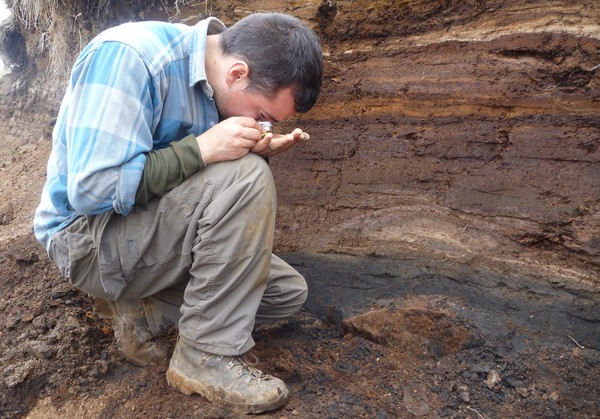
Field uniform

Leather boots. Fleece-lined trousers. Wicking baselayer. Shirt. Hand lens. David Attenborough wears the same clothes every day because it helps with continuity when shooting TV programs. I wear the same clothes every day because they work really well, and because it is one less thing to think about.

You can get a similar effect by wearing wicking baselayer leggings under normal hiking trousers.  Some friends in Iceland use tough polycotton builders’ trousers from a hardware store as an outer layer – they even have a loop for a geological hammer. Technical alpine-style trousers, e.g. those made of Schoeller-type material (black, stretchy stuff that feels a bit like a neoprene wetsuit), are good for walking but don’t have the pockets for fieldwork.

If you get a soaking in the rain, cotton boxer shorts will stay wet and cold long after your other layers have dried.  Silk or wicking underwear is better.

With these options, you should only need waterproof trousers if it is really wet. I have an old Karrimor pair.  Their best feature is full-length zips that let you vent easily when you inevitably start sweat.  But if your legs are warm enough, you never need to wear them.

Footwear

Leather hiking boots: I have Altberg Mallerstangs. They are ideal because they have a one-piece leather upper with minimal seams and stitching, which would get shredded by lava and scree. They also have a waterproof Sympatex lining (good for long hikes in slushy snow) and a B2 crampon fitting (good for glaciers and easy winter climbing). Canvas boots will be destroyed and technical mountaineering boots are too clumsy.

Sandals: These are vital for wading across rivers, but are also useful to have in the car. Driving between sites, you can put your boots in the boot (trunk) and give your feet some air. Ignore any comments from idiot fashionistas. There is only one good reason not to wear socks and sandals: wet grass. A straightforward pair of Tevas is ideal.

Gloves

I usually have 2-3 pairs of gloves: a thin pair of liner gloves (or fingerless woolen ones) that I can still write in; thin leather gardening gloves (a bit like golf gloves) for serious digging; and thick mittens for when it is really cold (Buffalo and Montane make pile and Pertex ones).

Headwear
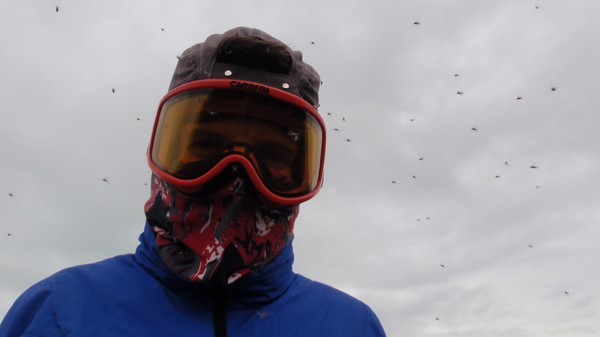
Al and the orifice flies

Geography teacher friend Al Monteith (@al_monteith) wears all his headwear at once, against an onslaught of “Orifice Flies”. You can read about the 3 weeks we spent in the field last summer on his blog. Note the soft shell jacket.

The following items are all useful:

  • Mosquito net. The flies in Iceland don’t bite, but they can swarm in huge numbers and love to crawl into your mouth, your nose, your ears and your eyes.
  • Sunglasses / goggles. When the wind picks up, it brings the ash and sand with it, so these are really useful to protect your eyes. At least it also blows the flies away.
  • Buff / bandana. These can be worn in many ways, such as neck warmers, ear warmers, or as a lightweight hat. Get a dark one, so that you can use it as a blindfold if daylight stops you sleeping at night.
  • Woolly hat. Keeps your head warm.  You can use this to fine-tune your temperature, putting it on and taking it off frequently as necessary.

Notes

All this gear is expensive and I don’t suggest going out and it all at once, especially just for a single holiday or a school trip.  Start with a good wicking baselayer (remember: not cotton). If you currently own nothing else like it, it will make a huge difference to your comfort.  Remember that all these items are also useful in the mountains of the UK, or any other cold, windy places.

I have made this list based on my experience and on conversations with friends. I have no affiliation with any of the brands or websites mentioned above. That said, if anyone wants to send me free kit, I wouldn’t complain…

If you strongly agree or disagree with what I’ve said, I’d be keen to hear from you. Please leave a comment below.

Categories: Uncategorized

Grímsvötn 2011 (Part 1): UK ash deposition from the biggest Icelandic eruption since Katla 1918

The 2011 Grímsvötn eruption was the biggest explosive Icelandic eruption since Katla 1918*, producing twice as much material as Eyjafjallajökull 2010 in around one tenth of the time.  During and after the eruption, many scientists measured the effects that it had on the UK.  The final version of our paper containing the findings was published last week.

The paper uses results of a citizen science tape-sampling exercise (co-organised by the British Geological Survey and this blog) along with data from public agencies such as the Department for Environment, Food and Rural Affairs (DEFRA), the Scottish Environment Protection Agency (SEPA) and the Met Office, to show where and when the ash fell.

We found that the north of the UK (mainly Scotland) received a light dusting of ash in the 48-72 hours following the beginning of the eruption, which caused little or no health or environmental problems.  This post explains how we know this.

The greatest impact of the Grímsvötn eruption on the UK was the disruption to aviation.  A second blog post discusses how new flight rules introduced during the Eyjafjallajökull 2010 eruption meant that the eruption caused much less trouble than it could have done.

Where ash fell in the UK

After Eyjafjallajökull, we found that it was hard to say exactly where ash had fallen, or when, because we only had data from a few samples.  This time, we decided to get the public involved and put a video online showing people how to collect samples.  It explained how to use common household items (e.g. sticky tape and plain paper) to make simple ‘slides’.  We used Twitter, Facebook and the British Geological Survey’s press office contacts to spread the word and got 130 samples from across the UK.  Some were from individuals, others were from whole school classes.  We checked them under the microscope to see if we could find ash.

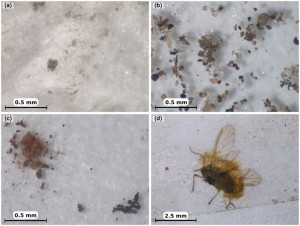
Things that we found in the sticky-tape slides.  (a) Volcanic ash grains were tiny, brown-yellow, glassy and often clumped together.  (c-d) We also found wind-blown sand, soot, and bits of plants and dead insects.  Click image to enlarge.

Things that we found in the sticky-tape slides. (a) Volcanic ash grains were tiny, brown-yellow, glassy and often clumped together. (c-d) We also found wind-blown sand, soot, and bits of plants and dead insects. Click image to enlarge.  Refer to full paper for more details.

The ash grains were tiny, just 25 millionths of a metre, but you can still recognise them because they look glassy and have a yellow-brown colour, and because they often clump together.  The slides were contaminated with other stuff, too, such as wind-blown sand, soot, pollen and even dead flies.  These made it hard to be sure if ash was definitely there, so we divided them into three groups: no ash, possible ash, likely ash, and the slides were checked by three different people.

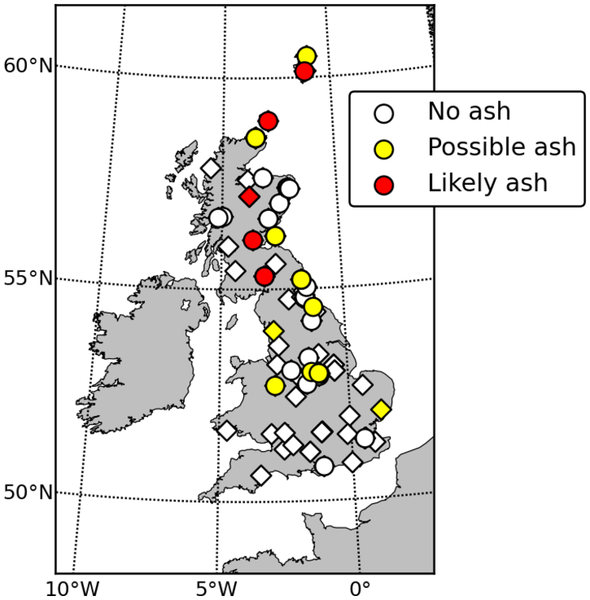
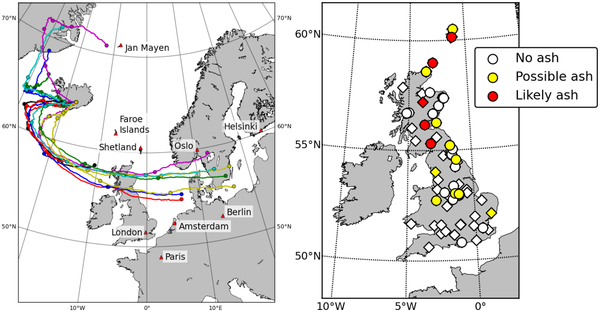
Results from stick-tape samples.  All the samples with "Likely ash" came from Scotland and most were collected on 24 May 2011.

Results from sticky-tape samples. All the samples with “Likely ash” and most with “Possible ash” came from Scotland and were collected on 24 May 2011.  Refer to full paper for more details.

We found that all the “likely ash” samples came from Scotland, and most of the “possible ash” samples were also from northern parts of the UK.  “No ash” samples were found across the UK.  We also checked when the samples had been collected; most ash fell on Tuesday 24th May (the eruption began on the previous Saturday evening).  The results agreed with rainwater samples that we analysed from rain gauges (collected by volunteers, too; Thank you), which also contained volcanic ash grains.  The amount of ash in each location was very small (remember that Grímsvötn is over 900 km from NW Scotland).  In most places, ash was only noticeable if you looked really carefully, but in Thurso, Shetland and Orkney, in the far north of Scotland, it was thick enough to make all the cars look dirty.  The sticky-tape samples were a big help in working out where the ash fell.

Effects on health and the environment

DEFRA and SEPA collected data during the eruption that we incorporated in our study.  DEFRA has a network of air quality monitoring stations that check for pollution by recording the concentration of tiny particles (less than 10 millionths of a metre across) in the air.  These are called PM10.  High PM10 concentrations can cause health problems, especially in people with breathing difficulties, and even small amounts of airborne volcanic ash have been associated with increased deaths in New Zealand.

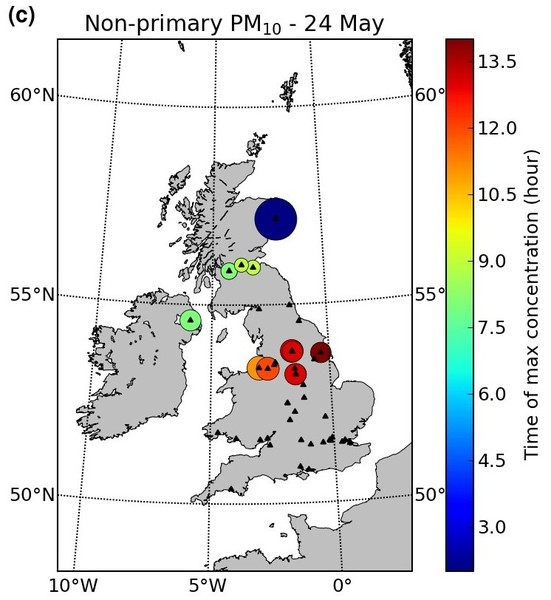
There were big spikes in the amount of PM10 during the eruption, especially in Scotland.  The maximum hourly-averaged PM10 was 413 micrograms per cubic metre, recorded in Aberdeen early on 24 May.  Not all of these particles were volcanic ash, but by using measurements of other pollutants (e.g. nitrogen oxides) at some of the stations, air pollution experts at King’s College, London, worked out how much is man-made.  These results show the ash cloud sweeping southwards across the country on 24 May, reaching the English Midlands in the early afternoon.

Air quality monitoring stations that recorded spikes in airborne particles that were probably volcanic ash.  Hotter colours record peaks at later times, so the southward movement of the cloud can be tracked.  There are no stations north of Aberdeen; if there were, they should almost have certainly detected ash, too.

Air quality monitoring stations that recorded spikes in airborne particles that were probably volcanic ash. Hotter colours record peaks at later times, so the southward movement of the cloud can be tracked. There are no stations north of Aberdeen; if there were, they would have detected ash, too.  Refer to full paper for more details.

Nevertheless, there were no health problems reported.  When averaged over 24 hours, the elevated concentrations were still classed as ‘low level’, except for Aberdeen, which reached ‘moderate’ for 24 May.  To put these values in context, hourly PM10 concentrations of over 200-300 micrograms per cubic metre can be measured in towns across the UK on Bonfire Night and windblown ash from the last two eruptions in Iceland caused hourly PM10 concentrations in Reykjavík to reach over 700 micrograms per cubic metre during one day this spring.  Aircraft flights are restricted at levels of 2000 micrograms per cubic metre, but remember that PM10 measurements are only the finest particles, and only at ground level (see the second post for more on this).

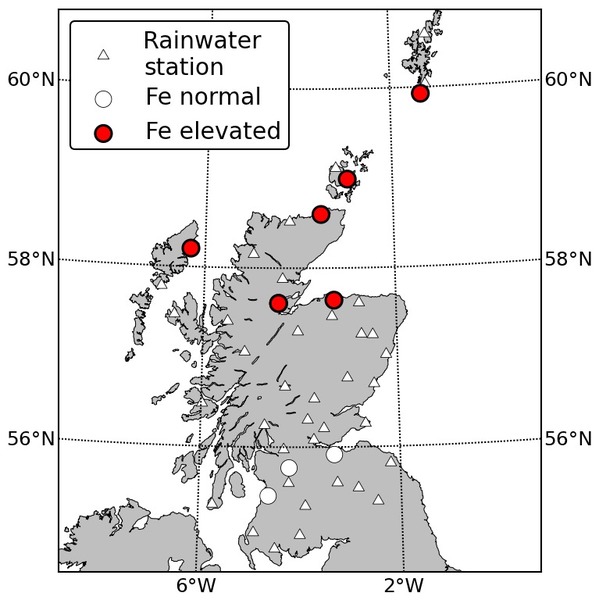
Volcanic eruptions also release acidic gases such as sulphur dioxide (SO2) and fluorine (F2).  SO2 dissolves in water to form acid rain, which damages crops and trees.  When sheep and other animals eat too much grass contaminated by fluoride, they die of a nasty condition called fluorosis, which can turn their bones as soft as rubber.  SEPA tested the acidity (pH) and fluoride content of rainwater samples collected by a network of volunteers, but found no evidence of contamination.  They also tested a few samples for iron (Fe) and aluminium (Al) and found the highest concentrations in samples collected (…surprise, surprise…) in northern Scotland on 24 May.  These levels were not harmful (in fact, iron from volcanic ash can sometimes act as a fertiliser) but the rainwater chemistry results help us see where most ash fell.

Locations of rainwater chemistry samples.  None detected fluorine or acidic rain.  Contamination by iron (Fe) was tested at sites marked with circles, and high concentrations were found in locations marked red.

Locations of rainwater chemistry samples (triangles). None detected fluorine or acidic rain. Contamination by iron (Fe) was tested at sites marked with circles, and high concentrations were found in locations marked red.  Refer to full paper for more details.

What it all means

Despite being larger and more powerful than the Eyjafjallajökull 2010 eruption, the Grímsvötn 2011 eruption caused minimal disruption or damage to the UK.  There is no doubt that Iceland’s volcanoes are capable of huge, destructive and even deadly eruptions, but it is important to remember that not all eruptions actually are.  This is especially important given the sensationalist way that they are portrayed in the mainstream media.  By improving our monitoring ability during the eruptions with small effects, we increase our ability to cope when a larger eruption eventually comes along.


Further reading

This is the first of two posts about the effects of the Grímsvötn eruption on the UK.  Read the second post to find out about the effects on aviation.

Our study was published in the Journal of Applied Volcanology, which is an open access journal.  This means that anyone can download and read the full report for free by clicking the link below:

  • Stevenson, J. A., S. C. Loughlin, A. Font, G. W. Fuller, A. MacLeod, I. W. Oliver, B. Jackson, C. J. Horwell, T. Thordarson, and I. Dawson (2013), UK monitoring and deposition of tephra from the May 2011 eruption of Grímsvötn, Iceland, Journal of Applied Volcanology, 2(1), 3, doi:10.1186/2191-5040-2-3.

Last year, we published a similar paper in the Journal of Geophysical Research about the deposition of Eyjafjallajökull ash across Europe :

  • Stevenson, J. A., S. C. Loughlin, C. Rae, T. Thordarson, A. Milodowski, J. S. Gilbert, S. Harangi, R. Lukács, B. Højgaard, U. Árting, S. Pyne-O’Donnell, A. MacLeod, B. Whitney, and M.Cassidy, (2012), Distal deposition of tephra from the Eyjafjallajökull 2010 summit eruption, J. Geophys. Res., 117, B008904, doi:201210.1029/2011JB008904.

For other Iceland-volcano related posts, covering topics such as the probability of ash clouds reaching the UK, why volcanoes explode and an account of an expedition to Grímsvötn’s crater, follow the links from my Every Post Ever page.

* Technical point: There are a number of ways to define the size of a volcanic eruption, such as plume height, volume of material erupted, volume of magma involved.  These are incorporated into the Volcano Explosivity Index.  Here we are talking about the volume of widely-dispersed tephra deposited from a (sub-)Plinian eruption column.  The 1963-1967 submarine eruption of Surtsey, and the 1996 subglacial eruption of Gjálp both produced larger volumes of tephra (mainly hyaloclastite), but it was not widely dispersed.

Categories: Uncategorized

Grímsvötn 2011 (Part 2): Effects on aviation of the biggest Icelandic eruption since Katla 1918

The 2011 Grímsvötn eruption was the biggest explosive Icelandic eruption since Katla 1918*, producing twice as much material as Eyjafjallajökull 2010 in around one tenth of the time.  During and after the eruption, scientists measured the effects that it had on the UK.  The final version of our paper containing the findings was published last week.

The paper uses results of a citizen science tape-sampling exercise (co-organised by the British Geological Survey and this blog) along with data from public agencies such as the Department for Environment, Food and Rural Affairs (DEFRA), the Scottish Environment Protection Agency (SEPA) and the Met Office, to show where and when the ash fell.

We found that the north of the UK (mainly Scotland) received a light dusting of ash in the 48-72 hours following the beginning of the eruption, which caused little or no health or environmental problems.  The previous blog post explains how we know this.

As with 13 months earlier, the greatest impact of the Grímsvötn eruption on the UK was the disruption to aviation.  This blog post discusses how new flight rules introduced during the Eyjafjallajökull 2010 eruption meant that the eruption caused much less trouble than it could have done.  It is more complicated than the Ash cloud is a myth! – Oh no is isn’t! story presented at the time.  In short, I think that computer models did a pretty good job of predicting where and when there would be volcanic ash, and that new flight rules kept London airports open, but that initial estimates of contaminated airspace were too large and the currently defined concentration zones are flawed anyway.

Effects on aviation of the Grímsvötn eruption

Given the lack of health or environmental damage from the eruption, perhaps the title of this blog post should have been “Biggest Icelandic eruption since Katla 1918 doesn’t really affect the UK”.  But, of course, there was an impact on aviation.  Nine hundred flights were cancelled between 23 and 25 May and the closing of airports was controversial, with the media giving a significant platform to angry airline bosses venting their frustration.

This figure is less than 1% of the over 95,000 flights cancelled during the Eyjafjallajökull eruption of 2010, despite the Grímsvötn eruption being bigger.  I have explained the main reasons for the limited disruption in a previous post.  An important one was the way that the authorities handled this eruption.  Below I describe what I think went well, and what can be improved.  Although my research is done in collaboration with a number of different organisations, the views here are my own.

Computer models did a pretty good job of predicting where and when there would be volcanic ash…

Our new results show good agreement with the location and timing of ash-affected areas predicted by the Met Office model.  I think that it’s really cool that predictions made using data from some of the world’s most powerful supercomputers can be tested by a bunch of kids with sticky tape.  However, saying where and when the ash will be is the easy bit; the real challenge is estimating concentrations.  As I have previously written, making concentration maps of ash clouds is really hard.

Paths for wind passing over Grímsvötn volcano at 00:00hrs on 22 May calculated by the Met Office computer model. They cross Scotland and the northern UK on 24 May, in good agreement with our results.  See the full paper for more details.

… and new flight rules kept London airports open…

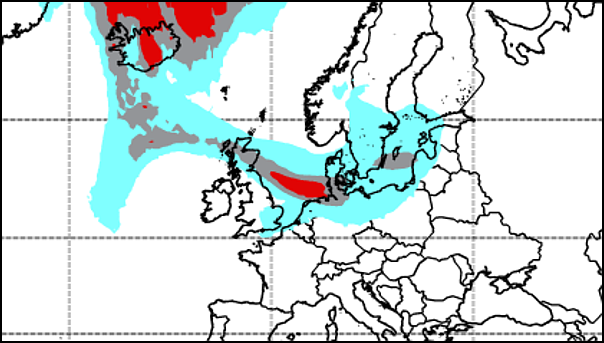
Prior to 2010, the rules were that aircraft should avoid all ash.  When the Eyjafjallajökull eruption caused the widespread closure of airports across Europe, the rules were relaxed to allow aircraft to fly, even if the presence of some ash had been predicted.  Three different zones of ash concentration were introduced.  The zone of Low Contamination (blue in the map below) has a concentration of 200 micrograms per cubic metre (a few grains of fine sand in a bath).  This is the same level that was used to identify contaminated airspace under the old system and is similar to the detection limit for satellite methods.  It is now permitted to fly in this zone.

Zones of Medium (coloured grey) and High Contamination (coloured red), which correspond to concentrations of 2000 micrograms per cubic metre and 4000 micrograms per cubic metre, were introduced to mark the areas of most concentrated ash.  Aircraft can only enter these with special permission.  These rules were in force during the Grímsvötn eruption.

Section of map of predicted ash concentrations on 25 May during G2011. Under the old flight rules, all coloured areas would have been out of bounds. This would have resulted in another closure of London airports. Source: Met Office, Crown Copyright 2011. Click image for full plot.

The map above shows that highest concentrations are expected in the northern UK (as we actually found in our study), and flights were cancelled to and from northern airports such as Glasgow, Edinburgh,  Aberdeen and Newcastle.  But it also shows lower concentrations of ash across southern England and London.  Under the old rules this would have closed the airports there, too, causing massive disruption and losses for the second time in just over a year.  The new rules prevented this and were a big part of the reason that the Grímsvötn eruption had a smaller impact than Eyjafjallajökull, despite being significantly more powerful.

…but the initial estimates of contaminated airspace were too large…

As our findings show, computer models are pretty good at working out where the ash will go.  To estimate the concentration you need to know what is coming out of the volcano.  The mass discharge rate of a typical explosive eruption can be calculated from the height of the eruption column using an equation based on data from many past explosive eruptions.  This is standard practice at Volcanic Ash Advisory Centres across the world.  The equation is very sensitive and if you increase the plume size by 20% it doubles the mass discharge rate.  In Iceland, the height of the eruption column is usually estimated using radar data from the Icelandic Met Office.  The problem is that Grímsvötn 2011 was not a typical explosive eruption.

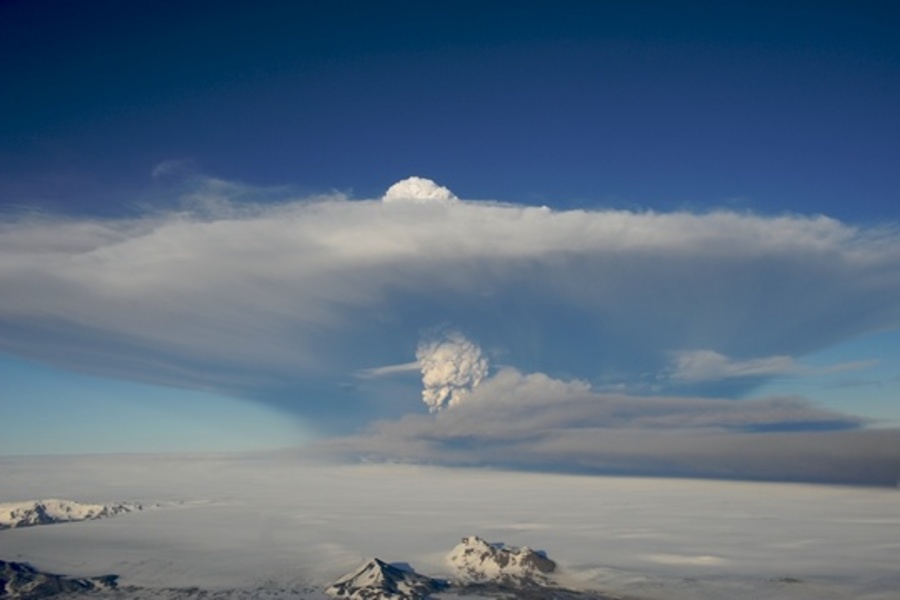
The eruption plume from the Grímsvötn eruption.  The top part travels north, but is mainly steam.  Most of the tephra travels south in the lower part of the plume.  Photograph by Ólafur Sigurjónsson í Forsæti.

The eruption plume from the Grímsvötn eruption. The top part travels north, but is mainly steam. Most of the tephra travels south in the lower part of the plume. Photograph by Ólafur Sigurjónsson í Forsæti.

The photograph shows the eruption plume.  The upper white part reaches nearly 20 km into the air, but it contains mainly steam and sulphur dioxide.  The steam was produced as the eruption passed through a lake within the ice.  Much of this fell back to Earth as dirty ash-filled hailstones.   Most ash grains (and pumice and other volcanic debris, collectively known as tephra) are in the bottom of the plume.  Sticky from the moisture in the plume, lots of the ash clumped together and fell down quickly to be deposited near the volcano.  This extra fallout meant that less ash left Iceland than was predicted by the standard methods.  This caused dispersion models to predict concentrations that were too high, and so too much airspace ended up in the grey and red zones.

Comparing the predicted ash clouds with information from satellites showed something was wrong.  There was much less ash over Greenland than the model had predicted.  With these observations, and following discussions with volcanologists (disclosure: I was one of them), the Met Office adjusted the model (details provided here, with permission) to reduce the amount of ash in the plume.  This decision certainly limited disruption during the later stages of the eruption.  If it had been made sooner then perhaps some of the flight cancellations during the early stages could have been avoided, too.

This is all much clearer with hindsight, of course, and this was the first eruption of Grímsvötn since it became necessary to estimate ash concentration.  To do better next time, the ability to collect and make use of accurate new data as quickly as possible is important.  The British Geological Survey and Icelandic Met Office are working together to improve volcano monitoring in Iceland, and current hot topics for research in the wider scientific community include finding ways to make it easier to compare model predictions with satellite images and to use satellite data to set model parameters.

…and the currently defined red and grey zones are flawed anyway

The introduction of zones of different ash concentration did a lot to keep aircraft flying during the two recent Icelandic eruptions, but this system still has two big problems.

The first problem is that the zonation scheme gives the impression that flying in the blue zone is ‘safe’, but this is not necessarily the case.  Volcanic ash accumulates continuously within jet engines as they fly through the cloud and so a long flight through the blue zone (or even in lower ash concentrations outside marked areas) may do more damage than a short flight in the red zone.  Furthermore, flying in any amount of ash will result in increased maintenance costs for aircraft operators.  It seems sensible to move to a system that estimates the ‘dosage’ of ash for given flight routes.

The second problem is that it isn’t actually possible to map the boundary between the grey and red zones.  I still can’t find an official justification online for why these levels are set where they are.  The blue zone, which is roughly equivalent to what satellites can detect, is reasonable.  The lower limit of the grey zone (2000 micrograms per cubic metre) is 10 times higher than the blue zone and can perhaps be justified because aircraft operating from dusty airports in desert areas already fly through this level of contamination (but of sand, which has a higher melting point than volcanic ash).

Setting the lower limit of the red zone at double this (4000 micrograms per cubic metre) makes little sense, because comparisons of satellite concentration estimates with measurements made by aircraft and other sensors show that they cannot distinguish between these two levels with any confidence.  Comparing the Met Office model predictions of peak concentration to other measurements (which have uncertainties of their own) shows that they agree within a factor of 2 only around a quarter to a third of the time.  This increases to a half to two thirds of the time if an 80 km wide buffer zone is used.  This is because making maps of ash clouds is really hard.

Given this uncertainty, the huge range in possible ash concentrations and evidence that ash-aircraft encounters that actually stopped engines involved concentrations of over 1,000,000 micrograms per cubic metre, setting the levels of different zones at 200, 2000, 20,000, 200,000 etc. would seem to be more appropriate.

What it all means

There are two main messages from this post:

  • Dispersion models are good at predicting where volcanic ash will go, and this system worked fine for two decades when aeroplanes had to fly around it.  Flying through volcanic ash requires estimates of the concentration, but these currently have large uncertainties.  Improving them needs further scientific research into eruption deposits, on-site monitoring, computer modelling techniques and satellite detection methods.  This is important to remember at a time when budget cuts in the US have severely reduced the capabilities of the Alaskan Volcano Observatory.
  • Things have come a long way since Eyjafjallajökull erupted in 2010 and new flight rules mean that only the very largest eruptions now have the capability to shut down all of European aviation (and there is a lot of it) in such dramatic fashion.  I suspect that the biggest economic threat to the UK in the future is probably from long-lasting eruptions causing short, but frequent and unpredictable, closures of small regions of airspace over periods of many weeks or months.

Further reading

This is the second of two posts about the effects of the Grímsvötn eruption on the UK.  Read the first post to learn where and when the ash fell.

Our study was published in the Journal of Applied Volcanology, which is an open access journal.  This means that anyone can download and read the full report for free by clicking the link below:

  • Stevenson, J. A., S. C. Loughlin, A. Font, G. W. Fuller, A. MacLeod, I. W. Oliver, B. Jackson, C. J. Horwell, T. Thordarson, and I. Dawson (2013), UK monitoring and deposition of tephra from the May 2011 eruption of Grímsvötn, Iceland, Journal of Applied Volcanology, 2(1), 3, doi:10.1186/2191-5040-2-3.

Last year, we published a similar paper in the Journal of Geophysical Research about the deposition of Eyjafjallajökull ash across Europe :

  • Stevenson, J. A., S. C. Loughlin, C. Rae, T. Thordarson, A. Milodowski, J. S. Gilbert, S. Harangi, R. Lukács, B. Højgaard, U. Árting, S. Pyne-O’Donnell, A. MacLeod, B. Whitney, and M.Cassidy, (2012), Distal deposition of tephra from the Eyjafjallajökull 2010 summit eruption, J. Geophys. Res., 117, B008904, doi:201210.1029/2011JB008904.

For other Iceland-volcano related posts, covering topics such as the probability of ash clouds reaching the UK, why volcanoes explode and an account of an expedition to Grímsvötn’s crater, follow the links from my Every Post Ever page.

* Technical point: There are a number of ways to define the size of a volcanic eruption, such as plume height, volume of material erupted, volume of magma involved.  These are incorporated into the Volcano Explosivity Index.  Here we are talking about the volume of widely-dispersed tephra deposited from a (sub-)Plinian eruption column.  The 1963-1967 submarine eruption of Surtsey, and the 1996 subglacial eruption of Gjálp both produced larger volumes of tephra (mainly hyaloclastite), but it was not widely dispersed.

Categories: Uncategorized

Grant applications are hard work (includes LaTeX template)

This post is a taste of (not so) slackademia.  It shows how much work is involved in preparing the funding application for a NERC Standard Grant.  It also includes a LaTeX template for anyone writing their own.  It can be used in any document where there is a tight limit on page numbers.

Grant applications are a lot of work

My recent work on the massive Hekla 3 and Hekla 4 eruptions shows that Hekla 4 produced much more extremely fine ash (<64 microns; this is the stuff that can cross the Atlantic and cause trouble in Europe) than Hekla 3.  We know that explosive eruptions are driven by gases in magma, so I want to get a post-doc for 2 years to look at the bubbles and the dissolved gases in pumice from the eruptions to see why they are so different.

It turns out that these applications are A LOT of work.  The final version required:

  • 13,000 carefully chosen, fully-referenced, words, co-written with 5 other authors (=> 5 sets of corrections/edits/comments) on 2.5 continents (Iceland surely isn’t a whole continent).
  • Detailed spreadsheets with well-researched and up-to-date costs.
  • 2 days of sampling (last summer) and 80 hours of specific analysis (this spring) to get one preliminary dataset; another day including instrument time for another.
  • Letters of Support from heads of departments, lab managers, senior government agency scientists, research professors.  The application is 23,000 words if you include Letters of Support and CVs.
48 sides of carefully thought-out science.

47 sides of carefully thought-out science.  Don’t underestimate how long it takes to put it together.

I reckon that it took around 3 months of full-time equivalent work to prepare.  This is time that I could have been analysing data or writing papers.  You can also add in another fortnight of other post-docs’ time.  Plus a few days of Professor/Senior Scientist time.  While working out the costs, I learned that employing a post-doc costs the tax-payer about £100,000 per year (of which about 1/3 is salary).  So we are talking about at least £25,000 of effort being put into a grant application.  Did I mention that only 1 in 5 get funded?

If it isn’t funded, the time will not have been completely wasted.  The data are useful, I’ve made new contacts and had an excuse to get right up-to-date with the latest published papers.  I understand the importance of being able to find the best-thought out and most useful projects to give funding from a limited pot, but it should also be recognised that every extra section on the application form has a real cost in terms of scientists’ time.

Grant application LaTeX template

LaTeX is an open source document preparation system.  Unlike a word processor, you only have to think about the text and it takes care of the formatting.  No more adding a word and seeing all your pictures jump to different pages.  If you have to write a complicated document with sections, subsections, references, tables and figures (such as a Masters or PhD thesis), then I highly recommend it.

Click here to download a LaTeX template for grant applications.  It is based on the normal article class, using the following extra packages:

  • anysize to set 2cm margins
  • helvet for Arial-like font
  • natbib and multicol with a custom .bst file for a compact reference list (Note: since 2014 NERC applications require references in 11pt font.  Comment out the \tiny{} before the bibliography to make the text full size.)
  • wrapfig to wrap text around images
  • pgfgantt to make a Gantt chart
  • titlesec and a number of other tweaks to make things compact

The packages are fairly common and can be installed on Ubuntu-like Linux systems with a single command (sudo apt-get install texlive texlive-latex-extra texlive-humanities texlive-fonts-extra).  The content of the template comes from this blog post, and the output looks something like this:

proposal_cover

Categories: Uncategorized

Ash cloud travel insurance / why scientists should blog

I was quoted on the Daily Telegraph website at the weekend, in an article about the number of travel insurance companies whose policies cover volcanic ash.  I’d answered some questions from the author by email, then he told me when it was published so I could see how it turned out.  You can read the article here: http://www.telegraph.co.uk/finance/personalfinance/insurance/10092154/Just-three-travel-policies-cover-volcanic-ash.html

The article includes lots of good information and gets a big thumbs-up for explaining that the much-bigger 2011 Grímsvötn eruption caused little disruption compared to Eyjafjallajökull 2010, but I thought that the general tone was a bit too alarmist.

I was also interested to see how my quotes were used.  The following line in my email:

Hekla and Katla are both ‘overdue’ for an eruption e.g. the time since their last eruption is longer than the average time between other recent eruptions.

appeared in the article as:

Hekla and Katla are both overdue for an eruption.

The words are mine, but the message is different and without the explanation it seems a lot more urgent.  Katla has been ‘overdue’ since before I was born.  No real harm is done, and perhaps I am being a control-freak, but no volcanologist wants to be associated with scaremongering, either.

This experience sums up a big reason why scientists should blog.  News media have limited space, overly-enthusiastic headline writers and demanding advertisers.  Blogs don’t.  They provide all the space scientists need to explain new research, including all the complexities and limitations, and what they write is exactly the information that the reader gets.

Ash cloud insurance

The article also made me think about the concept of ash cloud insurance.  Some companies now cover volcanic ash-related claims, some don’t, and others charge a special supplement of up to £10.

All insurance is a form of gambling.  If you were to bet £10 that your £1,000 holiday would be cancelled, because the airport was closed by volcanic ash on the day that you were supposed to leave, you would only be better off in the long run if the chances of this happening were more than 1 in 100.  Your 99 ‘losses’ of £10 each would be cancelled out by one ‘win’ of £1000.

Planes have been forbidden to fly through volcanic ash for about 20 years now.  In that time, there have been six eruptions in Iceland (Grímsvötn 1996, Grímsvötn 1998, Hekla 2000, Grímsvötn 2004, Eyjafjallajökull 2010, Grímsvötn 2011).  Because of these, at least some UK airports were closed for about 10 days in total (~8 during Eyjafjallajökull 2010, ~2 during Grímsvötn 2011).  Therefore, the chances of flights being cancelled on any given day are somewhere in the region of 1 in 730.  This is equivalent to just 0.14 in 100, so that extra ash cloud fee is looking pretty expensive.

This is a simplistic analysis, and things are obviously a bit more complicated in real life, but you get the idea.  In gambling in general, the house wins in the end.  In ash cloud insurance, the house can win big.


Further reading

If you want to learn about this topic in more detail, here are my answers to the emailed questions in full:

1. How likely is it that Eyjafjallajokull will erupt in the foreseeable future?

Not that likely.  There has been little seismic activity there since the eruption ended and previous eruptions have been hundreds of years apart.

2. If it does erupt do you think it’s likely that we will see similar levels of disruption to the 2010 eruption?

Definitely not. The changes in rules for aviation during the E2010 eruption mean planes can fly in much higher ash concentrations than they used to be able to.

http://all-geo.org/volcan01010/2012/04/an-icelandic-eruption-100-times-more-powerful-than-eyjafjallajokull/

3. Are there any other volcanos that are likely to erupt in the near future, which could cause major travel and local disruption?

In general, we would expect an eruption in Iceland every ~5 years and a direct hit from ash every ~20 years.

http://all-geo.org/volcan01010/2011/02/ash-cloud-closes-airports-chances/

Hekla and Katla are both ‘overdue’ for an eruption e.g. the time since their last eruption is longer than the average time between other recent eruptions.  Check the Smithsonian website for details.  Of these, a Katla eruption could be very damaging within Iceland:

http://all-geo.org/volcan01010/2011/11/why-people-are-scared-of-katla/

The amount of travel disruption would depend on the length and size of the eruption.  A long eruption would be much more disruptive.

Other explosive eruptions from ice-covered volcanoes could produce a lot of ash, too, but would hopefully be short-lived:

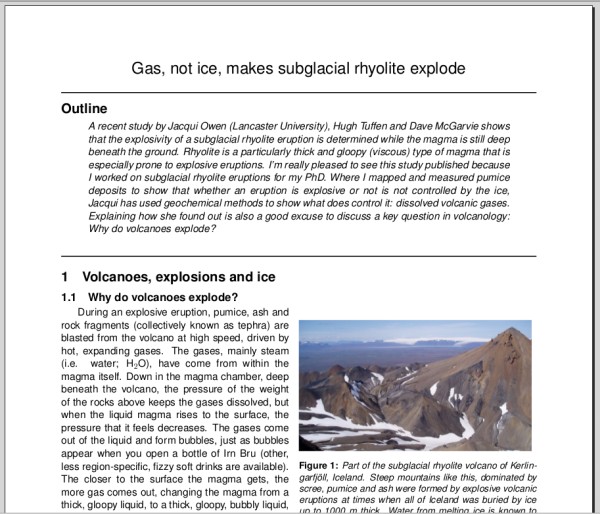
http://all-geo.org/volcan01010/2012/12/gas-makes-subglacial-rhyolite-explode/

Large lava-producing fissure eruptions, such as Laki (from the Grímsvötn system) and Eldgjá (from the Katla system) are the worst case scenario as they could last months and release large quantities of toxic gas.  But these are rare (e.g. once per 500 years).

4. Finally, to what extent do you believe that the early warning technology that has been developed by the Norwegian Institute of Air Research will prove successful?

I think that this method has potential and I think that Easyjet deserve credit for investing in research and technology.  The idea behind it is the same as satellites currently use to recognise ash clouds and the main scientist involved (Fred Prata) is a real expert in this field.  I’m looking forward to them announcing results of their tests to show how well it works.

Categories: Uncategorized

EGU2013: Dirty volcanic hail, geology blogging, open source science and fracking

Here are some of my highlights from last week’s European Geoscience Union conference.  These were presentations dirty hailstones formed in subglacial volcanic eruptions, a workshop on social media and blogging in geosciences, a splinter meeting on open source software in geoscience and The Great Debate on shale gas/fracking.

Dirty volcanic hail

Þórður (Thordur) Arason presented the first detailed study of volcanic ash-filled hailstones.  These are closely related to subglacial volcanic eruptions, such the two most-recent Icelandic events.   He studied examples from the deposits of the May 2011 Grímsvötn eruption that he collected, still frozen, from layers between the pumice and ash deposits that formed during the eruption, high on the Vatnajökull glacier

These ice-cemented spheres of volcanic ash formed during the Grímsvötn eruption in Iceland in May 2011, and are similar to the hailstones described at EGU 2013. I took this photo when I visited the crater area three months later. It was an adventurous trip, involving monster trucks and crevasses. Click the image to read more.

Arason measured the sizes of the hailstones (mostly 1-2 mm) from close-up photographs.  He weighed a big rectangular block of them, then allowed it to melt so that he could collect that ash grains inside.  The hailstones contained 15-40% ash, with grains from a few microns to over 1 mm in diameter.

Quantifying the contents of the hailstones is important for a number of reasons.  Firstly, by mixing ash grains with ice, you change the particle size and optical properties of the grains.  Arason demonstrated how this can lead to huge errors in measurements of ash plumes made by radar, and ice-covered ash is a problem for satellite measurements, too.  Secondly, by trapping very fine ash, the hailstones stop it drifting off downwind towards Europe.  These processes will be included in the next generation of computer models for ash dispersal.

It must take a lot of water to make so many hailstones.  Thanks to Magnús Tumi Guðmundsson, we have a pretty good idea of how much.  In his talk, he described  changes in the Vatnajökull glacier around the eruption site.  There is a permanent subglacial lake at Grímsvötn that periodically releases meltwater floods (jökulhlaups) out onto the lowlands, so Icelanders have detailed maps of the ice surface and of the bedrock beneath.

In this case, the volume of missing ice is equivalent to the water that went up with the plume, because there was no jökulhlaup during the eruption.  Guðmundsson found this volume was around 0.1 km3, which is about one seventh of the volume of tephra (pumice, ash and rock debris) that were produced during the eruption.  Averaging all this water over the 4 days when the eruption was most powerful gives a discharge of about 290 m3s-1.  This is equivalent to a fountain with 10% of the discharge of the Nile, shooting straight up into the air.

Social media and blogging workshop

The social media and blogging workshop panel included the geobloggers and tweeters Jon Tennant (@protohedgehog), Laura Roberts (@LauRob85), James King (@DrAeolus) and Dave Petley (@davepetley) and was chaired by EGU social media officer Sara Mynott (@EuroGeosciences).  They discussed the advantages of Twitter (finding breaking news first; access to well-informed people on any topic; making contacts from all over the world), and of blogging (explain things in more detail than traditional media are interested in; raise your academic profile; become a contact point for journalists interested in your subject).

I was interested to hear that some PhD student bloggers are writing on blogs that their supervisors had set up but didn’t have time to write themselves.  It was also interesting that some climate scientists are discouraged from blogging by the abuse that they receive in their comments from climate change deniers.

Dave Petley is a professor in the Institute of Hazard, Risk and Resilience at Durham University and runs The Landslide Blog, hosted by the American Geophysical Union.  By professor, I mean in the UK senior-academic-who-runs-his-own-research-group sense of the word, as opposed to the US academic-with-a-permanent-(tenured)-position sense.  His story was especially convincing.  In the six years since he began his blog, he has seen traffic to the site gradually increase to over 1,000 visitors per day.  Over the same period, he showed how citations to his papers had also risen sharply and said he now receives many more invites to meetings and conferences.

Dave also described how a blog post that he wrote about a fatal flash flood in Nepal became the global focal point for people looking for information on the event, including Nepali journalists and visiting tourists.  An ex-Soviet military pilot provided YouTube footage showing that the cause was a landslide from the mountain Annapurna IV, and NASA contributed satellite imagery.  The results of the study will be written up as a scientific publication.

I’ve found a similar benefit from blogging.  In 2011, I wrote a post asking members of the UK public to collect ash fall from the eruption of the Grímsvötn eruption, and posted the request on Twitter.  We received over 130 samples from across the country, and the results, which include a map of where ash was found, will be published in the Journal of Applied Volcanology in the next few weeks.

Free and Open Source Software (FOSS) in the Geosciences

Following an oversubscribed splinter meeting last year, the profile of Free and Open Source Software in the Geosciences continues to increase.  This year featured another Splinter Meeting and a dedicated session featuring both talks and posters.  I made it along to part of the Splinter Meeting, which highlighted the benefits of using free/open source software and displayed the huge and growing range of tools that are available.

The panel highlighted that a great way to test some of these tools out is to download the OSGeoLive DVD, which contains the latest versions of over 50 different packages.  Simply fire up your machine with the disk in the drive and it will boot into a fully-functioning Linux desktop with all the software installed and ready to go.  When you are done playing, shut the machine down and take the disk back out.  Your original operating system will be untouched.

The OSGeo-Live DVD is a great way to try out open source GIS software

The arguments for open source in science were strengthened recently by editorial in the journal Nature, and by articles in the journal Science.  The Scientific Method rests on experiments being tested by different people.  Many advances in science come from computer modelling, but if scientists do not publish their code, how can others test it?

Related to this were issues about where the code should be stored.  Ideally, the code would become citable item so that scientists get recognition when others use it. Reproducibility of results was also discussed.  Using open source software, as opposed to proprietary code whose internal workings are a commercial secret, ensures that the exact versions of software used will always be available to those attempting to reproduce a result.

The Great Debate – Shale gas: to frack or not to frack

Hydraulic fracturing, also known as fracking, involves pumping high-pressure water into underground rocks, forcing them to crack and to release previously-inaccesible natural gas.  It is a controversial process, and the EGU Great Debate was advertised as an opportunity for top scientists do discuss the pros and cons of getting fossil fuels in this way.  These are summarised nicely in the session outline.

I was excited to watch this debate taking place in front of a technical audience, looking forward to getting into the details of charts of production rates in wells, descriptions of changes to rock properties during fracking and projections of future changes in global gas prices.  Many others were, too, and it was standing room only.  Disappointingly, the whole event turned out to be very thin on data.  One guy said that shale gas would all be gone in fewer than 20 years, then another said that it would last more than 100.  Neither presented any evidence for where those numbers had come from.  A wasted opportunity, I think.

[Since getting home, I’ve found Matt Herod’s write-up of the debate.  It seems that he was also disappointed by lack of hard data.  His post contains a link to the video of the debate and some good background information on fracking in general].

Categories: Uncategorized

Two years of volcan01010: Highlights of 2012

This week is the second anniversary of volcan01010.  With this post, I want to give an overview of what I have been writing about over the past year.  If you are new to the blog, then it should give you an idea of what it is all about: Volcanoes, Iceland and (geo)scientific computing.

Volcan:

The volcano posts of this year, as last year, are quite Icelandy.  They cover specific aspects of the recent Grímsvötn and Eyjafjallajökull eruptions, as well has some general volcanology themes.

  • Ten swimming pools of travel chaos
    For all the trouble that it caused, the volume of Eyjafjalljökull magma that formed the ash that reached Europe was actually quite small.

  • Gas, not ice, makes subglacial rhyolite explode
    A feature-length post explaining why volcanoes explode, with an icy twist.  This is one of the posts that I started the blog in order to write.

  • Happy Anniversary Grímsvötn
    How variable wind directions split the Grímsvötn plume and showed that real volcanic eruptions are always more complicated than the theory suggests.

  • Sounds of the Underground
    Sped up seismic data lets you ‘hear’ earthquakes and eruptions from an earthworm’s point of view.  Hear Colima volcano sing.

I spent 18 weeks of last year on fieldwork in Iceland.  It was busy, but I managed a few posts from the field.  For 3 weeks, I had @al_monteith with me, so check out his blog for more Iceland fieldwork photos and stories.

  • Iceland horse fun
    Iceland horses have a lot of personality – a postcard from the field.

01010:

I also still get lots of hits on my All the software a geoscientist needs. For free! post, which is good as this is another of the posts that I always wanted to write.

General geology / Environment:

Stories from 2011

If you liked any of these, there is another batch in the One year of volcan01010 post.

Coming up in 2013

It’s been a busy year.  I managed to write something new at least once per month this year and I hope to keep that pace through the next year.  When you follow loads of journalists on Twitter it makes your productivity feel really low, but they don’t have maps to make, samples to analyse or students to teach!  Some things in the pipeline include the results of the Grímsvötn 2011 public sticky tape sampling exercise and a video on how to use Python for science.  Stay tuned.

Subscribe, then tell all your friends

The best way to follow volcan01010 is to subscribe to the RSS feed.  If you’ve never heard of RSS, read this guide.  It lets you keep track of posts that you have read and tells you when a new one is out.  You can also follow me on Twitter (@volcan01010).  This way you get updates with other news and links that I think are cool.  Remember that you can also find old posts on the Every Post Ever page.

Volcan01010 now has 459 followers on Twitter (up from 201 last year), and in the last 12 months the blog scored 20,897 page views from 10,961 unique visitors in 147 countries (with the vast majority in the UK and USA).  The numbers of hits are similar to the previous year, but there were no eruptions in Iceland this year (during the eruption in May 2011, the Grímsvötn eruption – Frequently Asked Questions pulled in 1,400 hits in a single day).  Traffic comes in more steadily now and is spread across more posts.  It is satisfying that there hasn’t been a single day in the past six months when fewer than 10 people visited the blog.

If you find the blog interesting or useful, then please tell all your friends.  Then tell them to tell all their friends, too.

scientist talking to a load of other scientists.  There is no hype, no dramatic music, and no cute baby polar bears.  There are only data, graphs and trying to understand what they all mean.
Categories: Uncategorized

Processing ARSF remote sensing data with open source GIS tools

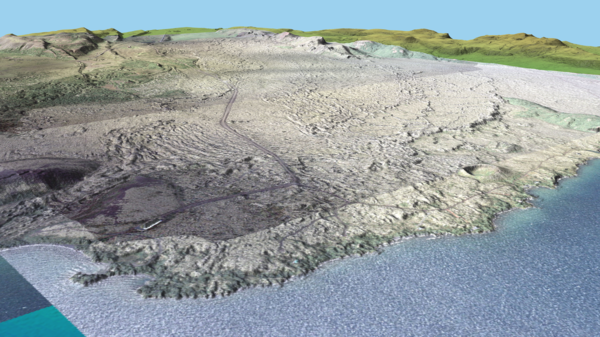
Orthorectified aerial photographs of the Nesjahraun, Iceland, draped over LiDAR-derived topography visualised in GRASS’s NVIZ module. Click to enlarge.

The UK National Environment Research Council’s Airborne Research and Survey Facility (NERC ARSF) is an aircraft used for scientific research. The on-board instruments include LiDAR, high resolution camera, and multispectral and hyperspectral infrared scanners.  The aim of this post is to share an article and slides from a talk that I gave in 2009 that demonstrate how these data can be processed with free and open source tools.

The slides and articles also illustrate some of the ways that GRASS GIS can be used to process remote sensing data in general.

Getting started with GRASS GIS

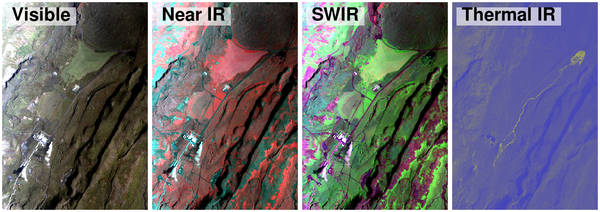
Multispectral infrared data channels combined in GRASS to highlight different landscape/vegetation features. If you have visited Iceland, you may recognise the Nesjavellir geothermal plant, with its steam and warm river. Click the image to enlarge.

GRASS GIS is a fully-featured open source GIS package.  In talk and article I describe using it to process LiDAR point clouds, orthorectify aerial photos, calculate slope/aspect maps, digitise geological information, import field data and to visualise and export data in a variety of formats.  From a remote-sensing perspective, the Image Processing features include things like image classification and fusion.

Early versions of GRASS were mainly command-line based, so the learning curve can be a bit steep, but the GUI has improved significantly (especially from 6.4.2 onwards).  The command line has the advantage of easy scripting, and the latest versions are moving to Python which will make it simple to include GIS processing in other workflows.

The following tips will help you get started with GRASS:

  • Install GRASS from the website.  As it was initially developed on the UNIX operating system, the Linux and Mac versions are better.  Windows users should install the OSGeo4W package, which also includes a number of other useful programs e.g. QGIS.
  • Download+print/buy a copy of Open Source GIS: A GRASS GIS Approach and have an actual physical copy beside you as you work.  It is an excellent reference.
  • Visit the pages for first time users on the GRASS website and learn about locations and mapsets.
  • Join the ‘grass-user’ mailing list.  Your questions will be answered very quickly (often by the developers themselves) and you can see examples of how others use it.
  • Bookmark the GRASS Search Engine, where you can often find answers in the mailing list archives.

Further reading

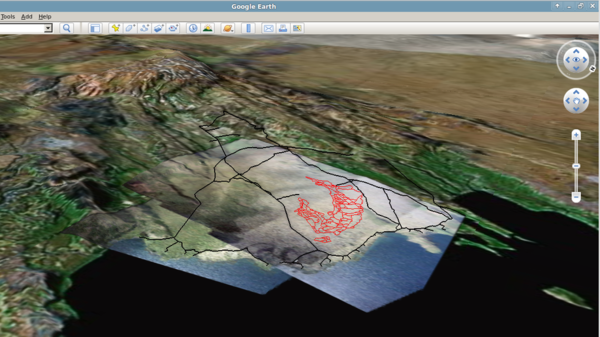
Orthorectified aerial photographs of the Nesjahraun, combined with digitised field data exported to GoogleEarth via GDAL. Click to enlarge.

To see a list of open source tools useful to geoscientists, see All the software a geoscientist needs: For free! There is also a list on Wikipedia of free and open source geophysics software.

The data that I processed was used in a study of an Icelandic lava flow that went into a lake.  You can see how it was used in the following articles:

  1. Stevenson, J. A., N. C. Mitchell, M. Cassidy, and H. Pinkerton (2011), Widespread inflation and drainage of a pahoehoe flow field: the Nesjahraun, Þingvellir, Iceland. Bulletin of Volcanology, doi:10.1007/s00445-011-0482-z.
  2. Stevenson, J. A., N. C. Mitchell, F. Mochrie, M. Cassidy, and H. Pinkerton (2011), Lava penetrating water: the different behaviours of pahoehoe and ‘a‘a at the Nesjahraun, Þingvellir, Iceland. Bulletin of Volcanology, doi:10.1007/s00445-011-0480-1.
Categories: Uncategorized