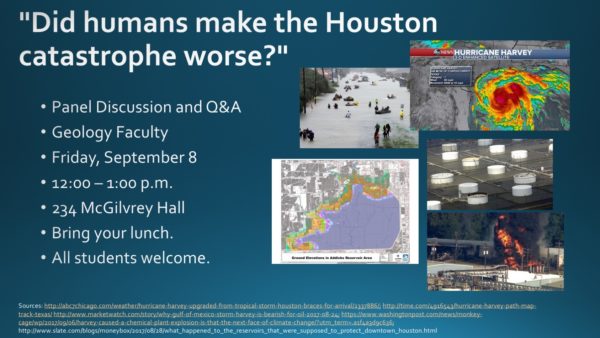
Hurricane Harvey and the Houston flood: Did Humans Make it Worse? (Part 1: Climate Change)

A post by Anne JeffersonThis Friday at noon, the Kent State University Department of Geology is hosting a panel discussion on the human role in the catastrophic flooding experienced by Houston and surrounding communities in the wake of Hurricane Harvey. I will be one of five faculty participating in the discussion. Since I know that many of you aren’t local, I thought I’d summarize my talking points below.

What’s the connection between climate change, hurricanes, and rain?

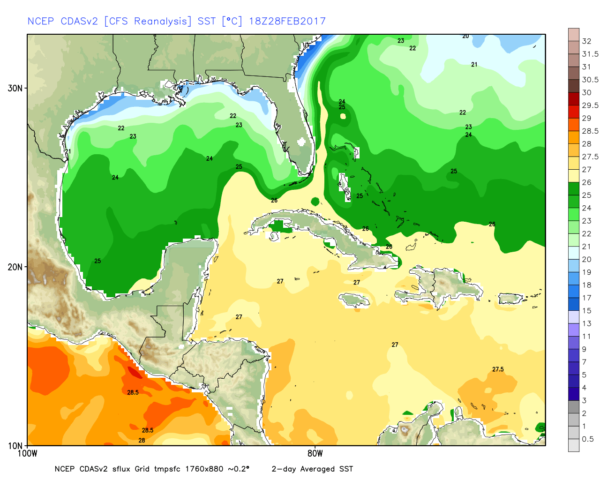
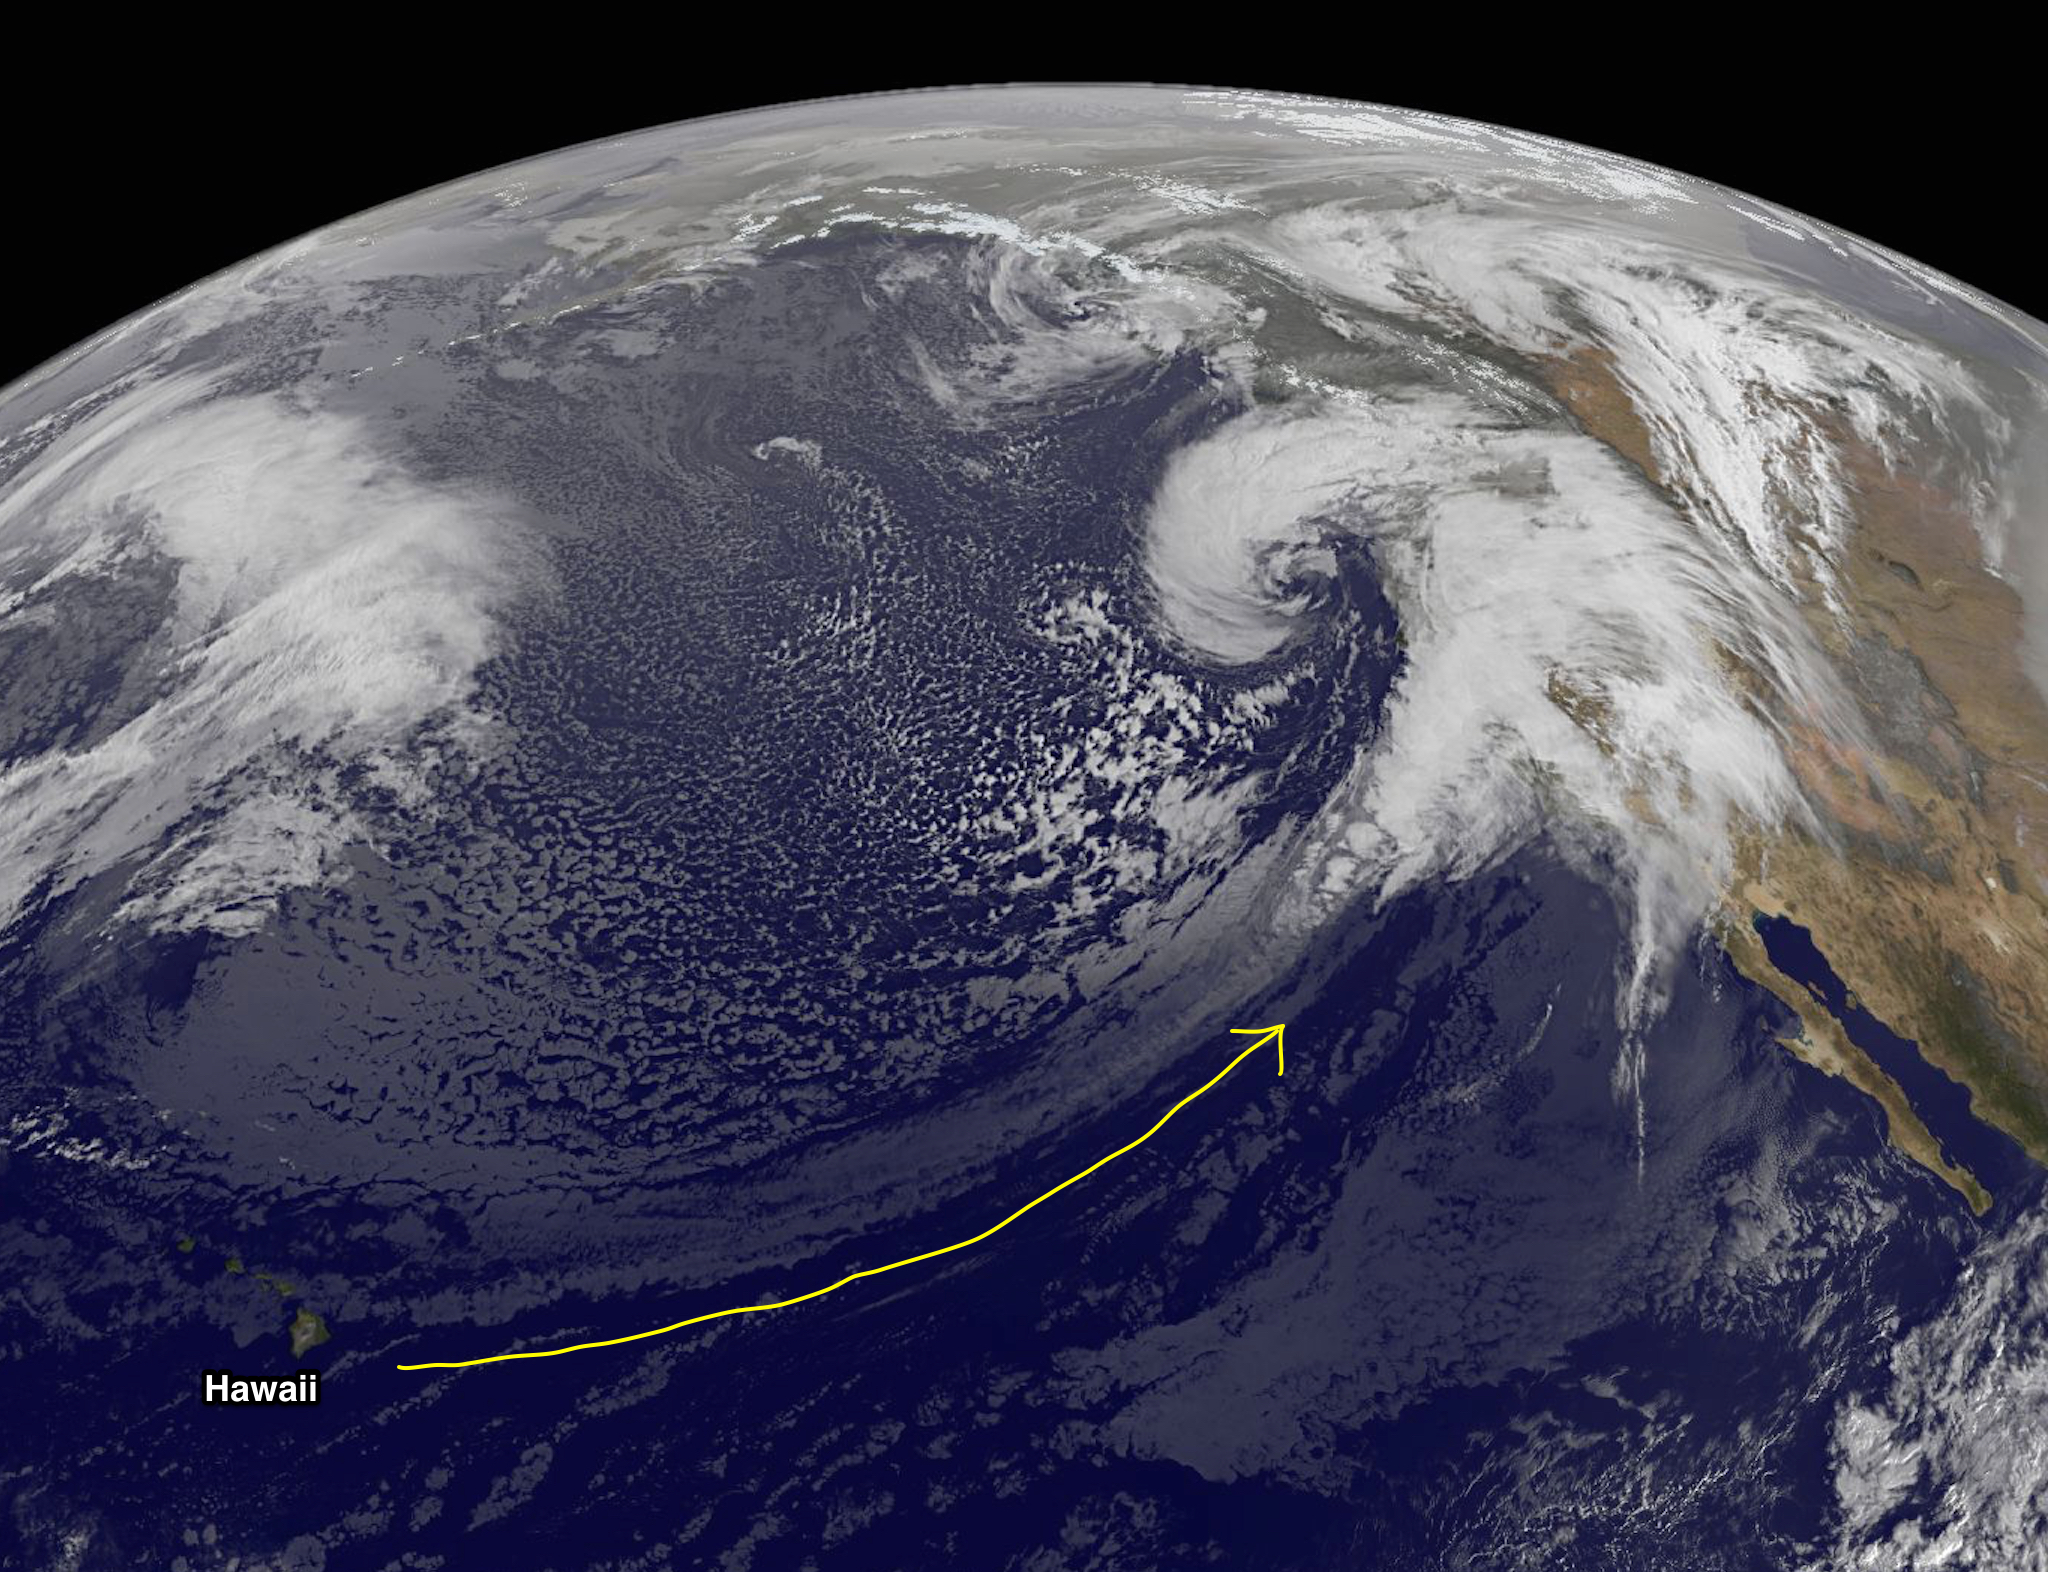
Established Physics: Warmer sea surface temperatures lead to more intense hurricanes. And the Caribbean and Gulf of Mexico are really warm right now. That’s also one of the reasons that Irma has been able to maintain its Category Five status for such an unprecedented length of time. You can read more about how hot waters fuel hurricanes in this NASA Earth Observatory post on Irma.

NASA Earth Observatory image of Irma's path (as of September 6) and sea surface temperatures,

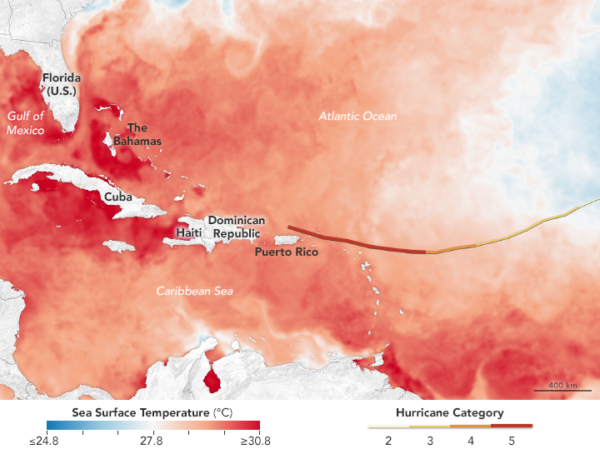
NASA Earth Observatory image of Irma’s path (as of September 6) and sea surface temperatures, September 3-5.

Simple Math: Sea level rise contributes to a higher storm surge. Storm surge wasn’t the problem in Houston, but it was a contributor the major damage that occurred in the coastal communities where Harvey made landfall and it’s a huge piece of the story in the devastating destruction that Irma is causing in the Caribbean right now. Of course, higher storm surges aren’t a problem if you have buildings higher relative to the sea level. But our buildings aren’t rising as fast as sea level, so higher sea levels and higher storm surges mean more storm surge damage.

Established Physics: Warmer atmospheres can hold more water, which leads to more big rains, which leads to more big floods. The physics of increasing saturation capacity with warmer air are taught to every meteorologist, via the Clasius-Claperyon equation. If you are not a meteorologist, Climate Central has a basic primer in the context of hurricanes. When that warm saturated air cools down, that’s when we get tremendous rains, because now the air isn’t warm enough to hang onto all that water vapor. In hurricanes, the cooling of the air (and rain generation) occurs simply because of warm air rising up into cooler parts of the atmosphere.

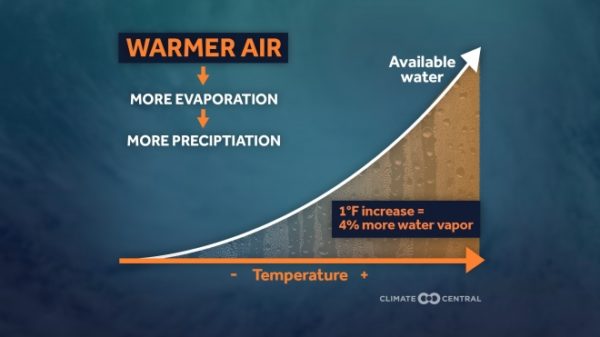
Climate Central’s graphic illustrating how warm air can hold more water and how that leads to more rain.

Possible: Climate change may lead to more rapid intensification of hurricanes. Harvey was one of the most rapidly intensifying hurricanes on record.

Possible: Climate change creates more ”stationary weather patterns” that hold weather in one place for days. The thing that really turned Harvey into an epic catastrophe for Houston was that it stayed in one place for days, rather than moving on to new places to drench. Michael Mann has a really nice explanation of how stationary weather patterns were in place during Harvey in this piece in the Guardian. Stationary weather patterns have also previously been blamed for terrible peat fires in Siberia and deadly heat waves in Europe, so they are not just a problem for hurricanes.

In my view, the science is incontrovertible, human-caused climate change contributed to the severity of Harvey’s impacts on Texas. I’m sure there are rapid attribution studies already kicking off that will be able to give us some sense of how much worse the wind and rain were as a result of our green house gas emissions.

Read on for Part 2: Did urbanization make the flooding in Houston worse?

Categories: by Anne, climate science, geohazards

August climate impacts stories: Hurricane Harvey, other climate change fueled-floods, and more

August 30th: Harvey reminds us that we should treat climate change as we treat other public health threats. That’s the argument in this New York Times op-ed: Harvey, the storm that humans helped cause.

Holthaus-harveyAugust 29th: The most sobering hot-take on Harvey is by Eric Holthaus: Harvey is what climate change looks like.

August 27: Michael Mann offered a clear explanation of the climate change-Hurricane Harvey connection.

Climate change boosts hurricanes through higher and hotter seas say @KHayhoe @AndrewDessler: The relationship between hurricanes and climate change.

August 26: Rapid hurricane intensification, like we’ve seen with Harvey, is consistent with climate change, writes Chris Mooney.

August 25: First tanker crosses Arctic from Europe to Asia-without icebreaker help. Fleet of 15 coming soon.

August 24:Alaska’s permafrost is thawing, and that has huge implications, locally, regionally, and globally. (My colleagues Beth Herndon and Lauren Kinsman-Costello are studying how permafrost melt, wetlands, carbon, and phosphorus interact in the Alaskan tundra.

2017WarmNights_cleveland_en_title_lgAugust 23: As the number of warm nights is increasing, it makes it harder to recover from heat waves.

August 22: Britain’s seabird colonies face catastrophe as warming waters disrupt their food supply. But we don’t know exactly how big problem is because the UK government won’t fund a new seabird census. The last one was done in 2000.

August 20: High Ground Is Hot Property as Sea Level Rises: Climate Gentrification in Miami.

August 19: Climate gloom and doom? Bring it on. But we need stories about taking action, too. (via @ClimateCuddles)

August 16:Humid heat waves that can kill healthy people in hours will affect millions in South Asia in decades.

August 15:

August 14th: 91 volcanoes discovered under the West Antarctic Ice Sheet!!!! This is so exciting on multiple levels, from the pure geo-nerdery to the potential climate change impacts. Geeking out. (Read Andrew Freedman’s article for all of the details, but its possible that (1) geothermal heating associated with the volcanoes will contribute to melting and destablization; (2) melting the ice sheet could enhance volcanic activity as the pressure is released; and (3) the volcanoes will help anchor the ice sheet in place and reduce the possibility of catastrophic collapse. These are not mutually exclusive possibilities.)


August 13th: Flooding in Miami now happens every spring tide. Rainfall & storm surges don’t help out either. I liked the headline in the Washington Post: “Flooding in Miami is no longer news – but it is certainly newsworthy.”

August 12th: Sometimes you just have to laugh, so you don’t cry. Talking about climate politics, with humor. Thanks, Stephen Colbert.


August 11th: Climate change fueled a mega-rainstorm that flooded Louisiana 1 year ago, and the vulnerable people caught in the flood are still picking up the pieces. Special and important reporting by Climate Central.

August 10th: A new paper in Science shows that European floods have shifted in timing, up to 2 weeks earlier per year, since 1950. What’s particularly intriguing about the study is that the timing shifts haven’t just occurred in snowy regions, but also in places where rainfall is causing water tables to rise and soils to become more saturated earlier in the spring.

August 9th: Erratic weather affects subsistence rice farmers in Madagascar, further proof that some of the worst climate change impacts will be felt by those least responsible for causing it.

August 7th: Peru’s glaciers have made it a laboratory for adapting to climate change. It’s not going well. This is a really nice feature story from the Washington Post.

August 5th: A new report says that extreme heat & weather could kill 50x more people per yr in Europe by 2100 than today. That may be overestimate, but a more reasonable number in the report is that 2 out of every 3 Europeans will be affected by weather disasters (per year?) compared to 1 in 20 today. Heat waves will account for 99% of all the excess deaths predicted, and it’s awfully hard to relocate away from a heat wave.

August 4th: If you are not yet listening to smart & human commentary on climate change, what’s stopping you?


August 2nd: A visualization that condenses space and time to tell a powerful story about the local and global impacts of climate change through the 20th century and beyond.


Categories: by Anne, climate science, hydrology, ice and glaciers, links

#365climateimpacts: A crazy February heatwave and a tornado warning on March 1 (February 16-March 3)

A post by Anne JeffersonHere are two more weeks of daily climate change impacts stories, as part of my #365climateimpacts project. I didn’t have to go very far from home to find inspiration for this fornight of tweets. We had an incredibly unusual heat wave in the Midwest, and March came in like a lion with a 6 am tornado warning. Amidst all the heat, I did also sneak in some glaciers and polar bears and other climate change impacts. Read on for all of the stories…

February 16:
Documenting Glaciers in the Dying Days of Ice. This piece follows the National Park Service photographer charged with capturing images that show how much Glacier National Park’s iconic glaciers have retreated in the last century. Click through to look at some incredible before and after photo pairs.

February 17:
River flows in New England are increasing & they’re delivering more carbon to Gulf of Maine. That could have an effect on algae blooms, ecosystem productivity, and carbon sequestration in coastal waters.

February 18:
Extreme weather is increasing in a changing climate. Akron (Ohio) February temperatures average -2.4C. It’s 18C outside.

A snapshot of some very unusual February weather for northeastern Ohio, via the Weather Underground mobile app.

February 19:
2017 spring in the South is 20 days earlier than the 1981-2010 average. That’s astounding.

February 20:
Who’s still fighting climate change? The US military. Sea level rise is the enemy.

February 21:
Do we have language that describes ways we feel about living in a changing climate? A great essay by Faith Kearns on a interesting initiative to coin words that describe the way we feel about our unusual climatic conditions. I think sorrowbliss begins to describe the ongoing February heatwave we’re experiencing.

February 22:
Colorado River flows will keep shrinking as we warm through the 21st Century, even aside from the greater likelihood of drought. Warmer temperatures increase evaporation & plant water use, and that’s drying out the Colorado River. Link above is to a pretty good summary of a new research paper out in Water Resources Research.

February 23:

February 24:
Scarily warm. Andrew Freedman explains what’s behind the February heatwave that is shattering records. A while ago, I thought: when I’m done talking about snow & atmospheric rivers for #365climateimpacts, I should talk about Australian heat, and I should, because it’s a huge climate change impact. But then my kids’ friends started wearing shorts to school. In February.

February 25:
This cartoon perfectly captures my sorrowbliss at the freakishly hot weather we’ve been having in February. Mad appreciation to the cartoonist, Sarah Andersen.

Dr. Warren Washington (UCAR photo)

February 26:
Dr. Warren Washington is global climate modeler who won the National Medal of Science for his contributions to the field. He’s one of many Black American scientists and engineers who have made contributions that we often fail to recognize and celebrate. Here’s one brief bio, and here’s another.

February 27 (Polar Bear Day):
Here’s a great fact-filled 1 minute video about polar bears, those charismatic emblems of climate change. I know polar bears are the stereotypical mascots of climate change, but I’ve loved them since I was 4 & got to see them in Churchill, Canada. That’s why they work as the most recognizable mascot of climate change, because so many people (like me) fell in love with them as children. My 2 year old’s beloved teddy is a white bear. Wouldn’t it be great if weren’t extinct (or only in zoos) by the time he’s my age?

February 28:
As it warms, California will have more floods. Levees & dams not built for winter rains. They are built to store and contain spring snowmelt.

March 1:
Today I was awoken by a tornado warning. Incredibly unusual at this time of year in Ohio. Effects of February hot spell. (I’ve not heard of any confirmed tornado touchdowns today in NE Ohio, but to even have storms capable of tornadogenesis is super-unusual.)

March 2:
The Gulf of Mexico didn’t cool below 23 degrees Celsius this winter, for the first time ever. These warm temperatures may increase tornadoes in the US, but there doesn’t seem to be a link with hurricanes (which are affected by summer water temperatures).

Sea surface temperatures in the Gulf of Mexico, 28 February 2017 (via Ars Technica)

Categories: by Anne, climate science, geohazards, hydrology, ice and glaciers

#365climateimpacts: Snow, ice, flooding, and football (February 1-15)

In January, I launched the #365climateimpacts project, in which I’ll spend a year tweeting stories of the many ways climate change is impacting people, ecosystems, and the earth; ideas for how to communicate about climate change more effectively; and analyses of technologies and policy proposals that show promise for combatting climate change. Here’s what I’ve shared in the last two weeks.

February 1:
The Climate Feedback project looks like an awesome way to see how scientists read climate change news.

The most recent analysis on the site is of an article called "The big melt: global sea ice at a record low", published by USA Today.

The most recent analysis on the site is of an article called “The big melt: global sea ice at a record low”, published by USA Today.

February 2 (Groundhog Day):
Climate Change versus Groundhogs: Even Common Species Will Suffer. (Not pictured: the groundhog who is digging up by back garden.)

February 3:
Melting glaciers affect water supply in Andes of Peru & scientists are on it. Video by @LaurenDSomers.

February 4:
Screen Shot 2017-02-12 at 4.01.04 PM

I see a trend – and my eyes don’t deceive. Great Lakes annual average ice cover declined 71% from 1973-2010.

February 5 (Superbowl Sunday):
Is Climate Change Making Temperatures Too Hot for High School Football? Will it get too hot for football in the South? State rules aim to prevent heat deaths.

February 6:
Screen Shot 2017-02-12 at 2.55.54 PM
What does a graph like this mean? It means ocean is taking up heat that CO2 emissions would otherwise add to atmosphere.

February 7:
I got a bit gif happy with today’s #365climateimpacts tweetstream, so you should really head over to twitter to enjoy the thread. I like snow. I like to sled, build snowmen, snowshoe, and how pretty snow is. Loss of snow is one reason I care about climate change. Today it is 57 F and raining steadily here in NE Ohio. I keep thinking about how we’d have a foot of snow if it were cold enough. Instead, I spent an hour in my class talking about the fun ways hydrologists have of measuring snow. With bare ground outside.

The average US snow season shortened by 2 weeks since 1972. Snow covered area is decreasing. The figure below is from the US EPA’s great Climate Change Indicators site, under the heading “Snow Cover.

This figure shows the timing of each year’s snow cover season in the contiguous 48 states and Alaska, based on an average of all parts of the country that receive snow every year. The shaded band spans from the first date of snow cover until the last date of snow cover.

This figure shows the timing of each year’s snow cover season in the contiguous 48 states and Alaska, based on an average of all parts of the country that receive snow every year. The shaded band spans from the first date of snow cover until the last date of snow cover.

Climate normals say that my area averages 45″ of snow per winter, but I haven’t seen anywhere near that most of the 5 years I’ve lived here. Of course, 5 years isn’t long enough to identify any trend (I’m not arguing it is), but my experience fits in the pattern of less snowy winters that are being observed across the United States. Here’s some data stretching 60 years. The figure below is from the US EPA’s great Climate Change Indicators site, under the heading “Snowfall.” Red is less snow, more rain.

This figure shows the average rate of change in total snowfall from 1930 to 2007 at 419 weather stations in the contiguous 48 states. Blue circles represent increased snowfall; red circles represent a decrease.

This figure shows the average rate of change in total snowfall from 1930 to 2007 at 419 weather stations in the contiguous 48 states. Blue circles represent increased snowfall; red circles represent a decrease.


(PDF versions of the Snow Cover and Snowfall pages)

February 8 (National Kite Flying Day):
Good morning, Twitter. It’s National Kite Flying Day! Do you think I can tie that to climate change?
President Obama has been appreciating kite flying, recently.
Back in the day, it wasn’t just surfboards powered by wind. It was big ships. Admittedly, with sails, not kites, but I’m doing the best I can to tie to #nationalkiteflyingday.
Modern shipping produces huge amounts of greenhouse gas emissions and wind is a renewable, carbon-free energy source.
One idea is to attach big kites to ships to provide free & CO2-free energy.

February 9:
It’s the middle of winter & something is seriously wrong with Arctic sea ice. Sea ice hit record low extents in November, December, and January. Nice reporting at Mashable by Andrew Freedman.
seaice

February 10 (National Umbrella Day):I
Climate change intensifies the water cycle, increasing heavy rainfall events. The figure below is from the US EPA’s great Climate Change Indicators site, under the heading “Heavy Precipitation”.

This figure shows the percentage of the land area of the contiguous 48 states where a much greater than normal portion of total annual precipitation has come from extreme single-day precipitation events. The bars represent individual years, while the line is a nine-year weighted average.

This figure shows the percentage of the land area of the contiguous 48 states where a much greater than normal portion of total annual precipitation has come from extreme single-day precipitation events. The bars represent individual years, while the line is a nine-year weighted average.


(pdf version of the Heavy Precipitation Climate Change Indicators page)

February 11:
The first year’s results from NASA Project OMG (Oceans Melting Greenland) reveal that Greenland’s thick glaciers in deep water are most affected by warmer ocean waters. Follow the project lead scientist Josh Willis @omgnasa on Twitter.

February 12:
Suburbs are increasingly threatened by wildfires due to climate change. The wildland-urban ecotone is where warmer winters longer droughts & climate change consequences flare up.

February 13:
With lots of attention focused on the massive rainfall, flooding, and dam and levee safety issues in California, it seemed like a good time to find out how climate change is expected to alter rainfall patterns in the state. Sure enough, “pineapple express” storms (that bring lots of rain to high elevation areas where it normally snows) are expected to increase as the climate warms.

Satellite image showing narrow band of clouds stretching from Hawaii to California

A “pineapple express” atmospheric river takes aim at California in December 2014. (NOAA/NASA GOES image)

February 14:
Minnesota Public Radio ran a fantastic feature on how climate change is affecting ice cover on Lake Superior between Bayfield and Madeling Island, Wisconsin. For 250 year-round residents of the island, winter offers an ice road and the freedom to move back and forth without being tied to the ferry schedule. Except that, for two years running, the ice hasn’t been thick enough to drive on and the ferry has run all winter. This story is personal for me, because my family has owned land on Madeline Island for 4 generations, and I remember the thrill and terror of driving the ice road on winter visits.

The view from our family's land on Madeline Island, February 3rd, 2017. Photo courtesy of J. Jarvis.

The view from our family’s land on Madeline Island, February 3rd, 2017. Photo courtesy of J. Jarvis.

February 15:
The New York Times highlights a rare Republican call to climate action, in which the “elder statesmen” of the Climate Leadership Council calls for a carbon tax. A report out earlier this month from the Yale Program on Climate Change Communication, shows that 62% of Trump voters support either taxation or regulation of greenhouse gases. The question is: Will Republican politicians listen to the elders or the voters, or will they continue to deny climate change and obstruct meaningful actions to slow its course.

Categories: by Anne, climate science, environment, hydrology, ice and glaciers

Oroville Dam: Water and Weather, Engineering and Erosion at the Nation’s Tallest Dam

A post by Anne Jefferson

California is having a very wet winter, with multiple atmospheric rivers dumping feet of precipitation in the mountains. Oroville Dam on the Feather River, is the nation’s tallest dam, is facing serious engineering challenges. This Storify has some of the best links to a rapidly evolving situation.

https://storify.com/highlyanne/oroville-dam

Categories: by Anne, geohazards, hydrology