
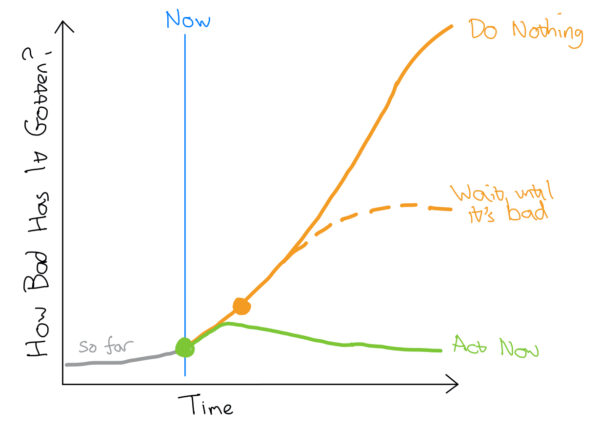
The early months of the COVID-19 pandemic introduced us to the idea of ‘bending the curve’: that acting early to reduce infection rates made a huge difference in whether the peak in infections was manageable or not.
The exponential nature of disease transmission, and the 1-2 week incubation period in which COVID-positive people could infect others without showing any symptoms themselves, meant that the best time to start lockdowns, social distancing, and other actions to slow the rate of transmission was so early on the “very bad things are about to happen” curve that the bad things had yet to really manifest. We had to act when the absolute number of reported cases was very low, because that was the number of people who had been infected two weeks ago, and the next two weeks of exponentially increasing infections had already been locked in. The higher we ascended the slope of bad things before acting, the higher we would have to climb before we could start descending again.
To everyone’s cost, the optimal course of action from the public health perspective proved extremely difficult to implement and sustain. We change our trajectories to avoid bad things all the time: every time we steer around an obstacle or duck a low hanging branch, we are bending the curve of our lives towards a better outcome. But in those cases, the danger is clear and present to us, and the hazard we are avoiding with our corrective manoeuvres passes right before our eyes. Our instincts are not well-tuned to collectively turning the wheel when the danger is only visible on maps that very few of us can read; and when there is too large a lag between our actions and the consequences that flow from them, we can find it hard to even connect the two.
So our response to the spread of COVID-19 was often reluctant, and very much contested. In many, many places we did not turn those steering wheels as much as we could have, as soon as we should have. Our curves were more like the dotted orange line in the sketch above than the green one: we could have saved the lives and long-term health of many, many people if we had acted sooner. And yet, there was still a world of difference between acting later than we should have and not acting at all. In the end, we did bend those curves – and thank goodness we did.
Which brings us to climate change. There is no doubt that we are beginning to reap in earnest what we have sown into the atmosphere over the past century or so. 2023 has now been declared the warmest year on record, meaning that every one of last 10 years is among the 10 warmest years ever recorded1. The 2020s began with apocalyptic bush fires in Australia, and the pace of extreme weather events striking all over the globe has refused to let up. Nowhere is truly immune from disruptive change: as I wrote last July about my current home2:
In just the last couple of weeks in Vermont, we have had air quality problems due to wildfires, a heatwave, and now the worst flooding in decades.
The story of the summer is that this is not an outlier – everywhere you look, you see extreme weather events…
…Welcome to the world of the unbent climate change curve.
For that is indeed the world we live in: if we map the climate crisis on to my sketch above, the off-ramp to take the green curve was in the 1990s and early 2000s. We did not take that exit, and our failure to check the growth of greenhouse gas emissions since has led to planetary heating very close to the modeled predictions from that time.
Our late start on trying to bend the curve means that we are committed to some climate change: the state of the planet in 2100 will be different from the state of the planet in 1900, with the consequent disruptions to the civilization we built assuming that previous state would persist – disruptions that will cause much loss and suffering.
But we have started. Investments in developing renewable energy technology have made solar and wind cheaper than any other method of power generation, and the pace of deployment has accelerated accordingly, far faster than predicted even a few years ago:
In its 2020 renewables report, the IEA forecast an additional 1,092 gigawatts (GW) of global capacity would be built between 2022 and 2026. It raised this to 1,496GW last year… in its latest report, the agency estimates that an extra 424GW of renewables capacity will now be built over this five-year period… This is a 28% increase on the previous estimate and up 76% from two years ago.
Importantly, this has already made a difference. In 2015, we were headed for a 3.5ºC increase in average global temperatures by 2100, but the latest estimates have us on course for 2.5ºC:
“climate policies and clean technologies deployed over just the past eight years [since the 2015 Paris agreement] have already erased a full degree Celsius of global warming from the future world in 2100.”
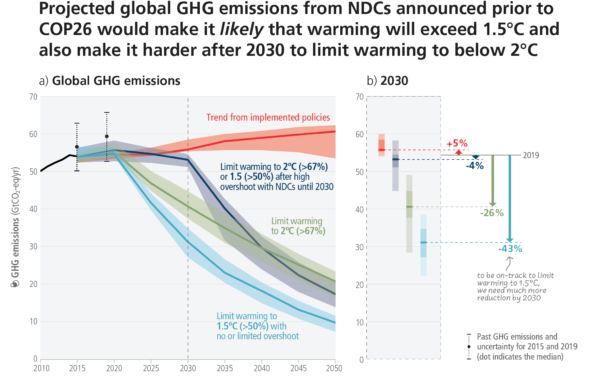
Is 2.5ºC still too much warming for comfort? Of course! But our efforts to decarbonise, faltering and ill-matched to the moment as they often seem, have already measurably shifted our path away from the worst futures. What we do now still matters – a lot – in determining how different the Earth will become by the end of this century and beyond. As the figure below shows, our current emissions trajectory (the red line) still needs to get rapidly bent downwards to reach a path that will limit overall warming to 1.5-2ºC (green and blue lines). Even waiting just a little bit to accelerate decarbonization (grey line) will make at least temporarily warming the planet beyond these limits – with all of the disruption and loss that will come with it – much more likely.
If we keep trying – rather than surrendering to climate doomerism – we can keeping bending the curve of bad things further downward. We can make it crest earlier and much less destructively. We can make it so that when people a few decades from now look back on 2023, it is closer to “as bad as it gets,” than “you ain’t seen nothing yet.”
Let’s choose to keep trying.
- Based on stories last year reporting that the 9 years up to 2022 were also the 9 warmest years in the record.
- Hopefully this summer pressed home the lesson that calling Vermont a “climate haven” – as some do – is only potentially true in the sense of ‘less bad than elsewhere’.