
In January, I launched the #365climateimpacts project, in which I’ll spend a year tweeting stories of the many ways climate change is impacting people, ecosystems, and the earth; ideas for how to communicate about climate change more effectively; and analyses of technologies and policy proposals that show promise for combatting climate change. Here’s what I’ve shared in the last two weeks.
February 1:
The Climate Feedback project looks like an awesome way to see how scientists read climate change news.
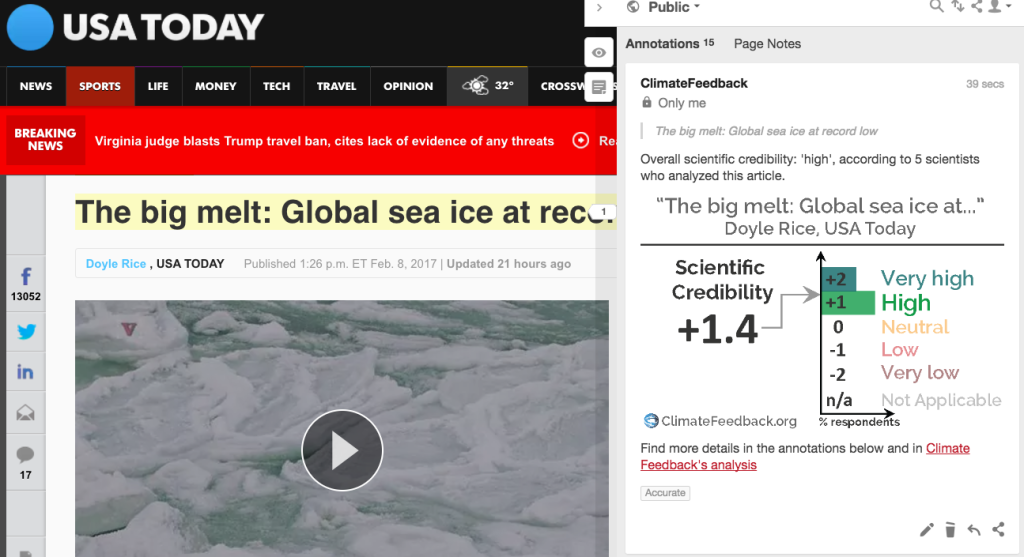
The most recent analysis on the site is of an article called “The big melt: global sea ice at a record low”, published by USA Today.
February 2 (Groundhog Day):
Climate Change versus Groundhogs: Even Common Species Will Suffer. (Not pictured: the groundhog who is digging up by back garden.)
February 3:
Melting glaciers affect water supply in Andes of Peru & scientists are on it. Video by @LaurenDSomers.
February 4:
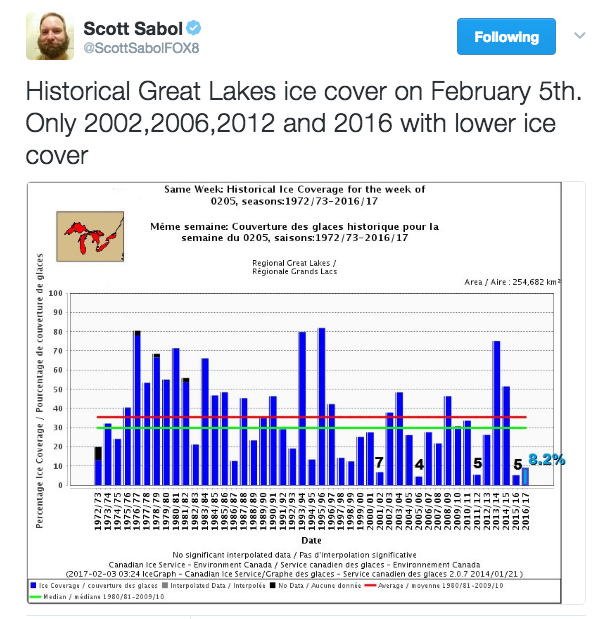
I see a trend – and my eyes don’t deceive. Great Lakes annual average ice cover declined 71% from 1973-2010.
February 5 (Superbowl Sunday):
Is Climate Change Making Temperatures Too Hot for High School Football? Will it get too hot for football in the South? State rules aim to prevent heat deaths.
February 6:
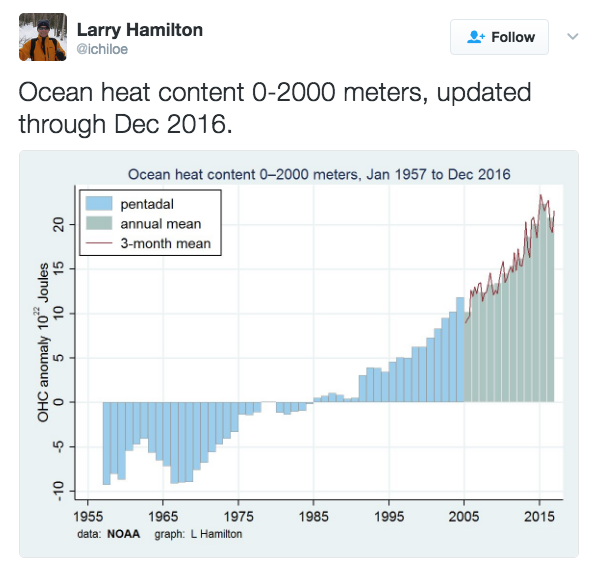
What does a graph like this mean? It means ocean is taking up heat that CO2 emissions would otherwise add to atmosphere.
February 7:
I got a bit gif happy with today’s #365climateimpacts tweetstream, so you should really head over to twitter to enjoy the thread. I like snow. I like to sled, build snowmen, snowshoe, and how pretty snow is. Loss of snow is one reason I care about climate change. Today it is 57 F and raining steadily here in NE Ohio. I keep thinking about how we’d have a foot of snow if it were cold enough. Instead, I spent an hour in my class talking about the fun ways hydrologists have of measuring snow. With bare ground outside.
The average US snow season shortened by 2 weeks since 1972. Snow covered area is decreasing. The figure below is from the US EPA’s great Climate Change Indicators site, under the heading “Snow Cover.”
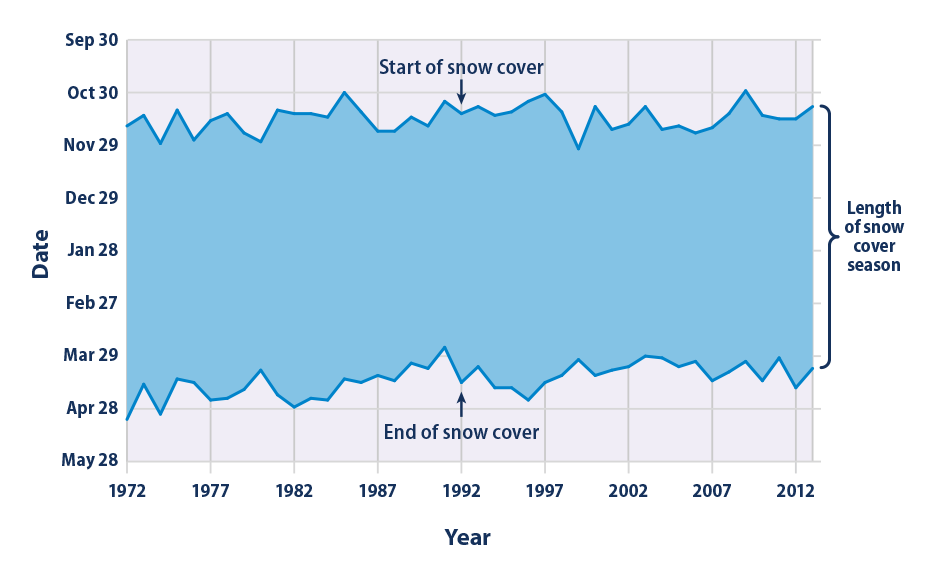
This figure shows the timing of each year’s snow cover season in the contiguous 48 states and Alaska, based on an average of all parts of the country that receive snow every year. The shaded band spans from the first date of snow cover until the last date of snow cover.
Climate normals say that my area averages 45″ of snow per winter, but I haven’t seen anywhere near that most of the 5 years I’ve lived here. Of course, 5 years isn’t long enough to identify any trend (I’m not arguing it is), but my experience fits in the pattern of less snowy winters that are being observed across the United States. Here’s some data stretching 60 years. The figure below is from the US EPA’s great Climate Change Indicators site, under the heading “Snowfall.” Red is less snow, more rain.
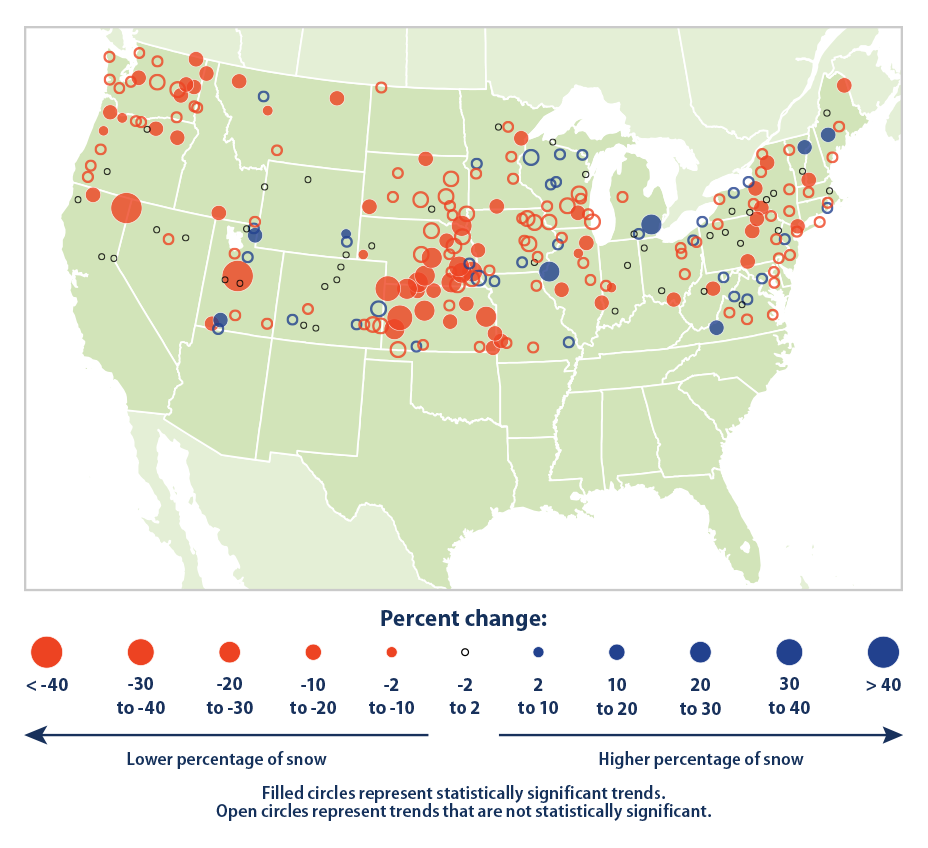
This figure shows the average rate of change in total snowfall from 1930 to 2007 at 419 weather stations in the contiguous 48 states. Blue circles represent increased snowfall; red circles represent a decrease.
(PDF versions of the Snow Cover and Snowfall pages)
February 8 (National Kite Flying Day):
Good morning, Twitter. It’s National Kite Flying Day! Do you think I can tie that to climate change?
President Obama has been appreciating kite flying, recently.
Back in the day, it wasn’t just surfboards powered by wind. It was big ships. Admittedly, with sails, not kites, but I’m doing the best I can to tie to #nationalkiteflyingday.
Modern shipping produces huge amounts of greenhouse gas emissions and wind is a renewable, carbon-free energy source.
One idea is to attach big kites to ships to provide free & CO2-free energy.
February 9:
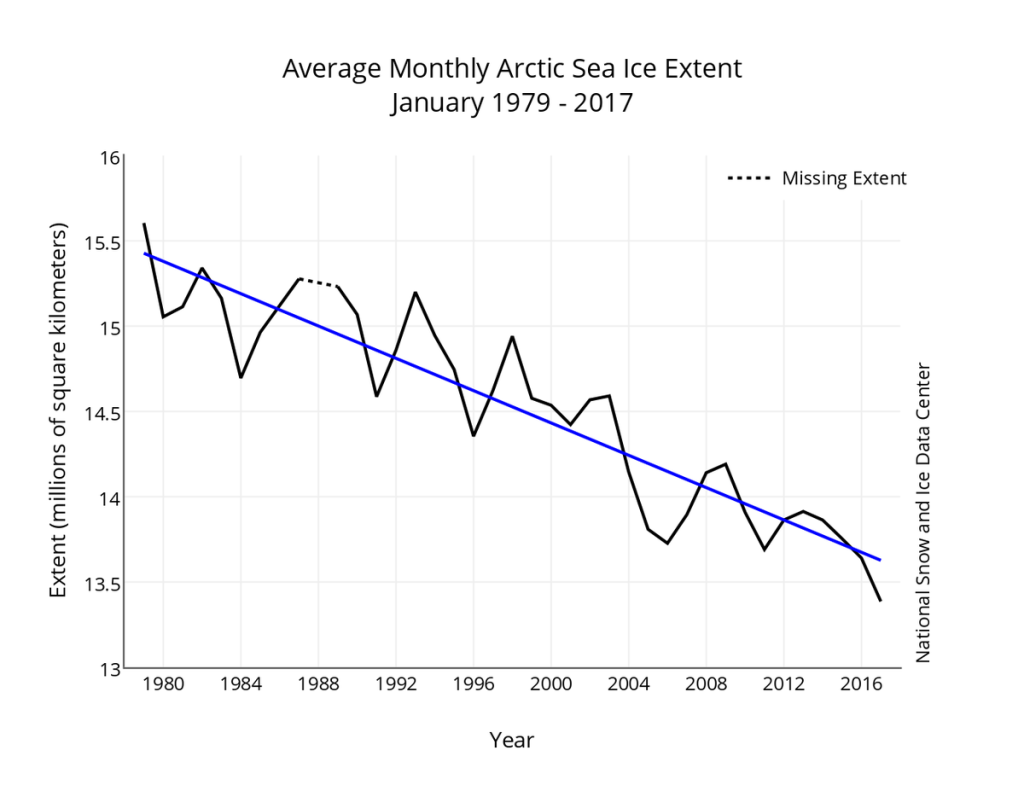
It’s the middle of winter & something is seriously wrong with Arctic sea ice. Sea ice hit record low extents in November, December, and January. Nice reporting at Mashable by Andrew Freedman.
February 10 (National Umbrella Day):I
Climate change intensifies the water cycle, increasing heavy rainfall events. The figure below is from the US EPA’s great Climate Change Indicators site, under the heading “Heavy Precipitation”.
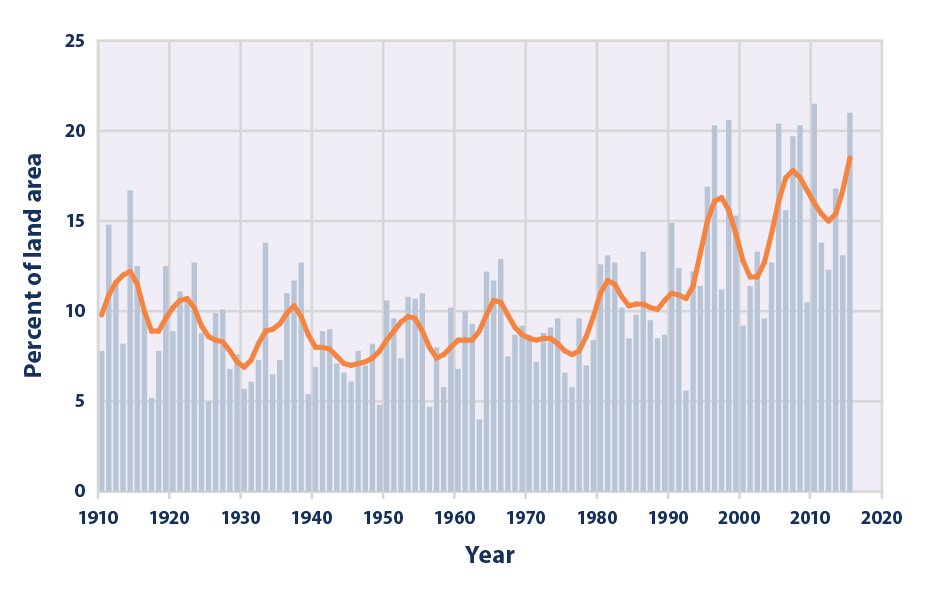
This figure shows the percentage of the land area of the contiguous 48 states where a much greater than normal portion of total annual precipitation has come from extreme single-day precipitation events. The bars represent individual years, while the line is a nine-year weighted average.
(pdf version of the Heavy Precipitation Climate Change Indicators page)
February 11:
The first year’s results from NASA Project OMG (Oceans Melting Greenland) reveal that Greenland’s thick glaciers in deep water are most affected by warmer ocean waters. Follow the project lead scientist Josh Willis @omgnasa on Twitter.
February 12:
Suburbs are increasingly threatened by wildfires due to climate change. The wildland-urban ecotone is where warmer winters longer droughts & climate change consequences flare up.
February 13:
With lots of attention focused on the massive rainfall, flooding, and dam and levee safety issues in California, it seemed like a good time to find out how climate change is expected to alter rainfall patterns in the state. Sure enough, “pineapple express” storms (that bring lots of rain to high elevation areas where it normally snows) are expected to increase as the climate warms.
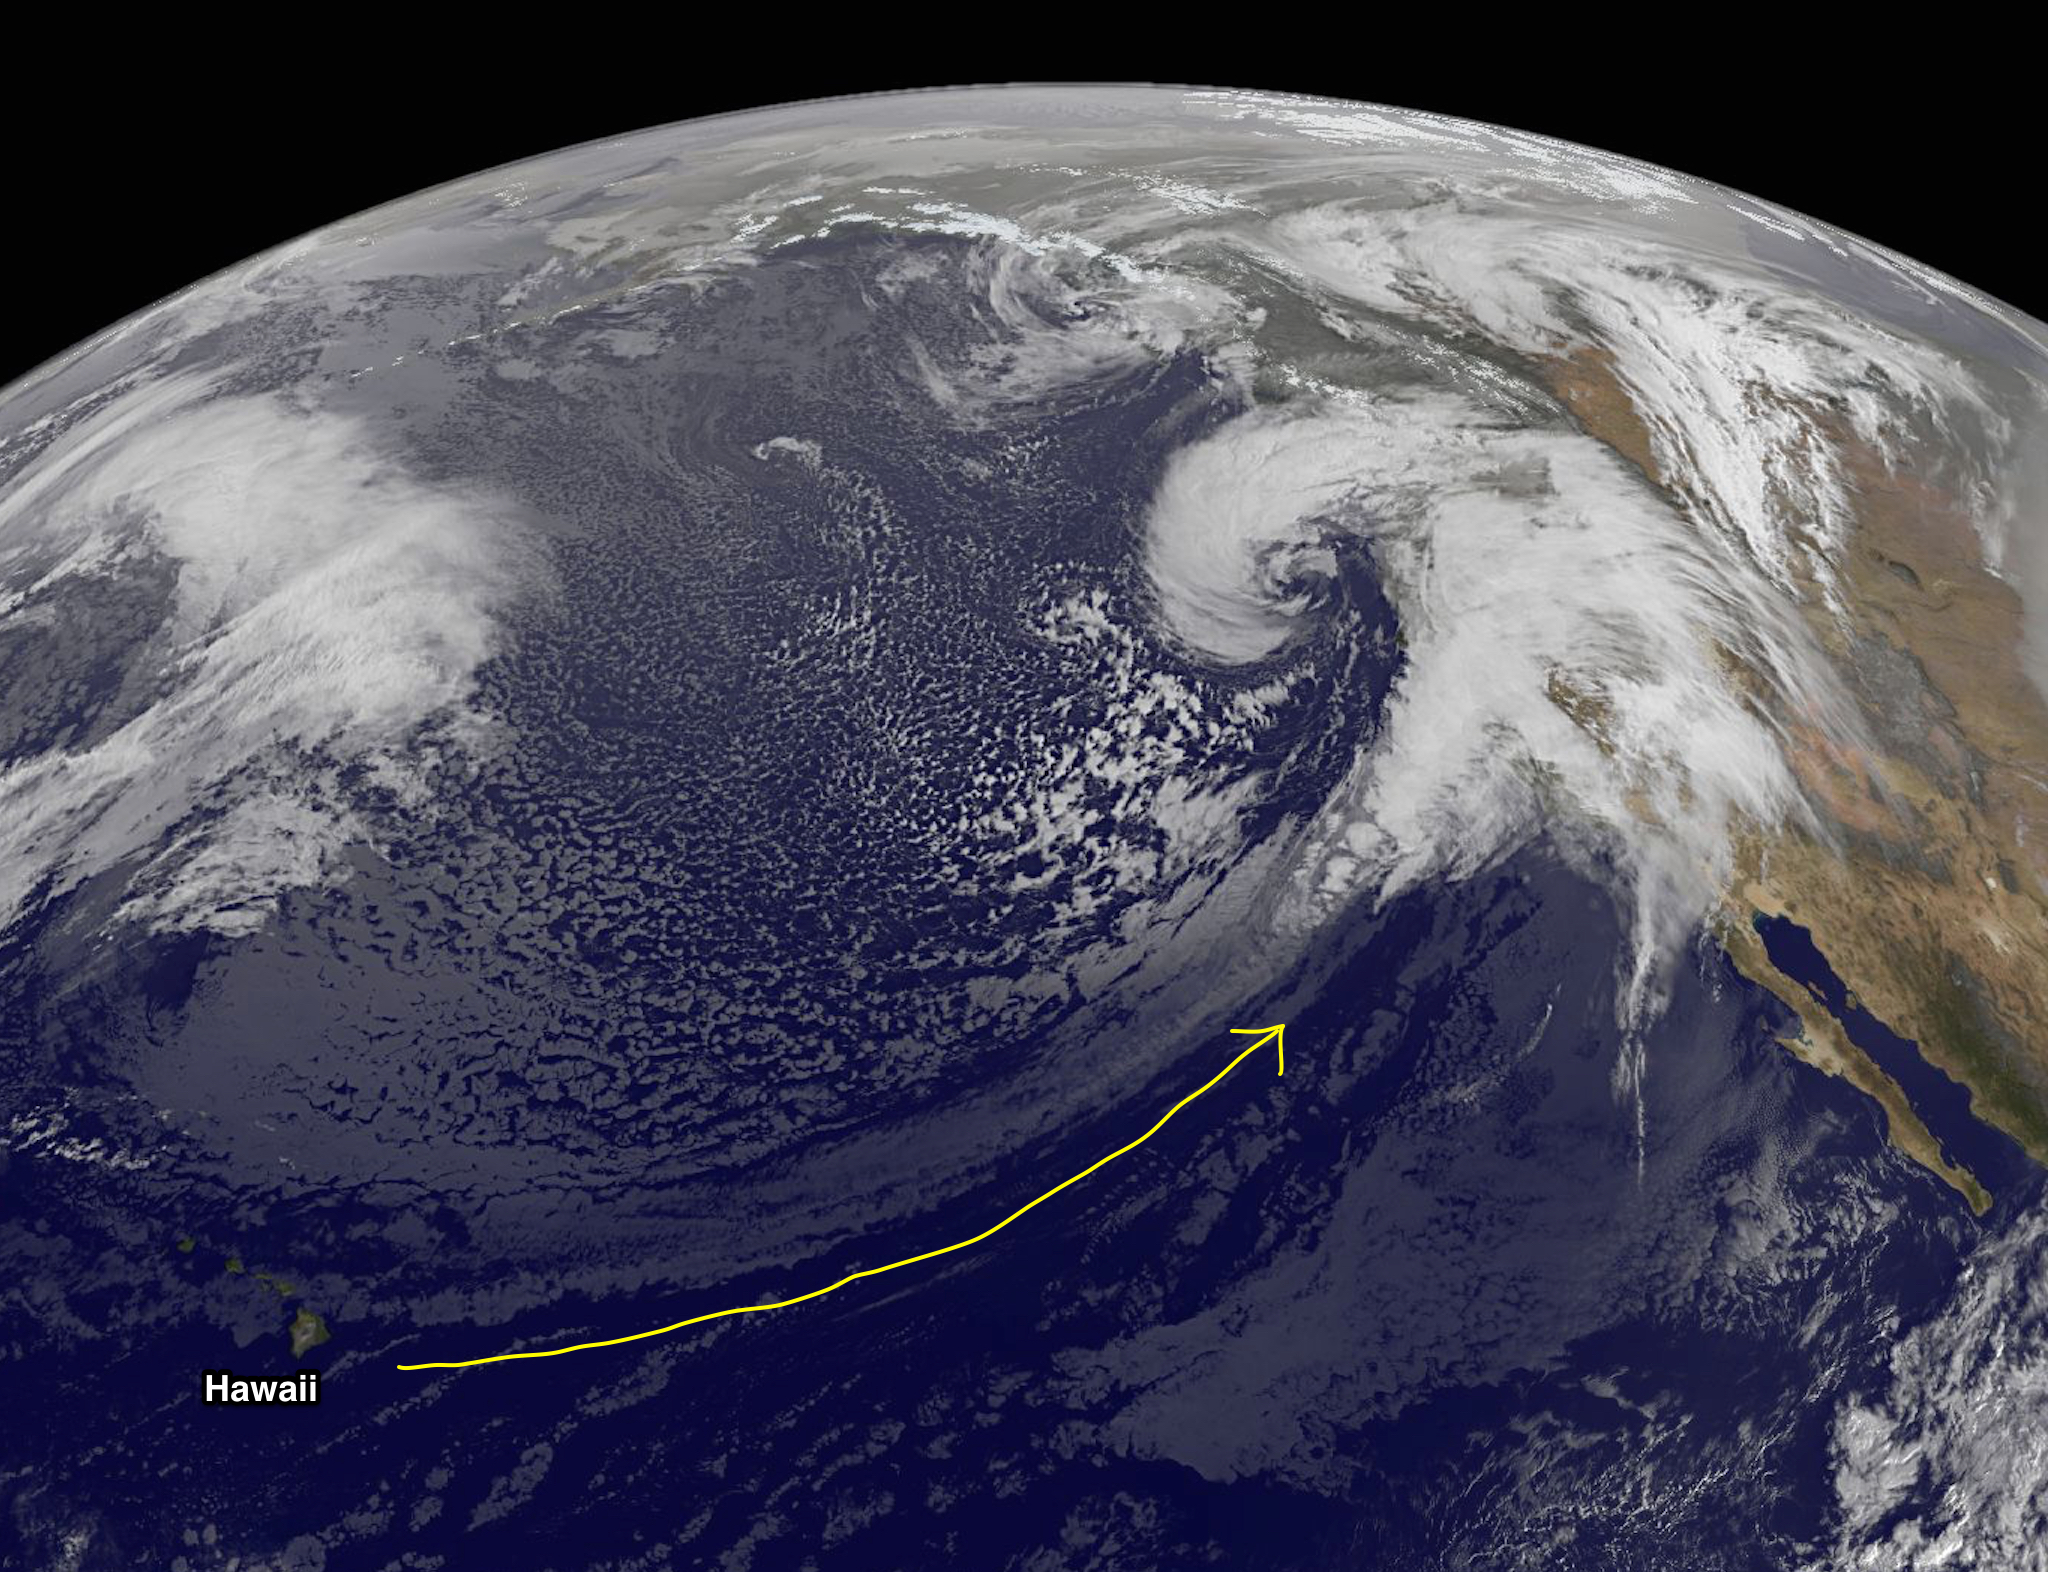
A “pineapple express” atmospheric river takes aim at California in December 2014. (NOAA/NASA GOES image)
February 14:
Minnesota Public Radio ran a fantastic feature on how climate change is affecting ice cover on Lake Superior between Bayfield and Madeling Island, Wisconsin. For 250 year-round residents of the island, winter offers an ice road and the freedom to move back and forth without being tied to the ferry schedule. Except that, for two years running, the ice hasn’t been thick enough to drive on and the ferry has run all winter. This story is personal for me, because my family has owned land on Madeline Island for 4 generations, and I remember the thrill and terror of driving the ice road on winter visits.

The view from our family’s land on Madeline Island, February 3rd, 2017. Photo courtesy of J. Jarvis.
February 15:
The New York Times highlights a rare Republican call to climate action, in which the “elder statesmen” of the Climate Leadership Council calls for a carbon tax. A report out earlier this month from the Yale Program on Climate Change Communication, shows that 62% of Trump voters support either taxation or regulation of greenhouse gases. The question is: Will Republican politicians listen to the elders or the voters, or will they continue to deny climate change and obstruct meaningful actions to slow its course.