
![]() Our changing climate is already affecting lives in a multitude of ways, and the impacts of climate change will only increase as the world continues to heat up. But because climate operates in the background, it’s easy to ignore the magnitude of the changes happening around us, as we are caught up in a daily news cycle and the rhythms of our own lives. 2017 seems fated to be an eventful – and exhausting – year and it would be all too easy to put climate change on the back burner, while facing seemingly more urgent crises. But, the longer we avoid tackling climate change head on, the more dramatic the impacts we are going to be facing.
Our changing climate is already affecting lives in a multitude of ways, and the impacts of climate change will only increase as the world continues to heat up. But because climate operates in the background, it’s easy to ignore the magnitude of the changes happening around us, as we are caught up in a daily news cycle and the rhythms of our own lives. 2017 seems fated to be an eventful – and exhausting – year and it would be all too easy to put climate change on the back burner, while facing seemingly more urgent crises. But, the longer we avoid tackling climate change head on, the more dramatic the impacts we are going to be facing.
I quietly launched a new personal project in January, and now that I’m a month in, I’m ready to tell you about it. I’m tweeting one climate change story per day for each day in 2017, with the tag #365climateimpacts. I’m aiming to tweet timely news stories or compelling visualizations across a wide range of climate change impacted arenas, from oceans to ice, from food to energy, from policy to theology, and more. While I’ve tagged the tweets with the word impacts, I’ll cover climate science and climate solutions as well as the impacts of past, present, and future climate change.
My goals for this project are three-fold:
- For those of us who are climate concerned, my goal is to keep climate change on the front burner of our collective agenda with daily reminders of the pervasiveness and magnitude of climate change implications and the hope that individual choice and policy and technological solutions have to offer.
- For those who are climate cautious or disengaged, I hope that the in the diversity of topics I tweet at least one will make it across your timeline and resonate with you and the things you care about. We know that just piling on facts doesn’t change people’s minds, but finding a genuine connection is a first step towards a real dialogue. As much as a one-to-many, 140-character limited platform lets me do, I hope I connect with you at some point this year.
- For those who are engaging with the climate doubtful and dismissive, I hope to equip with you new resources for those important conversations, give you ideas for how to avoid the deficit model of science communication, and encourage you in the work you are doing.
Without further ado, here’s an archive of January’s #365climateimpacts stories:
January 1:
I started the year with this entrancing visualization of 2016 in atmospheric precipitable water by James Warner:
The atmosphere in 2016; visualised using precipitable water. Featuring hurricanes, monsoons, tropical convection and much more. pic.twitter.com/sO8MiGJ8s6
— James Warner (@MetmanJames) January 1, 2017
January 2:
2016 in review for climate: there was some good news, but also a lot of bad news https://t.co/9cfqVAxzQy
— Dr. Anne Jefferson (@highlyanne) January 3, 2017
January 3:
Minimizing climate change requires collective action. This article gives you 5 places to start: https://t.co/OVZ79JB6sV via @Tessa_M_Hill
— Dr. Anne Jefferson (@highlyanne) January 3, 2017
January 4:
I tweeted this piece by Andrew Thaler multiple times in January – and I’m likely to keep tweeting it, because it’s just so perfect. “When I talk about climate change, I don’t talk about science.”
The term “Climate Change” is now loaded with so much political baggage that it becomes almost impossible to hold a discussion across political lines. In stakeholder interviews, people generally understand and acknowledge the impacts of climate change on local and regional scales, as long as you don’t call it “Climate Change”. This has been my experience working in rural coastal communities, which tend to be strongly conservative and intimately connected to the changing ocean.
Which is why, when I talk about Climate Change, I don’t talk about science.
When I talk about Climate Change, I talk about Fishing.
January 5:
A warmer atmosphere can hold more water, so it’s not too surprising that the hottest year on record also had the most precipitable water in the atmosphere. Still it’s nice to see the physics theory borne out in the data.
Annual precipitable water in 2016 at the global scale was at record levels according to R1 Reanalysis (1948-present). pic.twitter.com/WRWNyYo1lT
— Brian Brettschneider (@Climatologist49) January 3, 2017
January 6:
You are reading one of my #ClimateResolutions right now.
Inspiring set of #ClimateResolutions from people engaged in climate science & communication https://t.co/ltBQXKYLMj What are you doing?
— Dr. Anne Jefferson (@highlyanne) January 7, 2017
January 7:
The crack in this Antarctic ice shelf just grew by 11 miles. A dramatic break could be imminent.
January 8:
Scientists confirmed (again) that global warming never slowed down. (It looks like Yale’s E360 redesign has killed this story, but here’s a webcached version that works as of 22 January.)
January 9:
Hope Jahren Sure Can Write. What I say when people tell me they feel hopeless about climate change.
Scientists like me study carbon emissions, deforestation, ocean acidification, desertification, sea-level rise, glacial melting, landscape degradation, groundwater salination, invasive species, global warming and more. There is very little good news to share. Today’s environmental problems are easily big enough to eclipse our inadequate solutions. When people tell me that climate change makes them feel hopeless, I breathe deep, and then I respond. I don’t answer them because I have a good response, but because we all deserve at least a bad response. Here is what I say.
January 10:
The way I personally counter the despair that reading the latest climate change news can bring is by thinking about all of the technologies and solutions we already have in hand, and how the economics are steadily working ever more in their favor. President Obama makes a strong case for “The irreversible momentum of clean energy” in a policy forum article in Science magazine. I have a feeling Obama (2017) is going to be a highly cited paper over the next few years.
The mounting economic and scientific evidence leave me confident that trends toward a clean-energy economy that have emerged during my presidency will continue and that the economic opportunity for our country to harness that trend will only grow.
January 15:
Days before handing over power to a Republican administration, the EPA managed to complete a mid-term review of greenhouse gas emissions standards for cars – more than a year ahead of schedule. Wired has the story:
By 2025, cars would have to nearly double their average fuel efficiency (a kind of measure of emissions) and deliver, on average, more than 50 miles per gallon (which, for arcane reasons, equates to a real world figure of 36 mpg). The auto industry caved and agreed, with the caveat that by April 2018, the EPA and National Highway Traffic Safety Administration do a thorough review of the rules, and adjust them if they proved unduly expensive or just plain unworkable.
By completing the review early – and finding the standards appropriate – the EPA just made it harder for the next administration to take a step backwards on car emissions.
January 16:
There is, right now (as of Jan 12th), the least area of sea ice on our planet that we've ever measured—probably the lowest in millennia. pic.twitter.com/6LrUKxBEOF
— Eric Holthaus (@EricHolthaus) January 14, 2017
There’s some debate over whether we should really be lumping the Arctic and Antarctic onto the same plot, but there’s no denying that this is a pretty stunning departure from recorded history of sea ice.
January 18:
We knew it was coming, but January 18th is when NOAA and NASA confirmed that 2016 was the hottest year on record, beating out its immediate predecessor.
2016 was hottest year on record-again. They aren't anomalies. We can explain them w physics. Climate change is real. https://t.co/QXSmq06YkY
— Dr. Anne Jefferson (@highlyanne) January 19, 2017
January 20:
In honor of Penguin Awareness Day (surely, everyone is aware of them already, right?), I posted a link to this scientific article on how changes in sea ice extent during warm and cold periods over the last 50 years affect Emperor penguin survival and chick hatching. From the abstract:
We show that over the past 50 years, the population of emperor penguins (Aptenodytes forsteri) in Terre Adélie has declined by 50% because of a decrease in adult survival during the late 1970s. At this time there was a prolonged abnormally warm period with reduced sea-ice extent. Mortality rates increased when warm sea-surface temperatures occurred in the foraging area and when annual sea-ice extent was reduced, and were higher for males than for females. In contrast with survival, emperor penguins hatched fewer eggs when winter sea-ice was extended. These results indicate strong and contrasting effects of large-scale oceanographic processes and sea-ice extent on the demography of emperor penguins, and their potential high susceptibility to climate change.
January 21:
A stunning visualization of the trends in global temperature over the last 150 years in this temperature spiral, posted by Climate Central.
Global temperature spiral, updated to include 2016 data. Created by Ed Hawkins.
January 22:
An informative and nicely illustrated blogpost on climate.gov explaining the role of a strong El Niño in driving the record global temperatures we’ve experienced for the last three years. The takeaway is that while the El Niño has faded, climate change is still going strong and while we might expect a break from the record heat while we’re in La Niña mode, the next El Nino is likely to be even hotter. (If the climate.gov article disappears from the web, here’s a pdf archived version.)
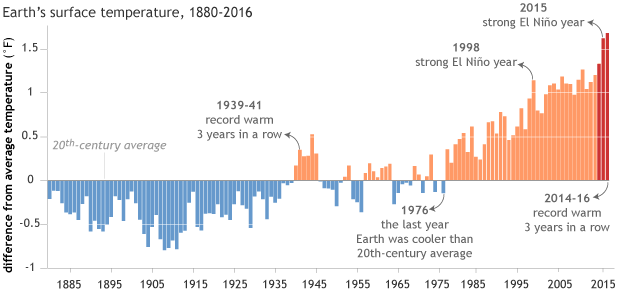
NOAA graph of global temperature anomalies from 1880-2016, with key years noted.
January 23:
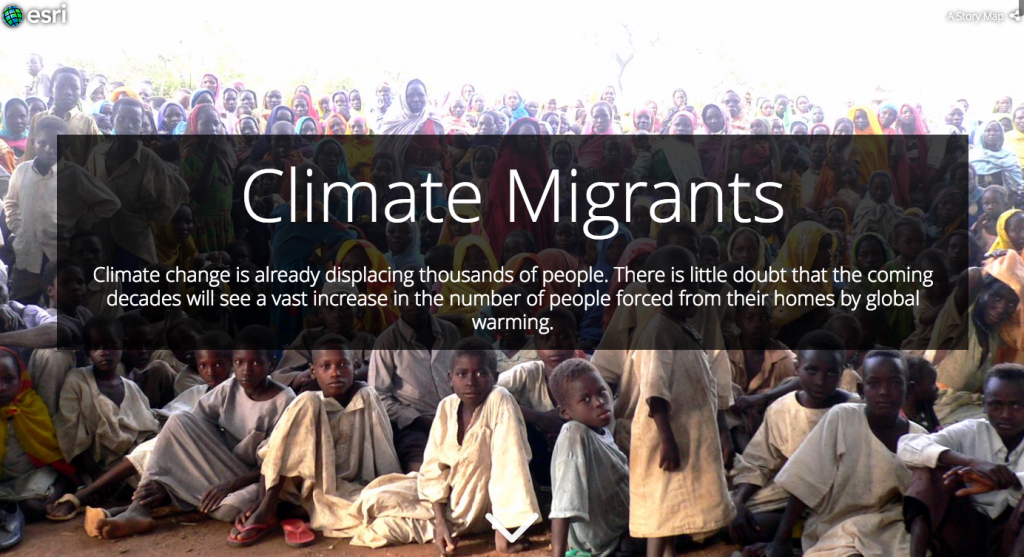
This is a stunning visual story of the places from which the first climate refugees are coming. 1000s of people are already being displaced by rising sea levels, increased flooding, and water scarcity, and millions more people are likely to be on the move in the coming decades. (Thanks to ESRI for creating this and to Dawn Wright for sharing it.)
January 24:
Flood disasters have more than doubled in Europe, which is in line with what we’d expect given climate change, according to a new report by insurer Munich Re.
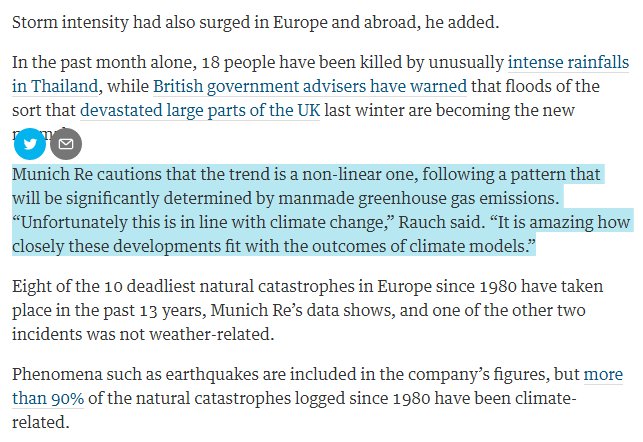
Excerpt from the Guardian article. Click to read the whole article at the Guardian.
January 25:
US solar power employs more people than power generation from oil, gas, and coal combined. (Though not for all uses of these fossil fuels as the headline misleadingly implies.) Renewable energies are the future.
January 26:
Climate change is already affecting Ohio. Find out how climate change affects your state, on this fantastic climate impacts site (produced by the Federal Government): https://statesummaries.ncics.org/ (Note: If this site disappears, I have copies of the info for the states where I’ve lived: OH, NC, OR, MN).
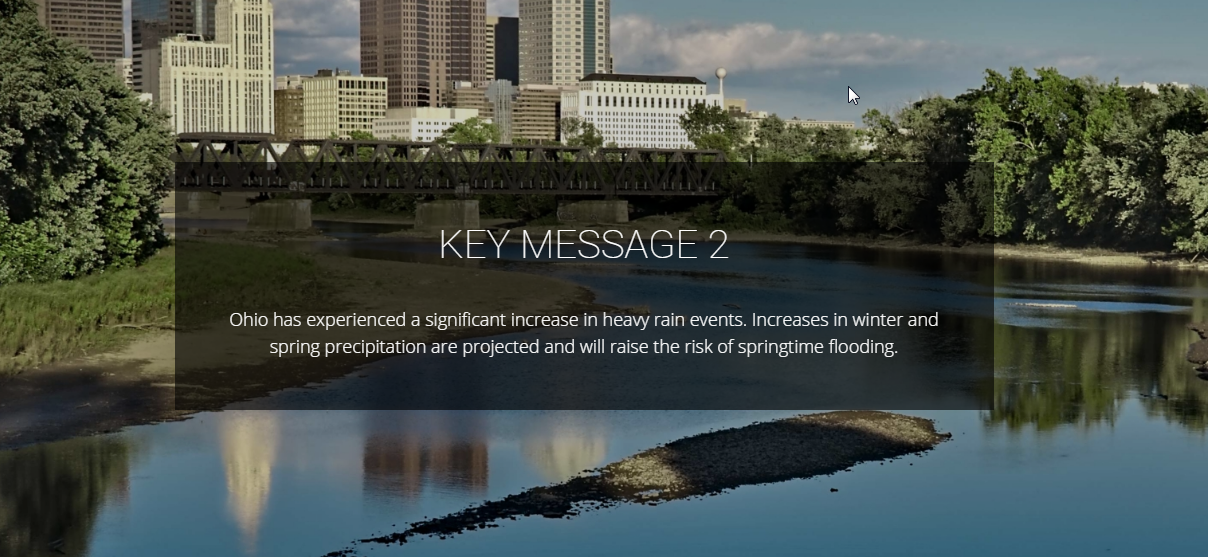
One of three key messages on climate change impacts being experienced by Ohio. The others focus on increasing temperature (and risks for urban areas) and increasing drought risks. What are the key messages for your state?
January 27:
Unsure how things like volcanic eruptions and air pollution play into the climate change we are experiencing? This data visualization from Bloomberg does a nice job showing how we can’t explain historical temperature trends without CO2 emissions, and what roles other factors have been playing in the temperature record.
January 28:
Peatlands are natural storehouse of carbon from the atmosphere — unless they are destroyed. Then, all the carbon goes back up into the atmosphere. Scientists have recently mapped a huge peatland in the Congo basin. It’s estimated to store the equivalent of 20 years worth of fossil fuel emissions from the United States, over an area the size of New York state. Let’s work to make sure it stays protected and the carbon stays in the ground.
January 29:
Are you watching Katherine Hayhoe’s Global Weirding series of videos yet? You should. One thing I love about Dr. Hayhoe is how clearly she explains why a “just the facts” approach won’t work to convince people skeptical of climate change’s reality. That’s the focus of the latest episode of her series.
January 30:
Following on the news that Europe’s flood disasters have doubled in the past few decades, here’s a new study showing that if global temperatures rise by 4°C, the flood risk in countries representing more than 70% of the global population will increase by more than 500%. (Thanks to Richard Betts for bringing this to my attention.)
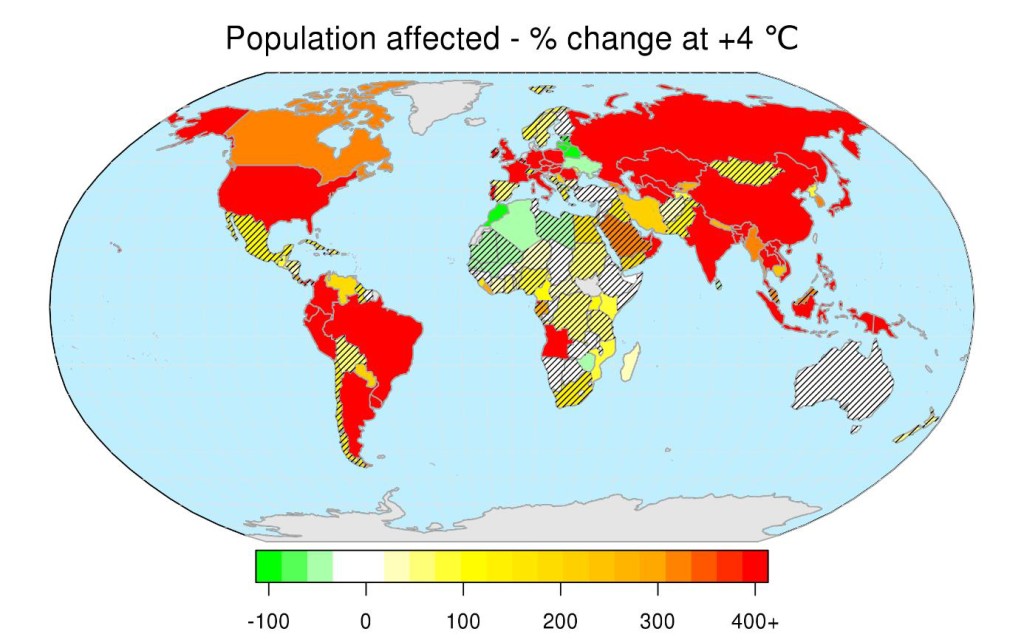
Average change in population affected per country given 4?C global warming. Hatching indicates countries where the confidence level of the average change is less than 90%.
Figure copyright EU, used in spirit of fair use.
January 31:
In a month filled with signs that the new US administration will roll back federal comittments to combatting climate change, California is a beacon of light. The state of California, one of the world’s largest economies in it’s own right, is continuing forward with its efforts to decrease its greenhouse gas emissions. As California knows, once the groundwork for a low carbon future is laid, the economics of going backward don’t make sense.
“There’s a whole ecosystem built to reduce emissions,” said Jon Costantino, an environmental policy advisor who previously worked at the California Air Resources Board. “There’s investors, there’s businesses, there’s consultants.”
He added, “To pull the rug out from under that would have a dramatic impact.”
Links (3)-
-
-
Pingback: #365climateimpacts: Snow, ice, flooding, and football (February 1-15) | Highly Allochthonous
Pingback: #365climateimpacts: Snow, ice, flooding, and football (February 1-15)
Pingback: #365climateimpacts: A crazy February heatwave and a tornado warning on March 1 (February 16-March 3) | Highly Allochthonous