When it rains a lot and the mountains fall down

A post by Anne Jefferson

2006 debris flow deposit in the Eliot Glacier drainage, north flank of Mount Hood, Oregon (Photo by Anne Jefferson)

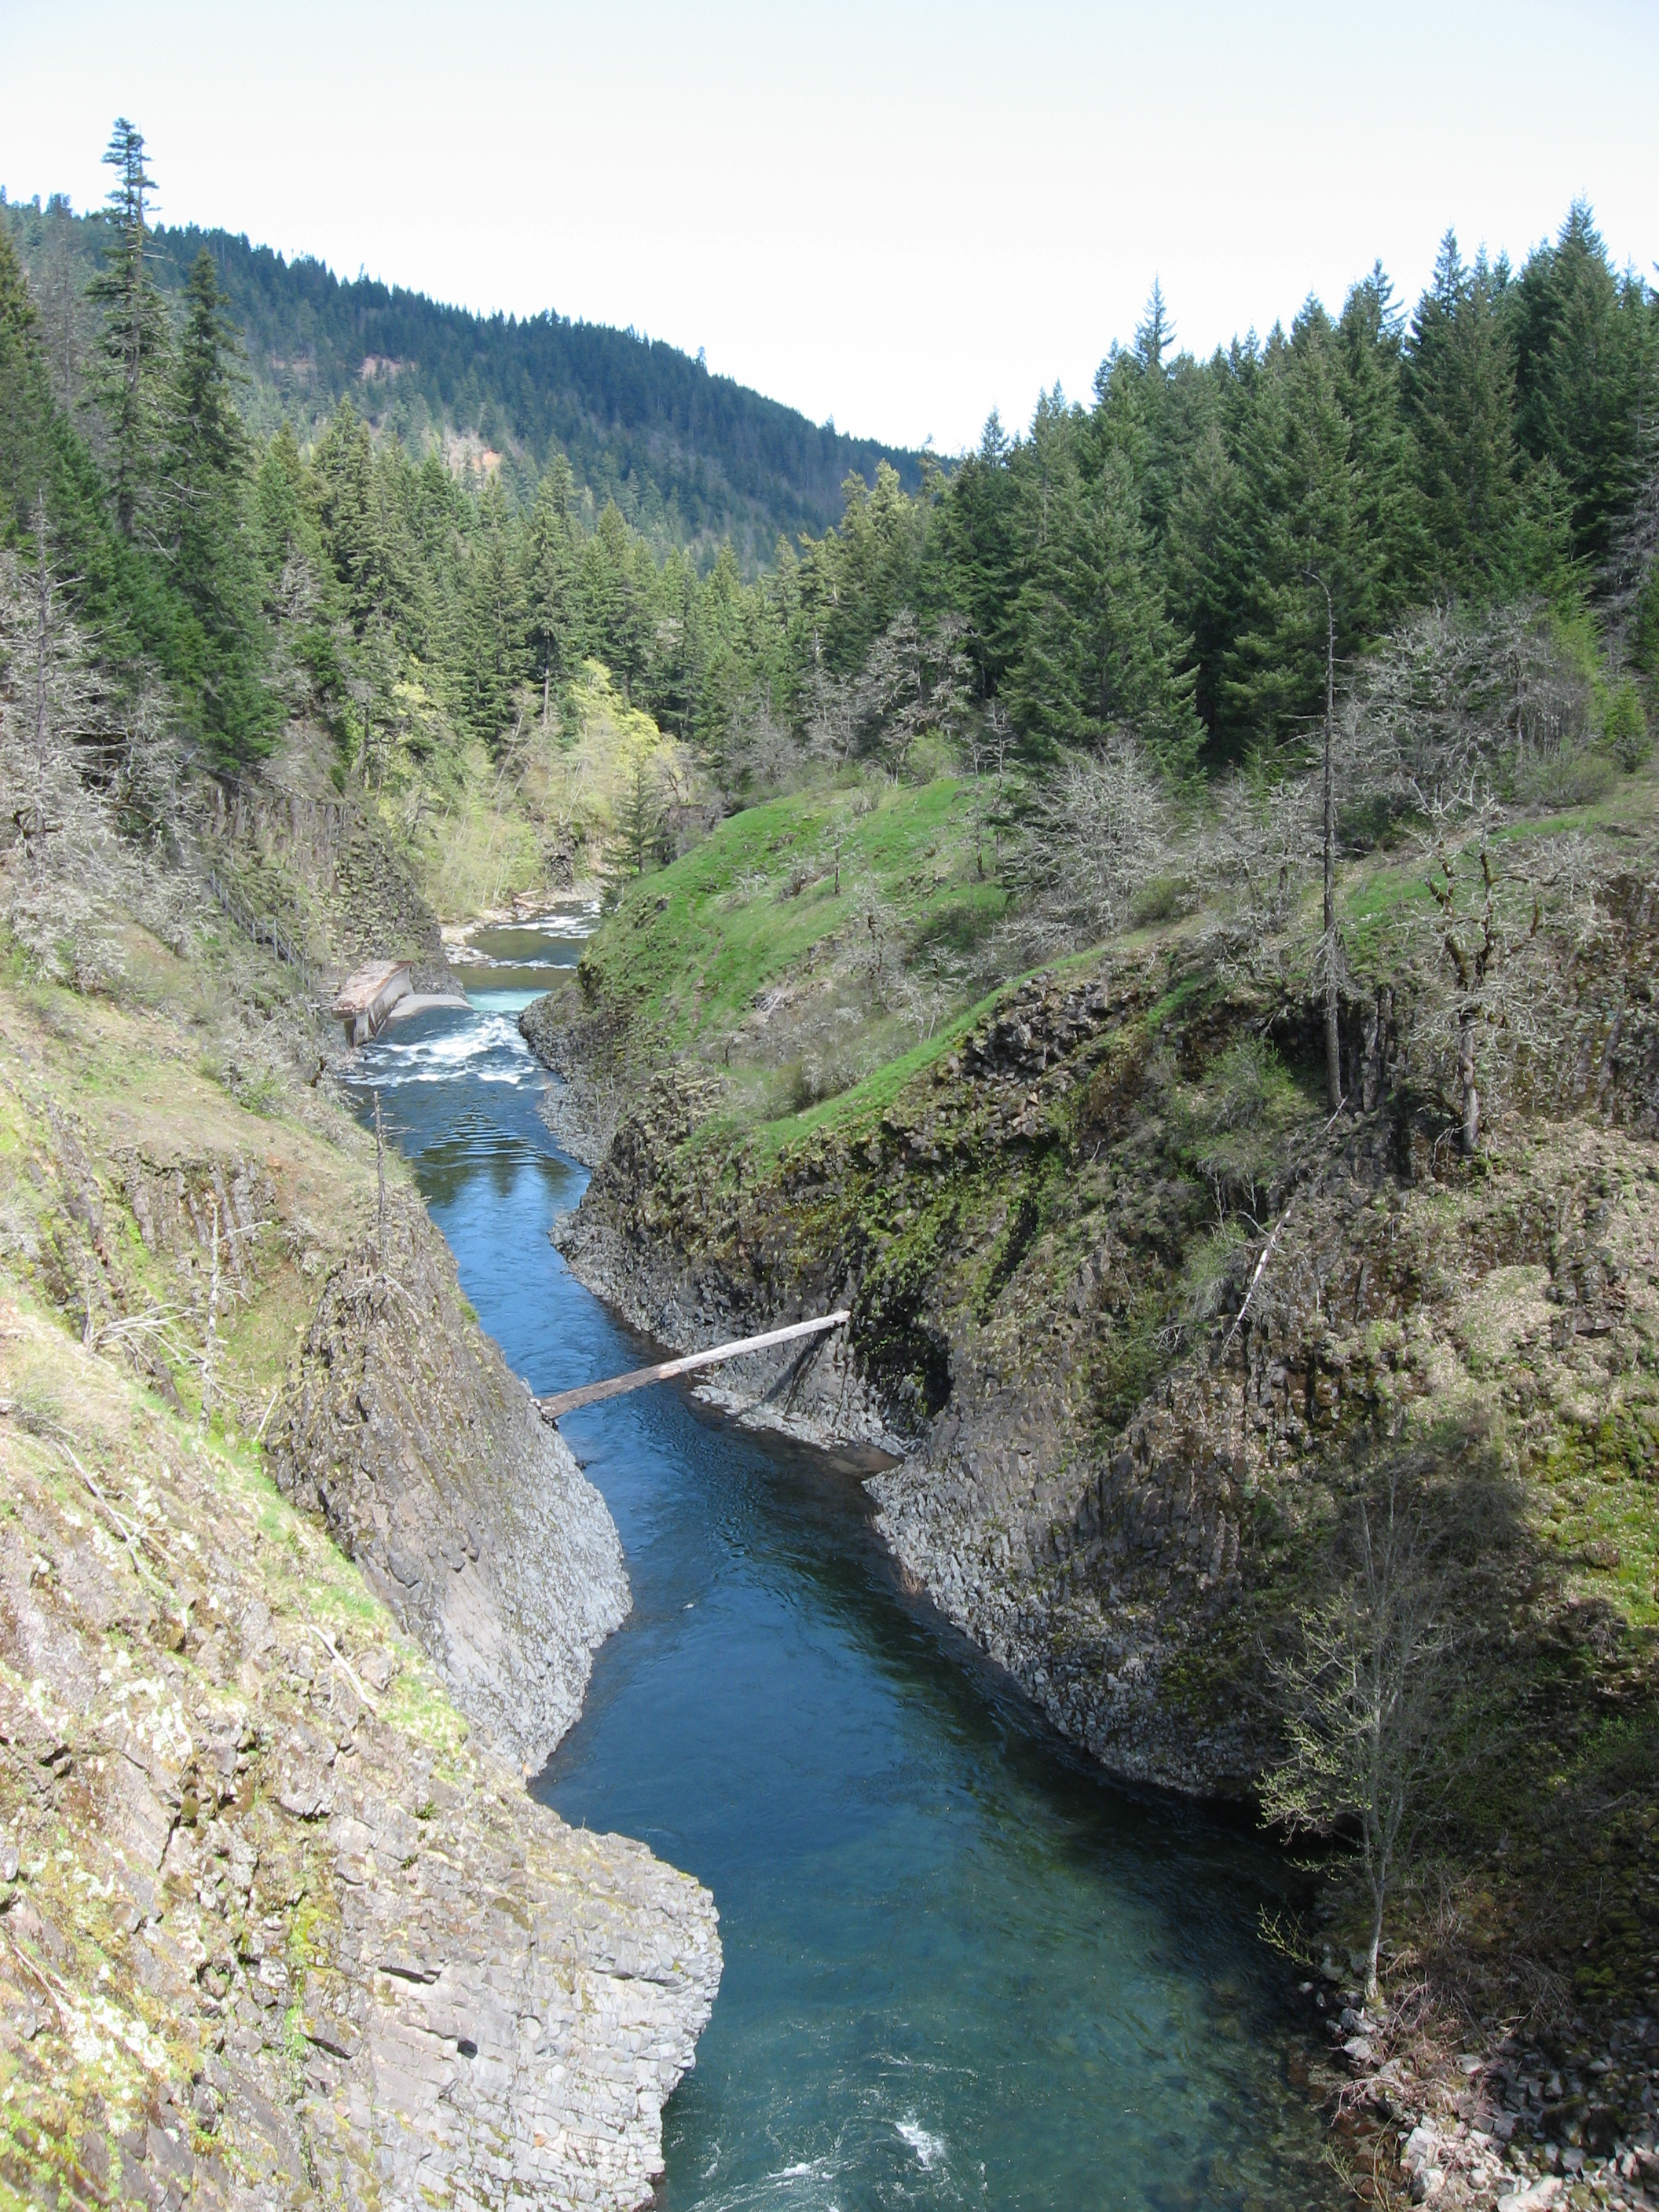
The geo-image bonanza of this month’s Accretionary Wedge gives me a good reason to make good on a promise I made a few months ago. I promised to write about what can happen on the flanks of Pacific Northwest volcanoes when a warm, heavy rainfall hits glacial ice at the end of a long melt season. The image above shows the result…warm heavy rainfall + glaciers + steep mountain flanks + exposed unconsolidated sediments are a recipe for debris flows in the Cascades. Let me tell you the story of this one.
It was the first week of November 2006, and a “pineapple express” (warm, wet air from the tropical Pacific) had moved into the Pacific Northwest. This warm front increased temperatures and brought rain to the Cascades…a lot of rain. In the vicinity of Mt. Hood, there was more than 34 cm in 6 days, and that’s at elevations where we have rain gages. Higher on the mountain, there may even have been more rain…and because it was warm, it was *all* rain. Normally, at this time of year, the high mountain areas would only get snow.
While it was raining, my collaborators and I were sitting in our cozy, dry offices in Corvallis, planning a really cool project to look at the impact of climate change on glacial meltwater contributions to the agriculturally-important Hood River valley. Outside, nature was opting to make our on-next field season a bit more tricky. We planned to install stream gages at the toe of the Eliot and Coe glaciers on the north flank of Mt. Hood, as well as farther downstream where water is diverted for irrigation. But instead of nice, neat, stable stream channels, when we went out to scout field sites the following spring, we were greeted by scenes like the one above.
Because sometime on 6 or 7 November, the mountain flank below Eliot Glacier gave way…triggering a massive debris flow that roared down Eliot Creek, bulking up with sediment along the way and completely obliterating any signs of the pre-existing stream channel. By the time the flow reached the area where the irrigation diversion occur, it had traveled 7 km in length and 1000 m in elevation, and it had finally reached the point where the valley opens up and the slope decreases. So the sediment began to drop out. And debris flows can carry some big stuff, like the picture below… and like the bridge that was washed out, carried downstream 100 m and turned sideways. In this area, the deposit is at least 300 m wide and at least a few meters deep (as you can see where Eliot Creek has incised through it, in the second photo below).

2006 Eliot Glacier debris flow deposit (photo by Anne Jefferson)2006 Eliot Glacier debris flow deposit
(photo by Anne Jefferson, scale human is ~175 cm.)
Eliot Creek, April 2007 (photo by Anne Jefferson)Eliot Creek, April 2007. This channel is in a completely different location than the pre-debris flow channel of Eliot Creek at this location.
(photo by Anne Jefferson)

With all the big debris settling out, farther downstream, the Hood River was content to just flood…and flood…and create a new delta where Hood River enters the Columbia River.


Youtube video from dankleinsmith of the Hood River flooding at the Farmers Irrigation Headgates

West Fork Hood River flood, November 2006 from http://elskablog.wordpress.com/2006/11West Fork Hood River flood, November 2006 from http://elskablog.wordpress.com/2006/11/. For the same view during normal flows, take a look at my picture from April 2007.
Hood River delta created in November 2006 (photo found at http://www.city-data.com/picfilesc/picc30876.php)

It wasn’t just Mt. Hood’s Eliot Glacier drainage that took a beating in this event. Of the 11 drainages on Mt. Hood, seven experienced debris flows, including a rather spectacular one at White River that closed the main access to a popular ski resort. And every major volcano from Mt. Jefferson to Mt. Rainier experienced debris flows, with repercussions ranging from downstream turbidity affecting the water supply for the city of Salem to the destruction of popular trails, roads, and campgrounds in Mt. Rainier National Park (pdf, but very cool photos).
In the end, our project on climate change and glacial meltwater was funded, we managed to collect some neat data in the Eliot and Coe watersheds in the summer of 2007, and the resulting paper is wending its way through review. The November 2006 debris flows triggered at least two MS thesis projects and some serious public attention to debris flow hazards in the Pacific Northwest. They also gave me some really cool pictures.

Categories: by Anne, fieldwork, geohazards, geomorphology, hydrology, photos

Top Kill: what BP is trying to do

A post by Chris RowanI’ve been finding media coverage of operation ‘Top Kill’ – BP’s latest attempt to seal the Deepwater Horizon well leak in the Gulf of Mexico – rather confusing, so I’ve attempted to think through what pumping mud into the well is trying to achieve, and what we should expect to see if it is succeeding. I freely admit I’m not an expert, so I welcome any corrections and clarifications from people who are in the comments.
Update 30th June: ‘Top Kill’ has been abandoned – it seems that they just couldn’t get mud into the well fast enough.
The oil in the formation that the Deepwater Horizon drilled into is under high pressure: the high confining pressure provided by more than 5km of overlying rock has allowed high hydrostatic pressures to build up. Now that there is a weak point (the well) this pressure is pushing the oil upwards to the sea bed and out into the ocean (left in the figure below). To stop this, BP is trying to inject dense, heavy drilling mud into the well. If they can pump enough mud into the well, its weight will exert a downward pressure that will cancel out the upward pressure pushing the oil up the borehole, and no more fluid will escape (right in the figure below). At this point, the well can be permanently sealed by concreting it over.

topkill1.png

Latest footage from the sea floor indicates we’re not at that point yet.

Drilling-mud-escaping-fro-006.jpg

It looks like the stuff currently emerging from the leaks is probably drilling mud, rather than oil and gas – or at least mud mixed in with the oil and gas. As the mud starts to be injected into the well, the oil pushes back against it, and there is not yet enough mud at the top of the borehole for its cumulative weight to counteract the upwards pressure. The mud is therefore being forced back out of the well again.

topkill2.png

So, if the operation continues according to plan, what should we expect to see? Assuming that mud can be pumped into the well at a faster rate than it is pushed back out again – and BP has enough drilling mud on hand to continue the operation – it will gradually push further and further down the well against the oil. More mud in the well means more weight for the oil to push against, which should reduce the amount of mud that can be pushed back out of the well. So the volume of leaking fluid should theoretically be decreasing as pumping continues. Lets hope so.

Categories: environment, geohazards, geology

The hydrogeology of Yellowstone: It’s all about the cold water

A post by Anne JeffersonResearchBlogging.orgThe Yellowstone caldera is home to thousands of geothermal springs and 75% of the world’s geysers, with kilometers-deep groundwater flow systems that tap magmatic heat sources. As that hot groundwater rises toward the surface, it interacts with shallower, cooler groundwater to produce multi-phase mixing, boiling, and a huge array of different hydrothermal features. While the deep, geothermal water is sexy and merits both the tourist and scientific attention given to it, there’s a largely untold story in the shallow groundwater, where huge volumes of cold water may advect more heat than the hydrothermal features.

Grand Prismatic Spring at Yellowstone National Park. Photo by Alaskan Dude on Flickr.
Grand Prismatic Spring. (Photo by Alaskan Dude on Flickr.)

Yellowstone is a rhyolitic caldera that has produced 6000 cubic kilometers of ash flow tuffs, rhyolites, and basalts that form a poorly-characterized, heterogeneous fractured rock aquifer, hosting both hot/deep and cold/shallow flow systems. The Yellowstone volcanics lie on top of the Rocky Mountain Cordillera, which itself is a complex hydrogeologic system, ranging from low permeability metamorphic rocks to high permeability limestones.
In a paper in the Journal of Hydrology, Gardner and colleagues (2010) use stream hydrographs and groundwater residence times to characterize the cold, shallow groundwater of the greater Yellowstone area. Stream hydrographs, or the time series of stream discharge, are useful indicators of groundwater dynamics, because in between rain or snowmelt events, streamwater is outflowing groundwater. The recession behavior of a hydrograph during periods between storms can be used to estimate aquifer volumes. In the Yellowstone region, the annual hydrograph is strongly dominated by the snowmelt peak, and Gardner et al. used the mean daily discharge record from 39 streams to characterize the recession behavior of streams on different lithologies. What they found was that streams flowing in watersheds dominated by volcanic rocks have much less variable hydrographs than those on other rock types. The figure below uses data from the USGS to illustrate these differences, which are in line with studies in the Oregon Cascades* and elsewhere which suggest that young volcanic rocks produce groundwater-fed streams with muted hydrographs.

yellowstone-hydrograph.jpg
Daily discharge for the Firehole River (USGS gage #06036905) and Soda Butte Creek (USGS gage #06187950) for the 2006-2007 water years, expressed on a unit area basis.

Using a nifty technique to separate the recessions into components attributable to snowmelt versus groundwater, Gardner et al. were able to calculate a ratio of the groundwater discharge to the total discharge of each stream and to calculate the hydraulic diffusivity, which is a ratio of permeability (how easily a fluid moves through a rock) compared to the amount of water stored in the system. If hydraulic diffusivity is low, the flow in the stream decreases slowly over time, like the Firestone River in the figure above. But hydraulic diffusivity can be low either because of low permeability or large aquifer storage volumes, so being able to tease apart those two components is key to understanding the hydrograph behavior. Gardner et al. did this by looking at the ratio of groundwater discharge to maximum discharge and using that as an index of aquifer storage. Based on these ratios, Gardner et al. separated the streams in the Yellowstone area into three groups (runoff-dominated, intermediate, and groundwater-dominated) with contrasting hydrogeologic properties.

Upper Cenozoic Geologic Map, Yellowstone Plateau
Geologic map of a portion of the Yellowstone Plateau, with approximate locations of stream gages of interest noted. Modified from Christiansen (2001, USGS Prof. Pap. 729-G).

Soda Butte and Teton Creeks are runoff dominated, with low groundwater storage and middling recession behavior. Since there is little groundwater storage, in order for hydraulic diffusivity to be low, then permeability must also be low. Sure enough, Teton Creek lies on top of Precambrian gneiss and granite, and unfractured metamorphic and intrusive igneous rocks like these have the lowest possible permeabilities. The Soda Butte Creek watershed comprises Eocene Absaroka volcanics, and older volcanic rocks like these can be quite weathered to clays and relatively impermeable.
The intermediate watersheds of Tower Creek and Cache Creek have significant ratios of groundwater discharge to maximum discharge, but their hydrographs recede rapidly over the summer. This means that they have high permeabilities relative to their aquifer storage volume. The Tower Creek watershed has Eocene tuffs and glacial valleys with alluvial fill, and Cache Creek watershed has Paleozoic carbonates. These materials are known for their high permeabilities, and the low storage volumes can be explained if those layers thinly overly less conductive materials.
The Firehole River, Gibbon River, and Snake River above Jackson Lake are groundwater-dominated, with very high permeabilities but even larger aquifer storage volumes. All of those streams drain primarily Quaternary Yellowstone volcanics, and this hydrologic behavior is in keeping with other young volcanic terrains.
Not content to stop with this hydrogeologic classification of the Yellowstone area, Gardner et al. collected water samples from small, cold springs to analyze CFC and tritium concentrations, which are useful tracers of groundwater travel times. For the springs they sampled, they found an average travel time (from recharge to discharge) of ~30 years. Using those CFC-derived groundwater transit times and some back-of-the-envelope estimates of aquifer geometry, Gardner et al. estimate that the Quaternary Yellowstone volcanics have a permeability of 10-11 to 10-13 m2, which is in line with estimates of young volcanics elsewhere. They also estimated that the aquifer depth represented by these small springs was ~70 m, but speculated that deeper flowpaths might have been discharging directly into the streams, out of reach of their CFC and tritium sampling abilities.
Finally, Gardner et al. note that the cold springs they studied are actually not as cold as they should be. In fact, they appear to be what are coming to be called “slightly thermal” springs. Groundwater recharge temperature is commonly assumed to be approximately mean annual temperature, and in the Norris Geyser Basin area, that’s around 4-5 &deg C. But the cold springs in the area are around 10 &deg C. Using this temperature difference and a handy equation from Manga and Kirchner (2004), Gardner et al. are able to calculate the heat flux advected by these cool springs. Their value of ~3800 W/m2 for the springs around Norris is about 10% of the heat flux from the Norris and Gibbon Geyser Basins themselves. That number becomes even more astonishing when you consider the relative scales of the cool versus the thermal groundwater systems. Geyser basins cover ~10 km2 of the Yellowstone Plateau, whereas cool groundwater drains under the entire ~1000 km2 plateau, and could be discharging far more heat than those showy thermal springs and geysers themselves.
So if you happen to go to Yellowstone this summer, in between gawking at Old Faithful, Artist Paint Pots, and Mammoth Hot Springs, take a few moments to appreciate the waters of the less dramatic cool rivers and streams. Their waters too are profoundly shaped by the geologic history of Yellowstone, and they are taking an awful lot of heat.
*Disclaimer: My PhD research focused on the hydrology and hydrogeology of volcanic aquifers and streams of the Oregon Cascades.
Payton Gardner, W., Susong, D., Kip Solomon, D., & Heasler, H. (2010). Snowmelt hydrograph interpretation: Revealing watershed scale hydrologic characteristics of the Yellowstone volcanic plateau Journal of Hydrology, 383 (3-4), 209-222 DOI: 10.1016/j.jhydrol.2009.12.037

Categories: by Anne, hydrology, paper reviews, volcanoes

Macro rock photography with the iPhone

A post by Chris RowanEarlier today Callan showcased a rather cool idea first dreamed up by fellow Scibling Alex Wild at Myrmecos: using a hand lens to shorten the focal length of the iPhone camera into the realms useful for macro photography. I had to try this out myself, so I grabbed the nearest interesting hand specimens* and got snapping. In the spirit of experimentation, I took pictures of the same field of view both with and without augmentation by the hand lens.
First up, a Neoproterozoic diamictite from Oman (part of the possible Snowball Earth sequences):

IMG_0223.jpg

IMG_0215.jpg
With hand lens

IMG_0216.jpg
Without hand lens

Nodular hematite in a late Archean rock from South Africa:

IMG_0224.jpg

IMG_0217.jpg
With hand lens

IMG_0218.jpg
Without hand lens

Another one from Oman: fibrous gypsum in a red siltstone unit.

IMG_0225.jpg

IMG_0219.jpg
With hand lens

IMG_0220.jpg
Without hand lens

I’m rather impressed; returning to my earlier thoughts on the iPhone as a potential field tool, a case with a bracket to clip on a magnifying lens would be pretty darned useful for quickly recording lithologies. If said case added extra battery (like this one does) and some weather proofing, and perhaps a capacitive finger replacement a bit more elegant than a sausage, and it could be extremely darned useful. In the meantime, perhaps further experimentation might produce images worthy of inclusion in the upcoming Accretionary Wedge geo-imagery bonanza. Is anyone else experimenting with this?
*What? You don’t have random cool rocks just lying around in your flat? Or a hand lens? Strange people.

Categories: fieldwork, gifts and gadgets

Accretionary Wedge Call For Posts: Geo-Image Bonanza!

A post by Anne JeffersonA post by Chris RowanWe’re pleased to announce that the next edition of the geoblogging carnival, The Accretionary Wedge, will be held here (for the first time ever!) at Highly Allochthonous at the end of the month. The theme that we’ve chosen is simple: we want to amass a gallery of all of your favorite geologically themed pictures.
It could be a photograph you’ve taken of an outcrop or process in action; a diagram from a classic geologic paper or text book; a satellite image of an incredible landscape; an optical microscope picture of your favorite mineral; something topical, or an old and inspirational favorite. Whatever strikes your fancy. You might consider writing a little about what your chosen images shows or why you chose it, but wordless entries are OK too. We’re also OK with recycled submissions if you’ve got a post in your archives that fits the carnival theme.
The deadline for submission of posts will be Friday, May 28. To submit your entry, leave a link to in the comments section here or at the Accretionary Wedge blog. We encourage our non-blogging readers to contribute their favorite images as well: we’ll be happy to publish your image here.
NASA's Blue Marble, 2002 edition

NASA’s Blue Marble, 2002


If a picture is worth a thousand words, we should be able to amass an entire visual novel by the month’s end. We look forward to seeing what you all choose!

Categories: bloggery