Friday(ish) Focal Mechanisms: Samoa’s hidden rupture

A post by Chris RowanResearchBlogging.orgIt seems that August is turning into ‘revisit past earthquakes’ month. Last week, Haiti; this week, the magnitude 8.1 earthquake that shook Samoa last September. Two Nature papers out this week unveil a slightly more complex story than we originally thought: a tale involving not just one, but two, or possibly even three, great earthquakes.

What remains undisputed is that a magnitude 8.1 earthquake ruptured the Pacific plate on the ‘trench slope’, just to the east of where it was being subducted beneath the Tonga microplate. It had an extensional focal mechanism, and was probably due to bending of the Pacific plate.
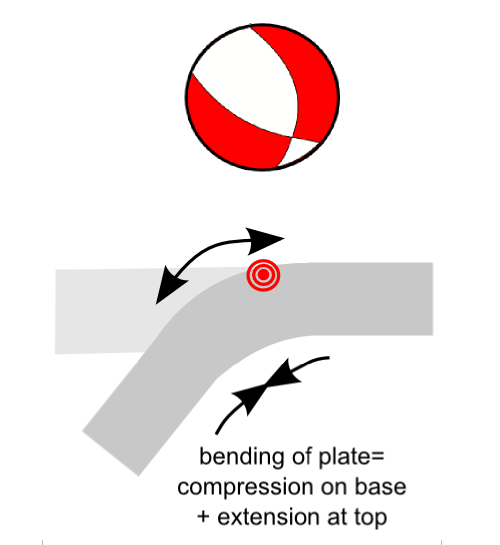
Initial interpretation of the Samoa earthquake of September 2009.

However, the aftermath of the earthquake provided several clues that this was not the whole story. Most of the aftershocks in the weeks that followed the main event were located not around the rupture point on the Pacific plate, but on the subduction megathrust, or even in the overiding Tongan plate – places where you would not expect the most significant stress changes to have occurred. The propogation of tsunami waves that caused great damage in Samoa and Northern Tonga, as charted by monitoring buoys, could not be modelled properly either – unless you assumed a thrust fault had generated the tsunami, rather than a normal fault as implied by the focal mechanism (shown in the figure above).

The initial focal mechanism for an earthquake is calculated primarily from the first motions – the behaviour of the first earthquake waves to arrive at seismometers around the world. However, if you want to properly model the size and shape of the fault plane that ruptured then you have to look at the whole train of seismic waves that arrived, from start to finish. When this was done, it was found that the full solution didn’t match up to the initial focal mechanism – in fact, there was no solution where a single, simple, rupture could produce the seismic signal from Samoa.

Solving this discrepancy requires an even closer look, which Lay et al have obliged us by taking. What they discovered was that the first minute or two of the arriving earthquake waves could be modelled by an extensional rupture on the trench slope, just as the initial focal mechanism suggested. After that, however, there was a significant divergence between what was expected from modelling such a rupture, and what was actually picked up by the global seismometer network. This suggested that the original earthquake had triggered another nearby, adding its own seismic voice to the cacophony. Further modelling demonstrated that you can generate a good fit to the observed seismograms if the subduction megathrust had ruptured at the same time. The best fit solution suggests it ruptured not once, but twice in quick succession, generating two magnitude 7.8 earthquakes. As a result of this almost instantaneous response, the seismic waves generated by the thrust events were mixed together with the seismic waves still being generated by the original earthquake, rather than showing up with their own right. But their signal can be extracted, and it explains the aftershock pattern – there are lots of aftershocks on the plate boundary because it actually ruptured as well.
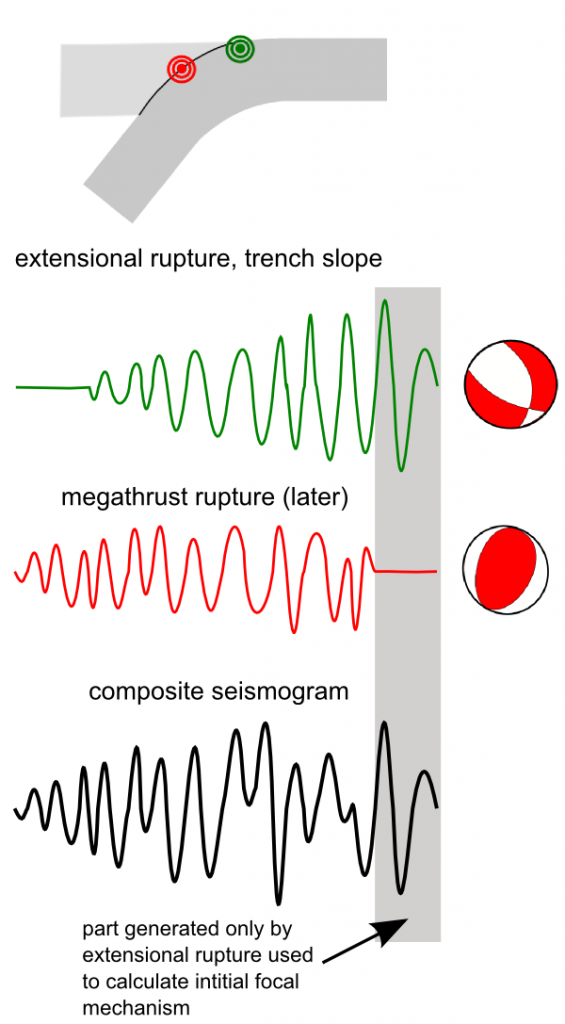
Interpretation of Lay et al.. The detected earthquake signal is a composite of an extensional rupture on the trench slope, and thrusting on the subduction boundary.

But wait – there’s a second Nature paper too, which comes to similar, but not identical, conclusions. Beavan et al. start from the same point – that there was something a bit weird about this earthquake, particularly in the tsunami propagation patterns – but took a different route of investigation, opting to use GPS measurements to determine the post-seismic deformation. They found that sites situated on the most northerly of the Tonga islands had moved 3.5 cm to the east since the last set of GPS measurements in December 2005 – a vast discrepancy with the 0.8 cm of southwest movement that should have resulted from the extensional earthquake on the Pacific plate. The amount and direction of motion was much more consistent with a large compressional earthquake – of around magnitude 8.0 – on the subduction megathrust. Since no such event has been detected since 2005, they also conclude that this thrusting must have occurred within a few minutes of the trench slope earthquake on September 29th, and was responsible for generating the tsunami. This explains why the tsunami looked like it had been generated by a megathrust earthquake – it had been.

So where do these two papers differ? Beavan et al. are proposing one megathrust earthquake, while Lay et. al are proposing two, but this is less important than it probably seems. the total seismic energy release is pretty much the same in both cases, and the separate ruptures modelled by Lay et. al pretty much run into each other, which would make them difficult to separate in other datasets. A more significant difference is the proposed order of events: Lay et. al propose the extensional, trench slope earthquake occurred before, and triggered, the megathrust rupture(s); Beavan et al. think that it is far more likely that the subduction zone ruptured first, and this triggered the trench slope earthquake. However, they suggest that the megathrust event was a ‘slow’ earthquake, where fault movement is a slow grind rather than an abrupt jerk. Because the seismic waves generated by such event also build up slowly in amplitude, the initiation of the thrust earthquake was not detected; and by the time the signal was detectable, the larger earthquake on the trench slope had already been triggered and was obscuring it.
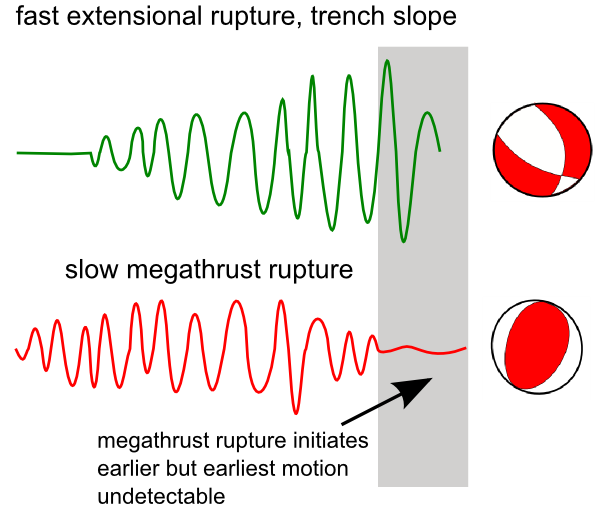
Interpretation of Beavan et al.. The thrusting occurs before the extensional rupture, but because it is a 'slow' earthquake it is not detected.

If I was forced to choose, I suspect that the seismic records used by Lay et al. should provide much better constraints on the sequence of events than the GPS and tsunami buoy records used by Beavan et al.. But if it was that clear-cut, I doubt both papers would have been published together like they have. Either way, these papers demonstrate just how sophisticated our analysis of earthquakes is becoming – and how much more sophisticated they might need to become before we fully understand the way the Earth deforms.

Lay, T., Ammon, C., Kanamori, H., Rivera, L., Koper, K., & Hutko, A. (2010). The 2009 SamoañTonga great earthquake triggered doublet Nature, 466 (7309), 964-968 DOI: 10.1038/nature09214

Beavan, J., Wang, X., Holden, C., Wilson, K., Power, W., Prasetya, G., Bevis, M., & Kautoke, R. (2010). Near-simultaneous great earthquakes at Tongan megathrust and outer rise in September 2009 Nature, 466 (7309), 959-963 DOI: 10.1038/nature09292

Categories: earthquakes, focal mechanisms

Snowball Earth no problem for sponges

A post by Chris RowanResearchBlogging.orgIn the debris surrounding 650 million year-old stromatolite reefs in South Australia, Adam Maloof and his group have discovered some rather unusual-looking fossils. They’re all about half a centimetre across, and are composed of red calcite (calcium carbonate), which indicates a biological origin. But they also have a range of apparently quite disparate shapes: as well as the wishbone and figure-of-8 (‘perforated slab’) morphologies shown in the image below, there were also rings and H’s (‘anvils’). In their Nature Geoscience paper, Maloof and his co-authors argue that all of these different forms are in fact cross-sections sliced at different angles through a single type of organism, with a complex three-dimensional shape. To demonstrate this, they took a polished section of the fossil bearing rock, scanned its surface, and traced the outline of any preserved fossil. They then ground off a fraction of a millimetre from the rock face, and scanned it again. Mimicking CT X-ray scans, all of the scanned outlines were then stacked together to reproduce the original shape of the fossilised organism.

Top: possible Australian sponge fossil: different shapes are due to the rock surface cutting through different planes of the original organism. Bottom: 3D reconstruction from sequential grinding and scanning, showing interior channel network.

Adam Maloof himself provides a nice, clear explanation of the ‘grind and scan’ method in this video, courtesy of New Scientist.

Adam Maloof describes how the 3D fossil sponge reconstructions were created

The most striking feature revealed by the 3D reconstructions is the network of internal channels that permeates these fossils, which is very reminiscent of the internal water canals of sponges. If this was the case, these would be, by a considerable temporal distance, the oldest animal fossils ever discovered. However, this classification is still tentative: although these fossils do seem to have a sponge-like organisation, they do not clearly possess features common to all other known sponges, living and fossil, such as their quasi-skeletal spicules. But while this claim should be approached with caution (for all I know, Chris Nedin is preparing a rebuttal as I type), if it is confirmed it is not an entirely unexpected discovery. To date, the confirmed physical fossil record of sponges, in the form of possible spicules found in Doushantuo Formation of southern China, stretches back only as far as the late Ediacaran, but molecular clock data suggests that some sponge groups diverged from a presumably spicule-bearing common ancestor at least 200 million years earlier than this, and that, perhaps due to some quirk of Neoproterozoic ocean chemistry, sponges existed during this period but their spicules were not preserved. And just last year sponge biomarkers – carbon compounds formed by the decomposition of organic molecules found only in sponges – were reported from 650-700 million year old rocks in Oman (which we discussed in the Podclast at the time).

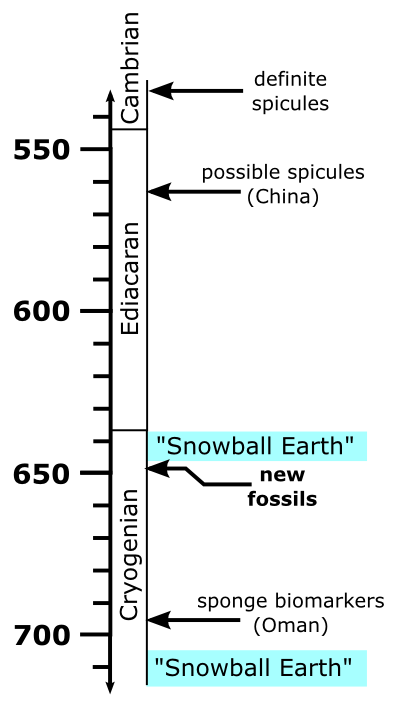
So the evidence from numerous sources seems to be converging to suggest that sponges – the first animals – emerged much earlier than the beginning of the Cambrian. In fact, as the timeline in the figure below illustrates, these new fossils from Australia, and the biomarker evidence from Oman, are both found at a rather interesting point in Earth history: the period between the two hypothesised ‘Snowball Earth’ events, when the entire Earth may have completely frozen over for 10-20 million years. And if the molecular clock evidence is accurate, sponges might even have originated before the first proposed Snowball event 700-750 million years ago.

How recent discoveries have pushed the sponge fossil record back almost 100 million years.

This could be considered a paradox: a group of organisms apparently sailing through severe climatic events – a prolonged global deep freeze, followed by an intense supergreenhouse, in the most extreme models of the Snowball Earth – without much trouble at all. This is not the first example, either. Perhaps the ancestors of modern life were tougher critters than we give them credit for – or perhaps the Cryogenian was not quite as hard on Neoproterozoic life as some geologists believe.

Maloof, A., Rose, C., Beach, R., Samuels, B., Calmet, C., Erwin, D., Poirier, G., Yao, N., & Simons, F. (2010). Possible animal-body fossils in pre-Marinoan limestones from South Australia Nature Geoscience DOI: 10.1038/ngeo934

Categories: fossils, geology, paper reviews, past worlds, Proterozoic

Stuff we linked to on Twitter last week

A post by Chris RowanA post by Anne Jefferson

Blogs in motion

Not so much blogs in motion as blogs in multiplication this week. The GSA has unveiled Speaking of Geoscience; and NASA’s Earth Observatory’s Elegant Figures has kicked off with a fascinating post on visualising the Eyjafjallajokull ash cloud. Also note that DinoJim’s blog is rebranding as The Geology PAGE (Presenting Alternatives in Geoscience Education), and Geobulletin.org is the shiny new home of the stratigraphy.net geoblog aggregator.

Earthquakes & Tectonics

Fossils

(Paleo)climate

Water

Environmental

General Geology

Interesting Miscellaney

Categories: links

Friday Focal Mechanisms: Haiti, revisited

One of the more interesting announcements to come out of the AGU Meeting of the Americas this week requires us to take another look at the magnitude 7 earthquake that devastated Haiti 8 months ago, because it appears the tectonic picture might be a little more complicated than we originally thought.

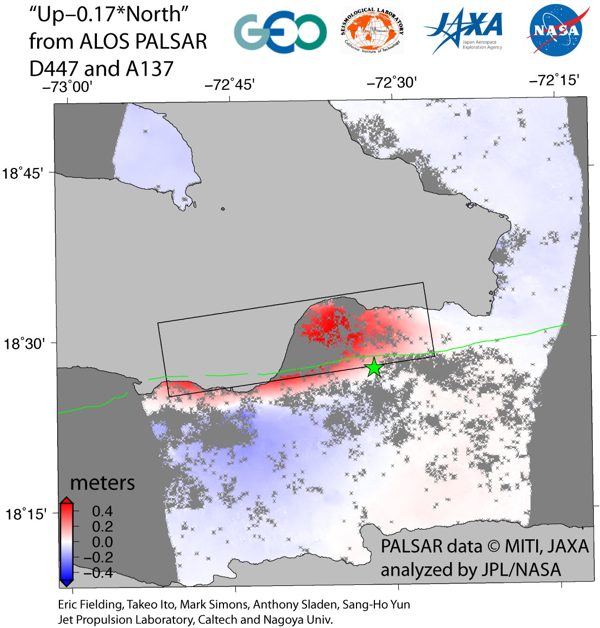
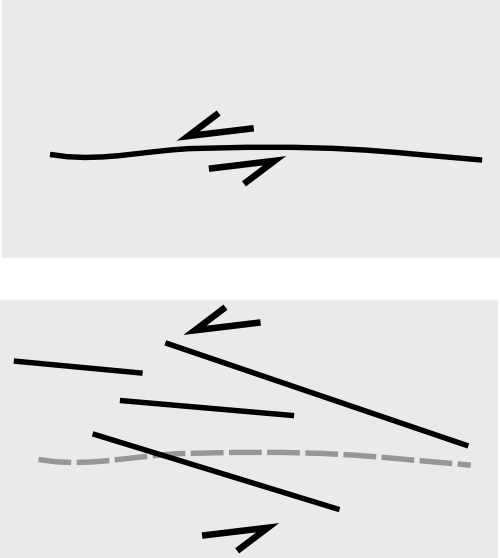
As I stated at the time, this focal mechanism shows mainly strike-slip deformation, which is exactly what you would predict from Haiti’s position right on top of a transform plate boundary. However, we are not seeming pure strike-slip here: the way that the nodal planes (the lines separating the red and white bits of the beachball) are tilted away from the vertical (they are curved, rather than straight) tells us that there is also some convergence being accommodated by this earthquake. In tectonic parlance, this is known as transpression, and means that while the crust is mostly sliding past each other as the fault ruptures, there is also some uplift of one side of the fault relative to the other. Such vertical motions can be quite easily measured using radar interferometry: the plot below, courtesy of Eric Fielding, shows the change in ground height, as measured by satellite radar altimetry, caused by the January 12 rupture.

Uplift (red) and subsidence (blue) due to the magnitude 7 12th January 2010 earthquake in Haiti (star=epicentre). The green line marks the location of the Eniquillo Fault. Image: Eric Fielding

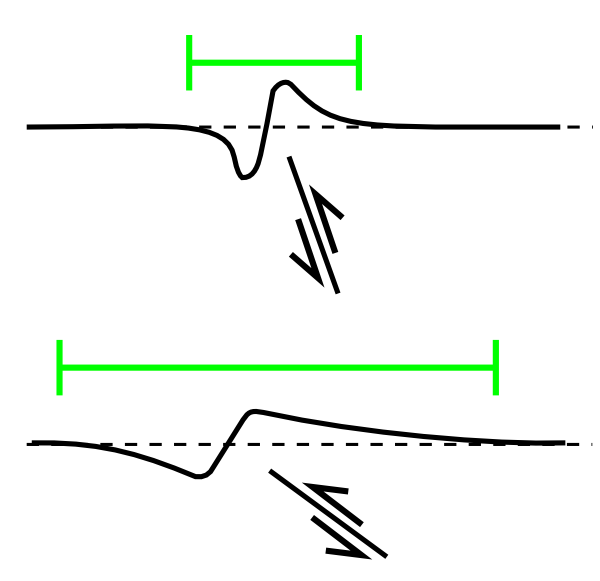
There are two important things to notice about this figure. First, there is a sharply defined pattern of uplift to the north, and subsidence to the south, with very little grading between them. This is just what you would expect from thrust deformation on a roughly E-W oriented fault; however, the transition from uplift to subsidence does not follow the trace of the Enriquillo Fault, which until now was thought to be the fault that ruptured during January’s earthquake. The figure shows that the earthquake caused uplift some distance south of the Enriquillo fault, as well as to the north of it, which suggests that displacement did not occur across it. The other thing to notice is that the region affected by uplift or subsidence extends some distance to the north and south of the epicentre. A broad area of uplift or deformation is caused by motion on a fault that has a relatively shallow dip; for deeply dipping faults, the uplift and subsidence is confined to a much narrower region close to where the fault breaks the surface. Rather damningly, it turns out that the Enriquillo Fault is quite steeply dipping.

Comparison of area affected by vertical displacement for a steeply dipping fault (top) and a more shallowly dipping fault (bottom)

In short, the deformation pattern caused by the January 12 earthquake is not consistent with it occurring on the Enriquillo Fault. If you try to model the type of fault that best reproduces the observed vertical deformation (the black rectangle in the second figure above), you get a rupture surface that dips to the north, and possibly cuts through the Enriquillo Fault at some point beneath the surface. As Eric Calais explains in a video up at the AGU Meetings blog, this new fault has provisionally been named the Leogane fault, after the town found in the middle of the uplifted region.

And it might be even more complicated still: the strike slip motion indicated in the focal mechanism above might have mainly occurred on another fault, also distinct from the Enriquillo Fault, in the same area, that ruptured at the same time. This complexity might partially explain why it was not immediately obvious that the Enriquillo Fault was not the prime mover in January’s earthquake; if the earthquake waves being received at distant seismic stations were produced by more than one rupture, the calculated focal mechanism would be a composite, mixing up the information from two separate events and thus describing neither accurately.

What these new observations appear to be telling us is that we are looking at another case of distributed deformation across a plate boundary. Rather than one or two big structures such as the Enriquillo Fault accommodating the motion between the North American and Caribbean plates, this motion is being absorbed by a whole group of faults, which may have even ‘taken over’ from the larger structures.

Rather than all the inter-plate motion being accommodated on one large structure such as the Enriquillo Fault (top), several faults, distributed over a much wider area (bottom), might be involved.

On a regional level, this has no particular significance; the same amount of strain will build across the plate boundary region as a result of plate motions; the same 40 km section of the plate boundary west of the epicentre released a large amount of its accumulated strain in January’s earthquake; the same 20 km section to the east has still not ruptured in more than 250 years, which is of significant concern due to its proximity to Port-au-Prince. However, because a number of faults seem to be involved in accommodating plate motions, the seismic hazard can no longer be localized to one big structure, making it much more difficult to work out which areas are relatively safe and which are not. Complex interactions between all the different faults as they rupture and cause local stress changes also make it difficult to estimate how much additional loading might have been placed on faults in the unruptured region to the east, making the likelihood of a rupture there in the not-to-distant future much harder to calculate. In other words, the sort of information that Haitians need as they start to rebuild their countries infrastructure – how much shaking they need to proof their buildings against when building in a particular location, and how frequently it will occur – is going to require a lot more detailed work than we thought it would.

(Thanks to Eric Fielding for providing a great deal of useful background on these new findings via e-mail.)

Categories: earthquakes, focal mechanisms, geohazards, structures, tectonics

Flooding in Pakistan

A post by Anne Jefferson For the past two weeks, unusually heavy monsoon rains have deluged Pakistan, resulting in flooding and landslides. Pakistan is heavily populated all along the Indus River valley, so this is a slow-moving disaster of epic proportions. The latest news reports estimate that flooding has displaced 14 million people – more than the number of people affected by the 2010 Haiti earthquake, 2005 Kashmir earthquake, and 2004 Indian Ocean tsunami combined.

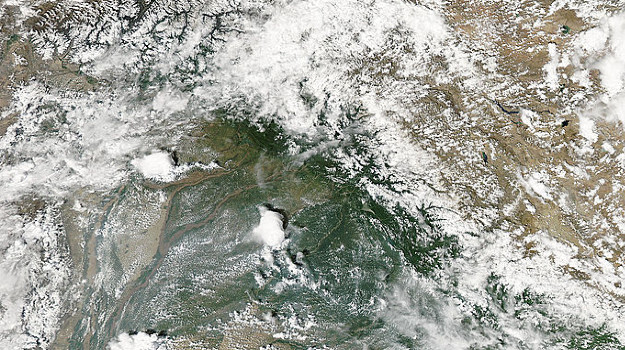
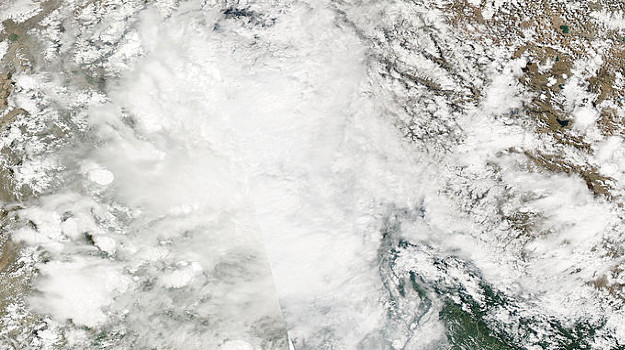
In the first 10 days of August, parts of Pakistan received almost 24 mm per day more rainfall than usual – during what is usually the wettest part of the year, when the monsoon rains fall.  During June-September, the relatively cool Indian Ocean has high atmospheric pressure system, while the intense summer sun heats up the Indian subcontinent and forms a low pressure system. Much like a river flows downhill, air in the atmosphere flows from high pressure to low pressure areas. So moisture rich air from the ocean flows toward India and Pakistan – bringing months of cloudy weather and intense rain. The images below are from true color images from NASA’s MODIS satellite showing the Indus and Chenab rivers in the area around Islamabad. The top image shows the clearest day from recent weeks (9 August), while the bottom image shows a more typical day (6 August).

NASA MODIS image on Northern Pakistan from 9 August 2010

NASA MODIS image on Northern Pakistan from 9 August 2010

NASA MODIS image of northern Pakistan from 6 August 2010

NASA MODIS image of northern Pakistan from 6 August 2010

This year, the monsoon precipitation has been especially intense in Pakistan, because the jet stream is experiencing a blocking event – when the normal eastward progression of weather patterns in the midlatitudes gets stalled out and you get the same weather for weeks on end. This created an additional low pressure zone over Pakistan’s northern mountains, bringing even more moisture to the headwaters of the Indus River. The rain also seems to be exacerbating the landslide and landslide dam problems in the region of the Hunza River, a tributary to the Indus in the northern mountains. (Update: Jeff Masters has a nice explanation of this jet stream blocking event and how it links the Russian heat wave and Pakistan floods.)

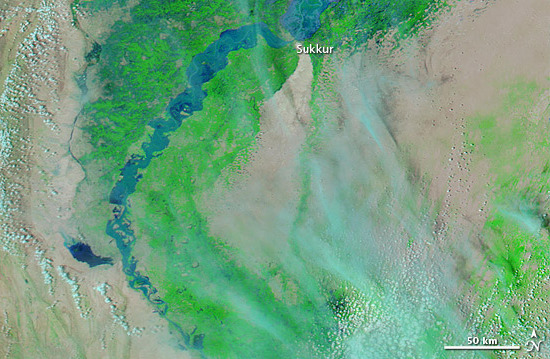
Flooding on the Indus is not an instantaneous disaster – it is one that will continue to occur for weeks, with consequences that last years. Because the flooding is being caused by prolonged intense precipitation, there can be multiple flood peaks – where the water level crests, starts to fall, and then rises again. There are already two flood peaks moving downstream, and if further rain falls, there may be three peaks to the flooding, and it could last through the end of August. Also, since much of the rain has fallen in the north, closer to the headwaters of the Indus, the flooding began in the north, and the flood waves are  transmitted downstream over a matter of days to weeks. While river levels are now slowly declining in the north, the first flood peak is just reaching Hyderabad – the largest city along the river, with a population of 1.5 million. How fast the flood moves downstream depends on the storage properties of the channel and floodplain. There is some possibility that if the first flood peak stalls out in an area with lots of floodplain storage or obstruction of flow by debris-choked bridges, the second flood peak could catch up, creating an even larger disaster.  NASA has a series of wonderful images showing the flood progressing downstream from Sukkur, north of Hyderabad, from 8 -12 August. The latest image is shown below.

Flooding on lower Indus River, 12 August 2010 (NASA MODIS image, combination of infrared and visible light)

Flooding on lower Indus River, 12 August 2010 (NASA MODIS image, combination of infrared and visible light)

Even when the final flood peak reaches the ocean and the Indus River returns to its banks all along its course, the human disaster will continue to unfold. 14 million people have been displaced by this flood – and those people may have lost everything they own. Beyond the personal losses, there has been devastation  to infrastructure such as roads and bridges, complicating relief efforts and even making access to some areas nearly impossible. The Indus is the source of water for irrigation canals throughout Pakistan and damage to them is likely to be intense, especially near the river, so agricultural productivity will suffer even in areas that escaped inundation. Village wells will have been contaminated by floodwaters, so access to safe drinking water will be an issue for months.

That’s a lot for any nation to handle – 1 in 12 residents directly affected by the flood – but for Pakistan’s already fragile national government it will be an especially difficult challenge. As the flooding has unfolded, Pakistan’s government has appeared less equipped to provide immediate relief to flood victims than Islamist charities, which will probably increase their support as they fill empty stomachs and provide shelter. There are other aid groups working to ameliorate the suffering. Two of my favorites are MercyCorps, providing clean water, food, and clean up tools in the Swat Valley, and Medecins Sans Frontiers/Doctors Without Borders, which is providing sanitation kits and basic supplies in Kyber Pakhtunkhwa and Baluchistan.  Dave Petley, who has worked in Pakistan, recommends FOCUS Humanitarian Assistance.

Categories: by Anne, geohazards, hydrology