The making of an angular unconformity: Hutton’s unconformity at Siccar Point

A post by Chris RowanAs you travel south along the North Sea coast between Edinburgh and the border with England, there is a dramatic change in the rocks exposed in the cliffs. Closer to Edinburgh, you encounter slightly tilted red sandstones of the rather prosaically named Old Red Sandstone formation, which are Devonian in age – around 350-400 million years old. The picture below is the northern end of Pease Bay, about 30 miles from Edinburgh.
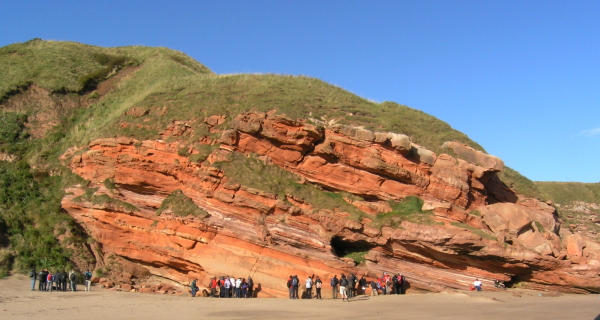
Old Red Sandstone at Pease Bay

Devonian Old Red Sandstone at Pease Bay, SE Scotland. Photo: Chris Rowan, 2009.

However, only a little further south the cliffs are composed of older Silurian (420-440 million years old) marine greywackes (another prosaically named lithology) that are clearly much more deformed, with lots of tight folds leading to almost vertical bedding.
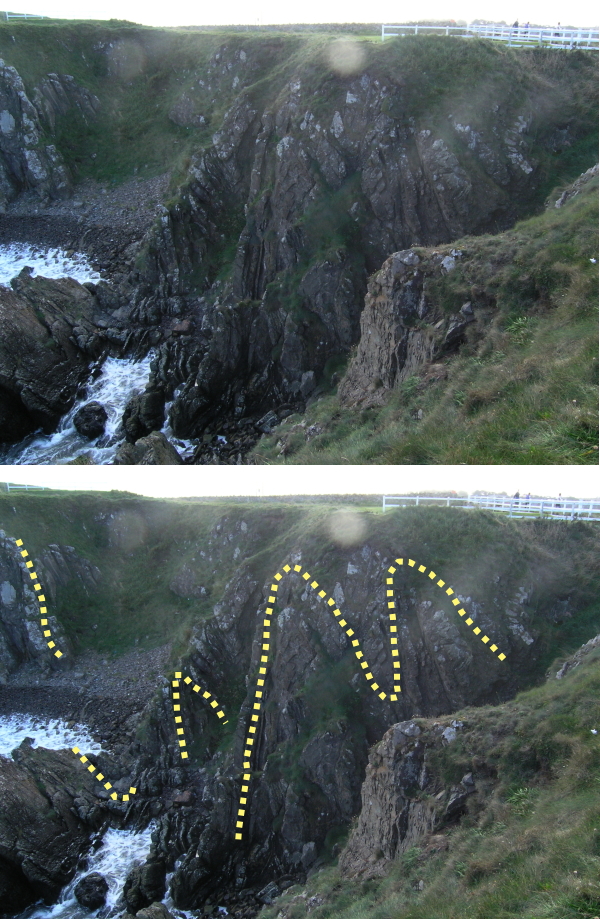
Folded cliffs at Eyemouth, SE Scotland

Folded Silurian greywackes in the cliffs at Eyemouth, SE Scotland. Photo: Chris Rowan, 2009.

Given this structural contrast, you can’t help wondering – what happens at the contact between these two units? In 1788, James Hutton was wondering just that, and chartered a boat to find the contact. Modern geological pilgrims tend to take an overland route instead, but we all end up at the same place: Siccar Point.

Hutton's Unconformity at Siccar Point

Hutton's Unconformity at Siccar Point (click for larger version). Photo: Chris Rowan, 2009.

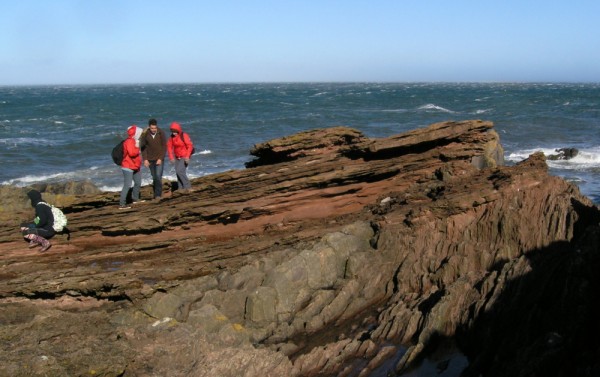
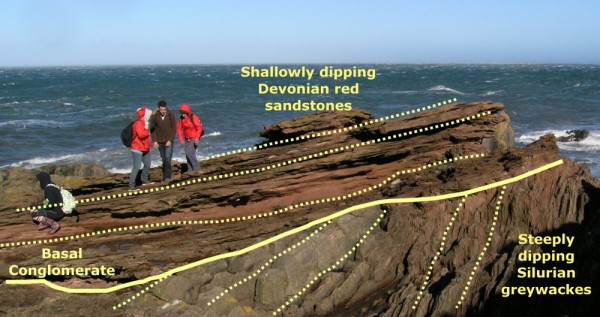
In the picture above, a sharp contact between the shallowly dipping red sandstones and the steeply dipping greywackes can be seen both in the cliffs to the right, and on the wave-cut platform to the left. If you have a head for heights, it is possible to scramble down a steep grassy slope to the platform and put your finger on the place where almost vertical beds meet almost horizontal ones: a textbook angular unconformity.

Angular Unconformity at Siccar Point

Standing on the angular unconformity at Siccar Point (click to enlarge). Photo: Chris Rowan, 2009

Angular unconformity at Siccar Point, annotated

As above, with annotations (click to enlarge). Photo: Chris Rowan, 2009

One advantage of being able to put your nose right on the contact is that you can see some details that you might otherwise miss. At this range, it is easy to spot that the contact between the two units is sharp, but it is not completely flat. Furthermore, the lowest part of the overlying Old Red Sandstone contains fragments of rock that are considerably larger than sand; some are at least as large as your fist, and many of the fragments in this basal conglomerate are bits of the underlying Silurian greywacke. These are all signs that the greywackes were exposed at the surface, being eroded, for a considerable period of time before the Old Red Sandstone was laid down on top of them.
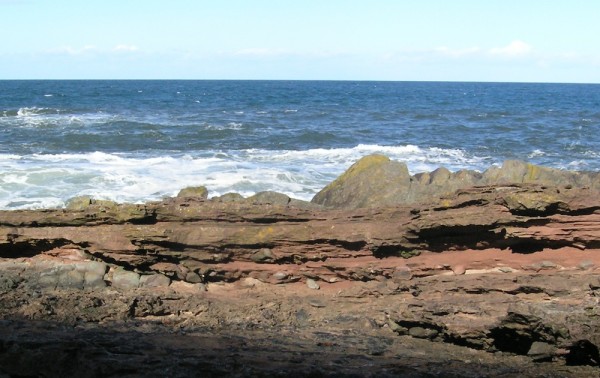
Erosional contact at Siccar Point

The irregular topography and basal conglomerate show that this is an erosional contact (click to enlarge). Photo: Chris Rowan, 2009.
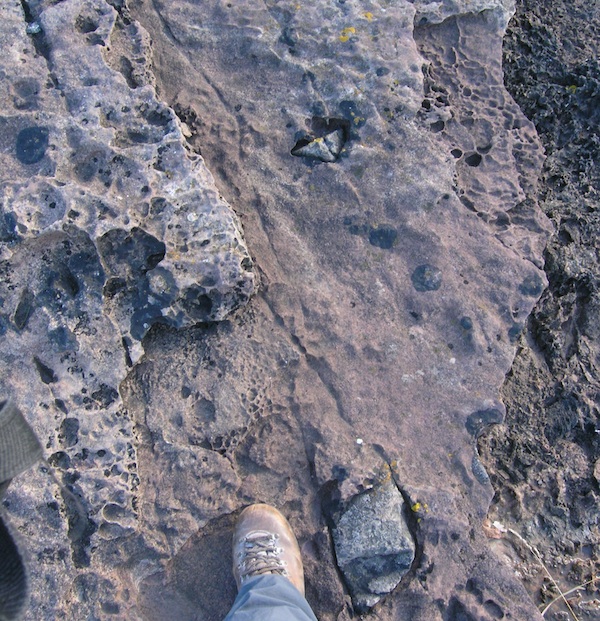
Basal conglomerate at Siccar Point

Many eroded chunks of the underlying greywackes can be found in the lowest part of the Old Red Sandstone. Photo: Chris Rowan, 2009.

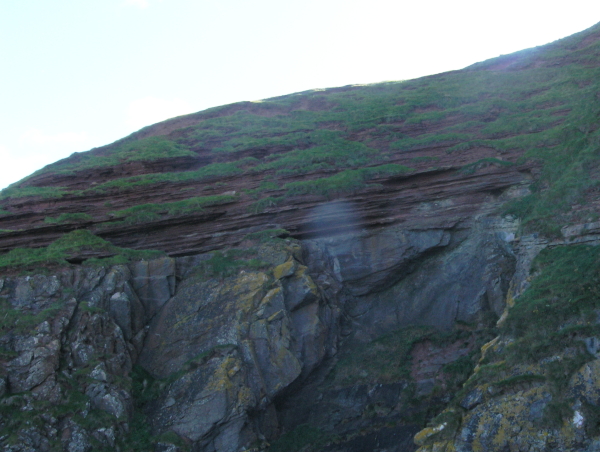
However, if we now raise our heads to look at the contact in the cliffs, we can’t help but notice that it looks a bit different: the contact is more planar, and there is no real sign of a conglomerate layer at the base.

Contact in the cliffs at Siccar Point

The contact in the cliffs at Siccar Point, viewed from below. Photo: Chris Rowan, 2009.

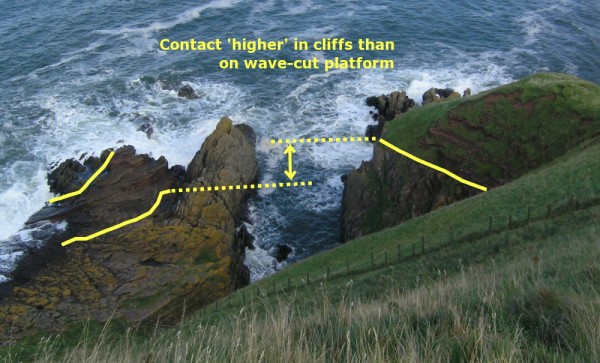
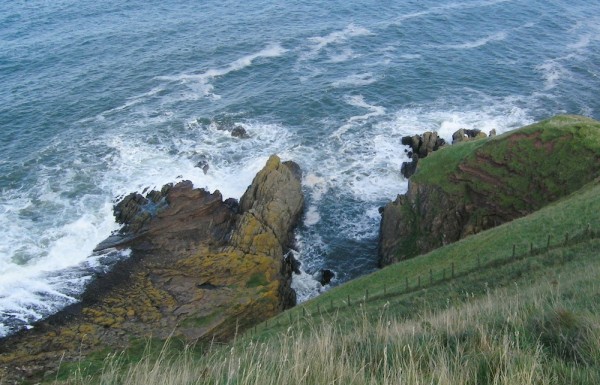
In fact, even though the sandstone beds are dipping slightly out of the cliffs, it seems that the contact in the cliffs occurs at a slightly higher level in the stratigraphy than the contact at the shore. We appear to be looking at paleotopography. The cliffs mark a small hill in the eroded Silurian bedrock, whilst the wave-cut platform marks a channel which collected erosional debris, explaining the conglomerate layer.

Contact topgraphy at Siccar Point

Contact topgraphy at Siccar Point. Photo: Chris Rowan, 2009.

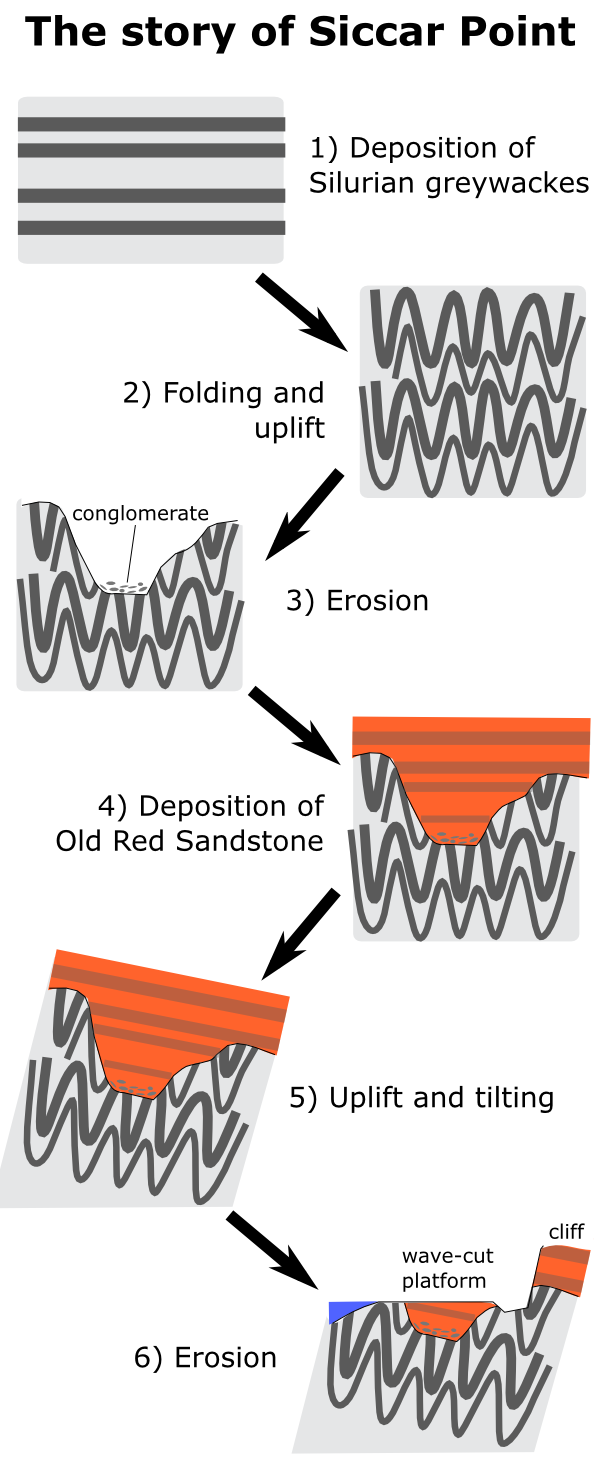
If you want to really get Deep Time, places like this are where you start. Once you understand that the vertical beds below the contact were originally horizontal, the vast amounts of time required to produce this structure leap right out at you from the outcrop.. It tells a geological story that began more than 400 million years ago with the deposition of the greywackes off an ancient coastline, and continues to the present day. So far there are six chapters, detailing folding and uplift during the creation of a mountain belt; the slow death of that mountain belt as wind and water ground it away; the formation of lakes and sand dunes on a warm, arid continent during the Devonian; a further, more gentle tectonic upheaval that led to the whole sequence being tilted; and finally, a further bout of erosion that has created the Siccar Point seen by Hutton, and tens of thousands of geologists and geology students since.

How the unconformity at Siccar Point formed

How the unconformity at Siccar Point formed.

As an extra treat, I also took a video camera on my trip to Siccar Point, and I’ve spliced the best of my footage together to make the short film below, which hopefully gives you a sense of where the unconformity is, and what it looks like. I apologise for the shakiness of some of the footage – it was a very windy day!

Categories: deep time, geology, outcrops, Palaeozoic, photos, structures

New at Erratics: from lahar to suevite

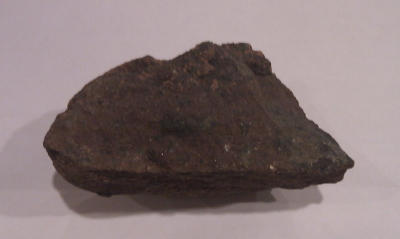
In his second post at Earth Science Erratics Simon Wellings reveals a rather interesting deskcrop, collected from Scotland in his youth:

Since it was picked up, this rock has changed identities: what was once thought to be a mud flow deposit is now thought to be formed from the debris of an ancient meteorite impact! What’s the evidence for this radical interpretation? Can we tell anything about the impact that formed this chunk of rock? Find out in Simon’s post.

Categories: planets, Proterozoic, rocks & minerals

Geology is destiny: globally mapping permeability by rock type

A post by Anne JeffersonResearchBlogging.org

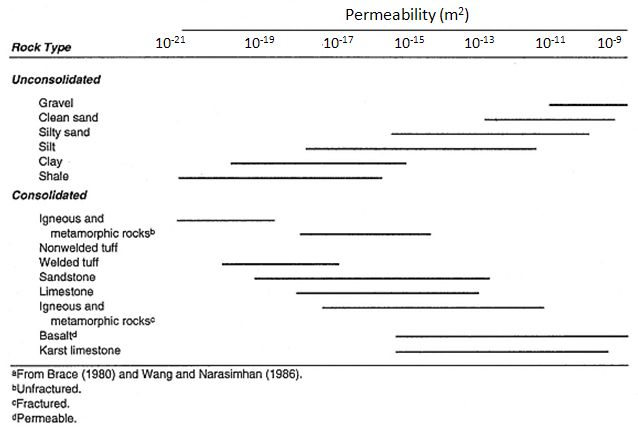
Permeability (the ease with which a fluid moves through a material) is the ultimate goal of many hydrogeologic investigations, because without that information it is impossible to quantify subsurface water and heat flow rates or understand contaminant transport. Yet permeability is notoriously difficult to quantify, both at the local-scale and the landscape-scale. Permeability varies over 13 orders of magnitude across rock and sediment types, because of differences in pore sizes, geometry, and connectedness. Loose gravel could have permeability as high as 10-7 m2, but unfractured igenous and metamorphic rocks could be as low as 10-20 m2. The diagram below is an example of the sort of relationship between rock type and permeability shown near the beginning of every major hydrogeology textbook.

Typical ranges of permeability for different rock types, usually based on hydraulic measurements made at wells.

Typical ranges of permeability for different rock types, usually based on hydraulic measurements made at wells.

Most of the time, hydrogeologists are happy to just to get permeability to within an order of magnitude or two. Knowing permeability is not just useful for those interested in in water supply problems and transport of contaminants. For scientists who model watersheds or land-atmosphere interactions in climate models, being able to easily estimate landscape-scale permeability would be incredibly helpful.

In a new paper in Geophysical Research Letters, scientists from Canada, Germany, the Netherlands, and the US have just done a big favor for those scientists. Gleeson et al. (2010) compiled the first regional-scale maps of permeability for the North American continent and the terrestrial globe. They are interested in permeability in the uppermost 100 m of the subsurface, but below the water table, where all pore spaces are saturated with water. They defined regional-scale as greater than 5 km, because they wanted to avoid influences by things like individual fractures. Using previously published hydrogeologic models, in which permeability was calibrated against groundwater flow, tracers, or heat fluxes, Gleeson and colleagues identified permeability values for 230 hydrogeologic units, grouping them into seven “hydrolithologic” categories, by rock type.

The scientists compared the permeability values from the models to the expected permeabilities for each rock type based on smaller-scale measurements (like those used to make the graph above), and they found reasonably good correspondence. They also examined whether permeability values within each hydrolithologic category were correlated with the scale of the model used to generate them. They found that permeability was scale-independent above 5 km, except in carbonates, where large karst features may result in changing permeability with increasing area.

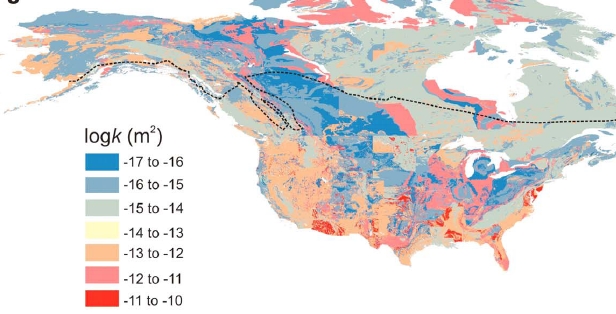
Using pre-existing geologic maps for North America and the world, Gleeson and colleagues divided the Earth into their hydrolithologic categories. For each category, they calculated the geometric mean of the modeled permeability values, and applied that mean permeability to all of the map units in that category. The resultant maps show the distribution of permeability across the land surface.

Portion of Figure 3c from Gleeson et al. (2010, Geophysical Research Letters).

Portion of Figure 3c from Gleeson et al. (2010, Geophysical Research Letters) showing the permeability distribution across North America. North of the dashed line is continuous permafrost and in that region, the map likely significantly over-estimates permeability.

The global map uses a single geology dataset, so there are no weird boundaries in the data, but it is of coarse resolution. The North American map (shown above) is at much finer resolution (75 km2 mean polygon area, with 262,111 polygons), but it has a few odd edges that correspond to state and national borders. The authors point to these boundary problems in their discussion of caveats, along with the problems associated with permafrost, deep unsaturated zones in arid areas, and deep weathering in the tropics. In addition, the use of a single permeability value for each category will necessarily lump together some terrains with similar rock types but differing geologic histories and resultant permeabilities (e.g., the High and Western Cascades in Oregon).

The work of Gleeson and colleagues represents an important first step in translating regional-scale geologic data into permeability fields. These maps will be useful for continental-scale and larger earth system models and for data sparse regions. Their methodology also raises some interesting possibilities for subdividing the hydrolithologic categories in areas where there are more hydrogeologic model data available, but where there hasn’t been comprehensive hydrogeologic modeling. Finally, their finding that regional-scale model values are in accord with the ranges reported in every hydrogeology textbook is a significant confirmation of the fall-back position of many students of hydrogeology: “If you have no data from wells in your field area, use a textbook to estimate permeability from the rock type.”

Gleeson, T., Smith, L., Moosdorf, N., Hartmann, J., Dürr, H., Manning, A., van Beek, L., & Jellinek, A. (2011). Mapping permeability over the surface of the Earth Geophysical Research Letters, 38 (2) DOI: 10.1029/2010GL045565

Categories: by Anne, geology, hydrology, paper reviews

#scio11 and #AGU10: a tale of two conference hashtags

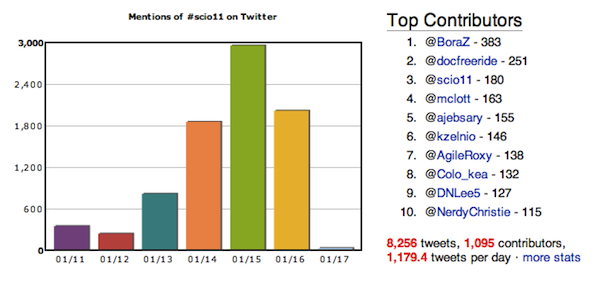
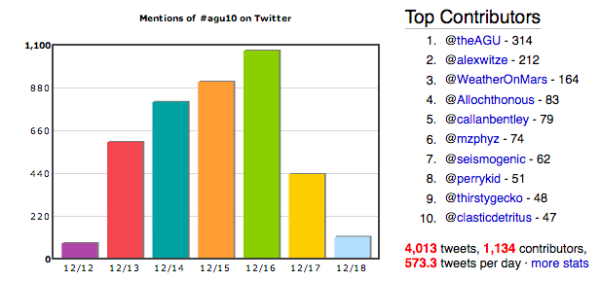
A post by Chris RowanIn the last couple of months, I’ve attended two conferences – the ScienceOnline in North Carolina – which had a Twitter hashtag that allowed tweets about the conference to be amalgamated together into a single stream. Based on my impressions of how they were used, I thought it would be interesting to compare statistics from the two hashtags over the week of their respective conferences, courtesy of What the Hashtag (and, in the case of the #AGU10 tweets, AGU press officer Maria Jose Vinas).

Tweets from ScienceOnline 2001: conference ran from Thursday 13th to Sunday 16th January 2011.

Tweets from AGU Fall Meeting: conference ran Monday 13th through Friday 17th December 2010.

#scio11 #AGU10
Attendees 300 18,800
People Tweeting 1,095 (365% of attendees) 1,134 (6% of attendees)
Total Tweets 8,256 (7.5 tweets/person) 4,013 (3.5 tweets/person)
Tweets from top 10 tweeters 1,792 (21.7%) 1,136 tweets (28.3%)
Retweets 42% 37.4%
Mentions 66.7% 47.2%

At first glance, a few things stand out in these statistics:

  • ScienceOnline was by far the smaller conference in terms of attendance – 300 against almost 19,000 at AGU – yet generated more than twice as many comments on Twitter over the week of the conference. Of course, it is hardly a surprise that a conference about online communication will involve a disproportionately high amount of online communication.
  • At both conferences around 1,000 different people were using the conference hashtag. This means that the average person tweeting from ScienceOnline posted twice as many updates as the average person tweeting from AGU, However, perhaps more significant is that whilst 1,000 people is a little more than 1 in every 20 attendees at AGU, it is more than 3 times the total number of people in attendance at ScienceOnline. Even if everyone in North Carolina was using Twitter, it seems that significant numbers of people not in attendance were following the conference. Perhaps they were watching the video streaming of some sessions and adding their commentary; perhaps they were retweeting observations from people who were at the conference; perhaps they were even asking questions (I attended at least one session where questions were submitted over Twitter by people who were not in that room). This level of wider interaction was not happening during the AGU conference.
  • The 10 top tweeters at AGU produced a much higher proportion of the total tweets than at ScienceOnline, meaning that a larger number of people were making significant contributions to the online conversation.
  • Retweets, and especially mentions, were higher at ScienceOnline. I suspect this probably reflects the fact that most of the people at ScienceOnline know each other to some degree, which led to more of the social components of the conference spilling online.

This is only the most basic of analyses, but it does square with my different impressions of the hashtag stream from the two conferences. There has been some debate in the past few days about the utility of the #scio11 hashtag, with some saying it was too noisy and self-referential to be useful. I’m not sure I agree. It’s certainly true that it’s far from being a lower bandwith version of a video stream: you’re not getting a chronological record of everything that was said. But what you can get is a sense of the overall flavour of the conference at any particular moment: which sessions are provoking thought, discussion or controversy, which things that someone has said have particularly resonated. For example, I was not in the “Perils of blogging as a woman under a real name” session, so I missed the flabbergasted silence that fell when Ed Yong commented on how women bloggers never message him, asking him to promote their posts (see the accounts here or here). But I did get some sense of the impact this comment had (mainly from the exclamation points in the tweets about it, if I recall correctly). In short I treated the hashtag tweet stream like the cheers and chanting of a crowd at a football match; by listening to them, you aren’t going to extract a full narrative of the game, but you can get an idea of the moments that are exciting, important, or controversial.

In contrast, tweets on the AGU hashtag felt much more disconnected – it was much harder to get any unified sense of what was going on. The conference was so much bigger that it was quite rare to have more than one person (if that) posting updates from any one session. Of course, there are so many sessions running in parallel that if you did have several people tweeting from each one it would probably be completely overwhelming: parsing the updates coming in from 4 different sessions is possible, but 50? I think that would be too much without session/discipline specific hashtags to help filter the torrent.

Also, if my own experience of tweeting from AGU was anything to go by, the style of the presentations – in that they were quite technical presentations of new data, rather than discussions – tended to restrict my tweets, as I needed to be writing and sketching non-140 character things in my notebook instead (perhaps this was part of the explanation for the lower rate of tweets per person compared to ScienceOnline). The fact that tweeting can’t seem to substitute for my paper notebook at conferences like AGU definitely gives me some pause, as it takes away a large part of the motivation for conference tweeting for me.

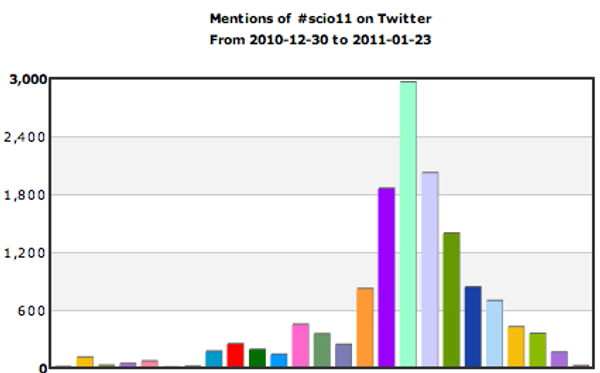
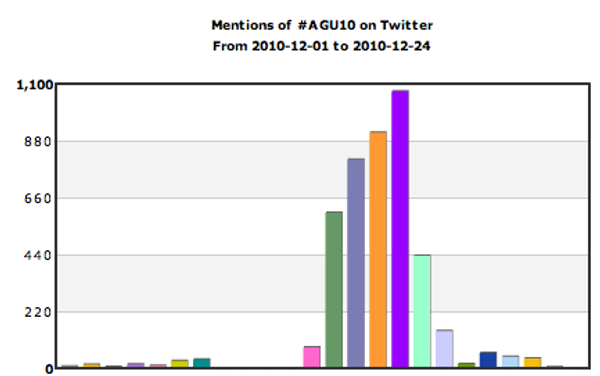
All this combined to make the stream from the AGU hashtag feel less like a rowdy several hundred person conversation, and more like a lot of people individually shouting into the wilderness. The ScienceOnline hashtag might have seemed noisy, but at least there was a signal beneath it, if you looked at it in the right way. And it is this signal – the underlying conversations – that make Twitter valuable. To emphasise this point, I will conclude with two more comparative graphs, showing the number of times the #scio11 and #AGU10 hashtags were used in the days leading up to, and the days following, the conference.

scio11 tweeting before and after the conference.

AGU10 tweeting before and after the conference.

One group were talking to each other before, during (shown by the higher mentions) and after the conference. The other group? Not so much. I think this highlights the real issue: it is far more about getting more geoscientists interacting with each other the whole year round, via Twitter and other online tools, than about how many tweets are shed at the AGU conference. Although perhaps the latter is an indicator of our progress – or lack thereof – on the former.

Categories: bloggery, conferences

Stuff we linked to on Twitter last week

A post by Chris RowanA post by Anne Jefferson

Blogs in motion

The Scienceseeker blog aggregator aims to act as a general portal for all science blogging, everywhere. It has a Geoscience section which is obviously still lacking a fair number of the geoblogs out there; I have submitted the blogs on the allgeo feed to be added to the database, but it may take a while as they run through the backlog of a deluge of submissions in the last week.

Earthquakes and Volcanos

Floods and Landslides

(Paleo)climate

Planets

Fossils

Environmental

General Geology

Interesting Miscellaney

ScienceOnline metabloggery

Unsurprisingly, this week has seen lots of summaries, reflections, and new conversations inspired by the ScienceOnline conference. Even Chris could not resist the siren call of navel-gazing.

Categories: links