Sendai/Tohoku earthquake round-up

A post by Chris RowanIt’s hardly surprising that my browsing this week has been focussed largely on the aftermath of the earthquake and tsunami in Japan (which is now officially being referred to as the Tohuku earthquake, rather than the Sendai earthquake; I’d complain this was harder to pronounce but I’m hardly in a position to on this blog). Given this, in place of our normal Twitter links round up, we have an earthquake link-fest instead.

General

  • For those who are still trying to understand exactly how the plate boundaries that intersect near Japan are structured, this figure, which I put together for my post on the Scientific American guest blog, may be helpful.
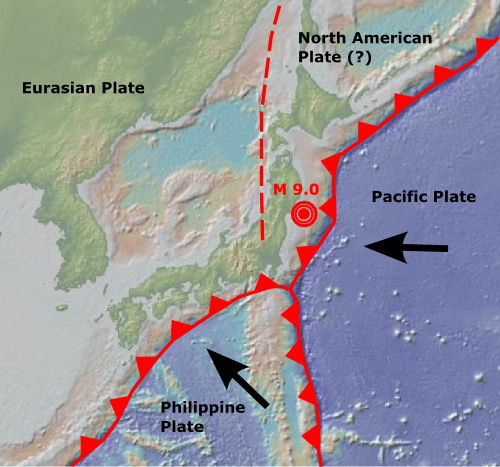
    The location of Friday's earthquake, with respect to the numerous plate boundaries that intersect near Japan. Base map generated by GeoMapApp (http://www.geomapapp.org/)

  • What are the forces at work at subduction zones that turn constant and relatively smooth plate motions into the jerky stick-and-slip behaviour of earthquake-generating faults? It’s all about friction, as Matt Kuchta demonstrates with an ‘Earthquake Machine’ constructed from a brick, spring and sandpaper.
  • As Dave Petley argues at The Landslide Blog, the Tohuku earthquake is entirely consistent with our understanding of how subduction zones work. However, the size of this particular earthquake does seem to have been a little beyond what was expected from this particular subduction zone. Old, cold oceanic crust, such as the Pacific plate being subducted beneath north Honshu, was thought to lead to smaller megathrust earthquakes than younger, more buoyant oceanic crust (such as what is being thrust beneath Cascadia, for example) because the lower buoyancy would lead to reduced friction at the plate boundary. Clearly, this is not the case, and may lead to us having to rethink the seismic hazards at “safer” subduction zones.
  • Sumatra, Chile, and now Japan, all in less than a decade: could there be a causal link between large megathrust events around the world? New Scientist explores the idea that great earthquakes could beget more great earthquakes. Sadly, it is very hard to do meaningful statistics on the small numbers and timescales represented by our instrumental records. Perhaps paleotsunami research can eventually provide some insight into this question.
  • We can’t predict earthquakes: any claims to the contrary either involve “precursors” that throw up more false positives than hits, or predictions so general that they can hardly fail to be “fulfilled”. Progress, however, is being made in earthquake forecasting – identifying areas that are particularly at risk from damaging earthquakes, even if one can’t say exactly when.

Deformation

Aftershocks

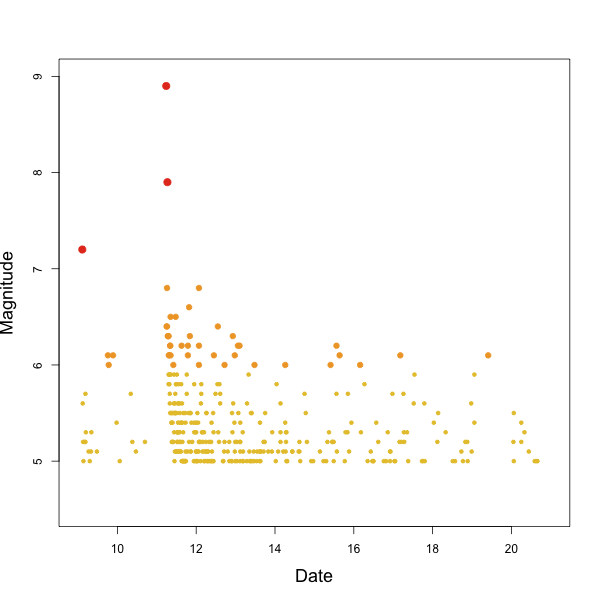
  • Below are updates of the earthquake plots that I produced for my original post, and my discussion of the aftershocks. So far there have been 336 earthquakes of greater than magnitude 5 following the main shock.
  • Magnitude of earthquakes (M5-6=small yellow circles, M6-7 orange circles, M7+ large red circles) off the coast of Honshu, 9-20 March.

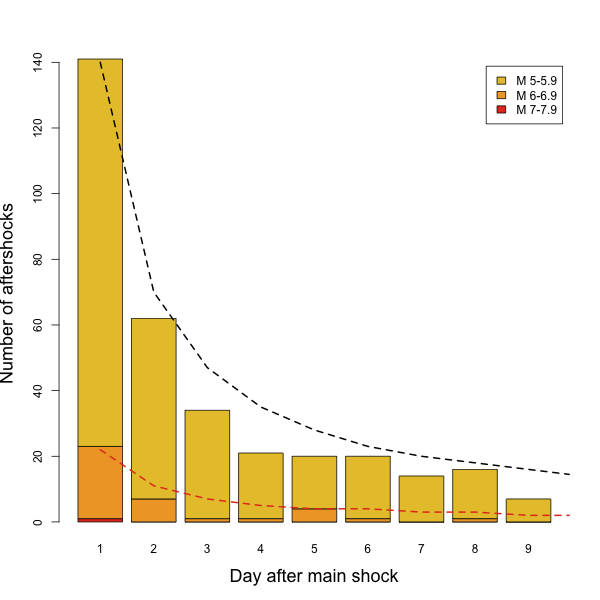
  • The number of aftershocks continues to decline approximately according to the inverse of the time since the earthquake, as expected.
  • Jascha Polet has also produced some really nice visualisations showing the distribution of the aftershocks in space and time. Contrary to some reports, the aftershocks are not currently showing any migratory trend, seemingly being randomly distributed along the length of the rupture.
  • For an animation of the earthquake sequence, Paul Nicholl’s Japan Quake Map is the place to go.
Tsunami

Categories: earthquakes, geohazards, links

Reverberations of the Honshu tsunami

A post by Anne JeffersonOn Friday 11 March 2011, when the fault ruptured off of the Japanese coast in a M9.0 earthquake, it caused a sudden vertical movement of the seafloor, displacing the water above it and transferring energy to the ocean. As the water returned to place (thanks, gravity!), the energy was transferred outward across the ocean in all directions. Just like when a pebble is thrown into the water, multiple tsunami waves were generated from a single disturbance.

In deep water, tsunami move about 400 km/hr and the surface displacement (wave height) is relatively small. That’s why, if it’s known that a tsunami is on its way, boats will leave harbor and head out to deep water. As the tsunami approaches the shore, it slows and the wave heights increase. The Japanese word tsunami actually means “harbor wave”, because it is only close to shore that it is easily spotted.

Along the east coast of northern Honshu Island, Japan, the tsunami struck shortly after the earthquake and with such overwhelming height and power that it flattened almost everything in its path. By far, most of the death and destruction in Japan is from the tsunami, and not the earthquake itself.

Tsunami propagation near Japan, 11 March 2011

Tsunami propagation near Japan, 11 March 2011 from http://supersites.earthobservations.org/201103_Tsunami_DrSatake.gif

One of things to notice in the animation above is that the tsunami took much longer to reach the city of Sendai (which is in the big bay area) than the coastlines to the north and south. According to that animation, villages to north of the bay would have had as little as 20 minutes between earthquake and tsunami, to the south of the bay it was 40 minutes or more (because the coast was farther from the epicenter), and within the bay, there was more than an hour between earthquake and tsunami (although this model may not fully capture the non-linear wave interference and refraction within bays).

Whatever the warning time, the sheer magnitude and force of the tsunami greatly exceeded anything the Japanese people had experienced since modern record keeping began. Approximately, 40% of the Japanese coast is lined with sea walls of varying heights, but as the New York Times describes, these sea walls provided little barrier to the March 11 tsunami. Worse, these seawalls may have lured coastal dwellers into a false sense of security and obscured their views of receding waters in advance of the oncoming tsunami. As a hydrologist, I was struck by the similarity of the problems with sea walls to the ones associated with levees along flood-prone rivers. The combination of under-engineering and complacency is a deadly combination when a major tsunami, flood, or hurricane strikes. Add to that a high percentage of elderly people in the Japanese population, and you have even more of a tragedy.

Of course, only some of the ocean’s energy as a result of the earthquake headed toward Japan. The rest spread out over the open Pacific ocean toward scattered islands, New Zealand, and the west coast of North and South America. The video (below) from NOAA shows how the tsunami interacted with ocean bathymetry as it sped across the Pacific. As the narrator says, be sure to notice how complicated the wave patterns get as they bounce off obstacles on the ocean floor.

Given the vast expanse of the Pacific Ocean, the rest of the world had the luxury of both time to prepare for the tsunami and the dispersion of energy to reduce its impact. The Pacific Tsunami Warning Center modeled and tracked the wave energy as it advanced toward Hawaii and the US West Coast. As these pdf plots from the NOAA Center for Tsunami Research show, the model predictions and actual tsunami heights and arrival times match pretty closely for Hawaii and Pacific Islands, US West Coast, and Alaska.

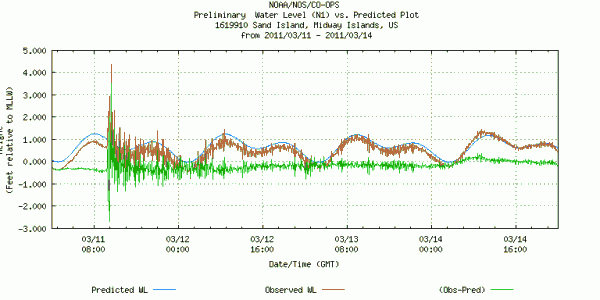
Away from Japan, the wave height of the tsunami varied greatly with location, depending on coastal geometry and near shore water depth. Topography above mean sea level also affected the tsunami’s impact. On Midway atoll, the tsunami reached a peak height of only ~1.3 m above mean lower low water level, but 10,000 albatross chicks were washed away from their flat island nesting areas.

Sea level data for Sand Island, Midway for 11-14 March 2011 (data from NOAA)

Sea level data for Sand Island, Midway for 11-14 March 2011 (plot from NOAA). The brown line is the observed sea level, and the green line shows the difference between the observed and predicted (non-tsunami) levels.

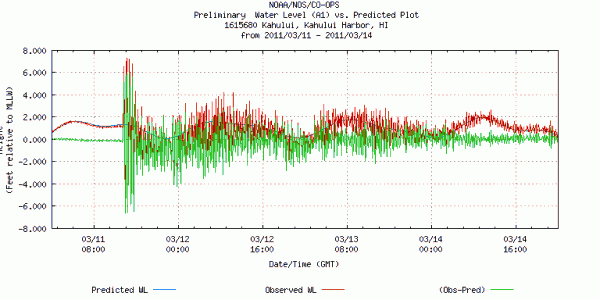
In Hawaii, the biggest tsunami wave was seen in Kahului Bay on Maui.

Sea level data for Kahului, Hawaii for 11-14 March 2011 (plot from NOAA).

Sea level data for Kahului, Hawaii for 11-14 March 2011 (plot from NOAA). The red line is the observed sea level, and the green line shows the difference between the observed and predicted (non-tsunami) levels.

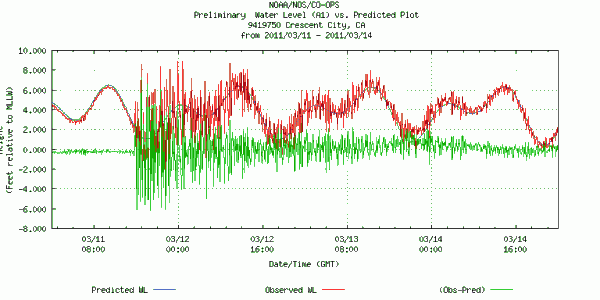
On the US west coast, the tsunami struck near low tide and in many places it was barely visible to observers on shore. Nonetheless, officials in coastal areas did the right thing by closing beaches and ordering evacuations. In Crescent City, California, which has a pecular tsunami-magnifying coastal geography, the maximum wave height exceeded 2.5 m, and several million dollars of damage was done to the harbor. A bit farther north, people were swept out to sea, resulting in one death.

Sea level data for Crescent City, California for 11-14 March 2011 (plot from NOAA).

Sea level data for Crescent City, California for 11-14 March 2011 (plot from NOAA). The red line is the observed sea level, and the green line shows the difference between the observed and predicted (non-tsunami) levels.

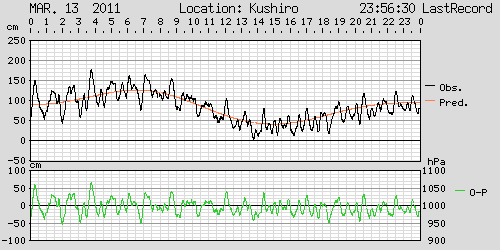
In the water level graphs posted above, the initial few hours of the tsunami impact clearly stand out. But a bit closer look reveals that water was still reverberating and sloshing around the Pacific Ocean in unusual ways for several days after March 11th. As this tidal gage from Kurushiro, Japan, on Hokkaido Island, well north of the worst tsunami effects, shows, on March 13, two days after the earthquake, water levels were still fluctuating by almost a meter relative to their normal levels and at much greater frequency than the tidal cycle.

Sea level at Kurushio, Japan, 13 March 2011

Sea level at Kurushio, Japan, 13 March 2011. Plot from the Japanese Meteorological Academy: http://www1.kaiho.mlit.go.jp/KANKYO/TIDE/real_time_tide/sel/1203_e.htm

Finally, I’d like to remind residents of and visitors to the US and Canadian west coast that you are sitting in a nearly identical tectonic situation to the one that produced the Sendai earthquake and its tsunami. Like the Japanese victims, a major earthquake off the North American west coast would give you minutes, not hours, to get to high ground. Worse, we are way behind Japan in terms of earthquake and tsunami preparedness and awareness. Only now is a US city designing its first tsunami resistant building, despite a paleo-record of earthquakes and tsunami as large as that in Japan. You can listen to paleo-seismologist Brian Atwater talk about discovering ancient tsunami deposits and watch this USGS animation of a hypothetical tsunami along the Pacific Northwest. Americans have some important lessons to learn from the Sendai disaster – about the force of nature, the limits of engineering, the value of preparedness, and the ease with which some shaking ground and a wall of water can wipe away all of the comforts of modern society along with thousands of human lives. We owe it to the Japanese people to learn from their tragedy.

Categories: basics, by Anne, geohazards, tectonics

Aftershocks of the Sendai earthquake

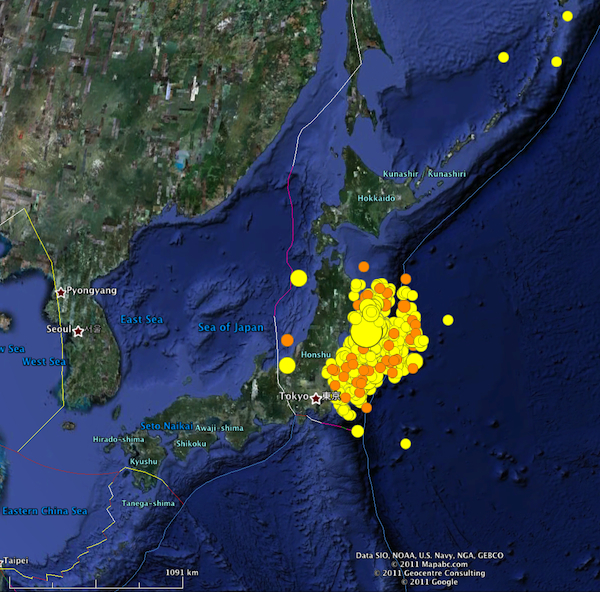
A post by Chris RowanOn a map of global earthquake activity, Japan rather stands out right now: a pulsing boil of seismic activity that all but drowns out the shaking in the rest of the world.

The last 7 days of earthquake activity in Japan. Data from the USGS.

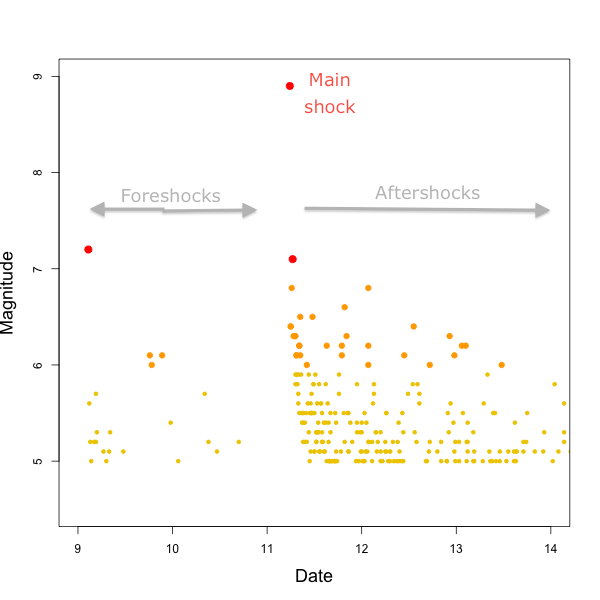
As of a few hours ago (5pm Central Time, 14 March) around 250 aftershocks of magnitude 5 or greater have occurred in the region surrounding the bit of the subduction zone that ruptured last Friday in a magnitude 9 (or thereabouts) earthquake. Around 1 in 8 of those 250 were greater than magnitude 6. Here’s an updated version of the plot of earthquake magnitude against time that I included in Friday’s post.

Magnitude of earthquakes (M5-6=small yellow circles, M6-7 orange circles, M7+ large red circles) off the coast of Honshu, 9-14 March

We can’t predict the timing and location of any particular aftershock any more than we can predict the timing and location of any earthquake before it happens. But records of the number and distribution of aftershocks following large earthquakes in the past show that we can make predictions about the aftershocks in aggregate. These observed relationships can be regarded as seismological rules-of-thumb: we may not be able to calculate them from first principles, but they have proven to be a useful guide to how the crust around a fault behaves after it ruptures.

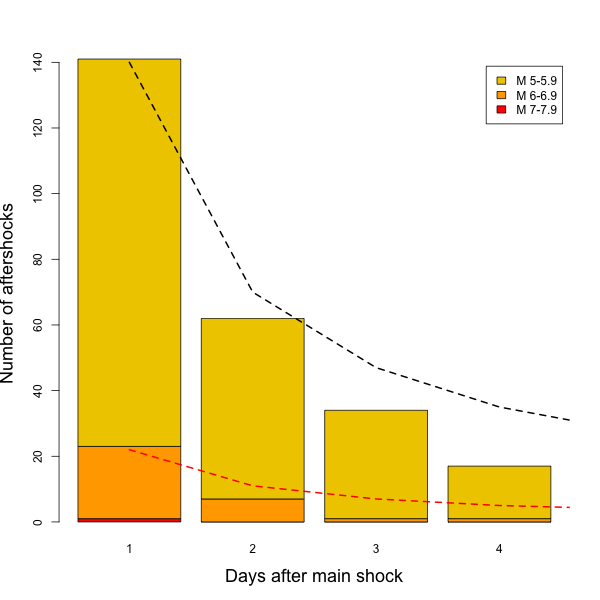
So, what are these rules-of-thumb? Firstly, the frequency of aftershocks falls away at a rate inversely proportional to the time since the earthquake. What this means is that if there are 60 aftershocks in the first 24 hours after the main shock, then there will be around half that number – roughly 30 aftershocks – in the 24 hour period that follows that – and a third of that number – roughly 20 aftershocks – in the 24 hour period that follows that. This relationship holds true whether you are considering every single aftershock, or a subset such as ‘every aftershock greater than magnitude 6.’

The graph above seems to show a fairly sharp decrease in both the rate and magnitude of the aftershocks since Friday, as we would expect. To show this more clearly I made the bar chart below, which shows the rate of aftershocks in the days following the March 11 quake, along with the ‘predicted’ rates for aftershocks of greater than magnitude 5 (black dashed line) and aftershocks of greater than magnitude 6 (dashed red line)

The fit isn’t perfect, but activity is declining at around the expected rate: although we’ll probably continue to see aftershocks in this region for a few months, they’ll occur at the rate of a few a day rather than lots an hour.

The other rule-of-thumb applies to the magnitude of the aftershocks, and is often expressed as ‘the largest aftershock will be one unit below the magnitude of the main shock.’ If so, the largest aftershock of Friday’s magnitude 9.0 would come in at around magnitude 8.0, which is a pretty sizeable earthquake in it’s own right. Thus far, the largest aftershock of the Sendai earthquake has been a magnitude 7.1 that occurred less than an hour after Friday’s main shock. Should the Japanese be worried, then? Not necessarily. According the the USGS page on aftershocks, ‘the difference in magnitude between the main shock and largest aftershock ranges from 0.1 to 3 or more, but averages 1.2’, so it seems that there’s a bit of slop in this particular rule of thumb. [Update: That 7.1 has now been upgraded to a magnitude 7.9 – all the seismic energy still bouncing around in the earth following the mainshock probably mucked up the original estimate. This still doesn’t absolutely rule out another >M 7 aftershock, of course. Thanks to Jascha Polet for the heads-up]. Also, due to the inverse time relationship we’ve already discussed, the likelihood of a large aftershock decreases with time. Conversely, however, a single large aftershock a long time after some earthquakes is not going to show up when looking at many many aftershocks in aggregate, and we’ve had recent proof that such things can happen, although in that case things were a little bit complicated.

Categories: basics, earthquakes, geophysics

Magnitude 8.9 (or 9.0, or 9.1!) Earthquake off the coast of Japan

A post by Chris RowanAround 3pm local time yesterday, there was a massive earthquake about 100 miles off the east coast of northern Honshu Island, Japan. Initially calculated to be a magnitude 8.9, it has since been upgraded: the current CMT solution at the USGS has it as a 9.1. Either way, this is the biggest instrumentally recorded earthquake Japan has ever been shaken by, and is one of the biggest ever detected: it’s up there with the 2004 Boxing Day earthquake, and like that earthquake it generated a large – and extremely damaging – tsunami. The footage from the Honshu coast almost defies belief.

There is already lots of excellent coverage of this earthquake from the geoblogosphere: Callan Bentley has an excellent summary of the characteristics of the earthquake and the tectonics that generated it, and over at Georneys Evelyn provides some excellent explanations of the geological forces acting at subduction boundaries, and Japan in particular. A comprehensive list of other posts on the earthquake is being compiled by Silver Fox over at Looking For Detachment.

Nonetheless, I think there’s still a few issues that I can try to clear up:

Which fault actually ruptured in this earthquake?

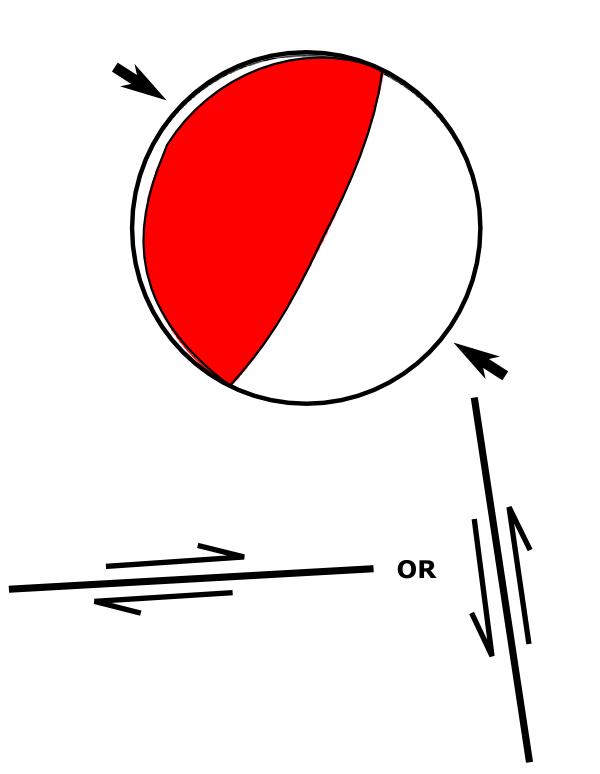
Japan is situated in a complicated plate boundary region where three subduction zones meet. This particular earthquake is on the part of the boundary where the Pacific plate is being subducted west beneath the North American plate (yes, really: the not-particularly active boundary between the North American plate and the Eurasian plate runs through Siberia, down the western edge of the Sea of Okhotsk and through Japan). Unsurprisingly, the focal mechanism indicates compression, along either a shallowly west-dipping or a steeply east-dipping fault (primer on focal mechanisms)

Focal mechanism for the main shock, and cross-sections of the two possible fault orientations

[Note: due to a severe foul up in my initial analysis, I’ve had to heavily modify this section. Contrary to what I originally wrote, the focal mechanism is entirely consistent with movement on the subduction interface, so is not a splay fault as I originally proposed. Many thanks to Kim Hannula and Eric Fielding, who both corrected me via e-mail. I am now heading to stereonet bootcamp]

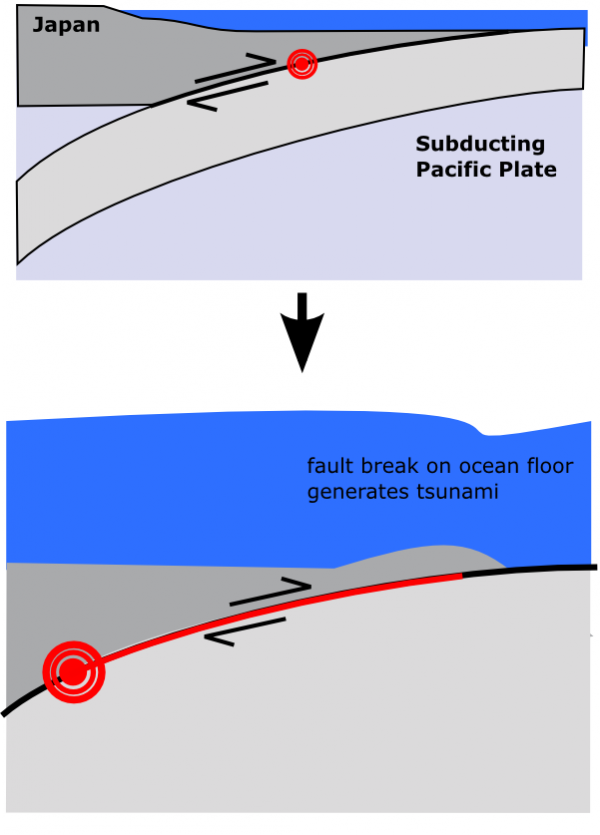
This is consistent with motion on the subduction interface, and even though the rupture was 150 km behind the trench where the plate boundary intersects with the seafloor, it seems to have propagated most or all of the way to the surface, producing large, sudden vertical movement of the sea-bed and the overlying water and generating a tsunami.

The rupture appears to have propogated to the sea-floor, generating a tsunami.

What’s with the changing magnitude estimates?

To estimate earthquake magnitudes, you look at the amplitude of the seismic waves it generates: the larger the amplitude of the waves, the larger the magnitude of the earthquake that produced them. However, in very large earthquakes, this relationship starts to break down, at least for the frequencies of seismic waves that are generally used to produce the quick magnitude estimates: they ‘saturate’, or stop increasing in amplitude as the earthquake magnitude does. This means that the magnitude estimates for the largest earthquakes will be somewhat underestimated until seismologists look at lower frequency waves, which are less susceptible to this saturation effect.

Were there foreshocks earlier in the week, and did they warn a bigger quake was on the way?

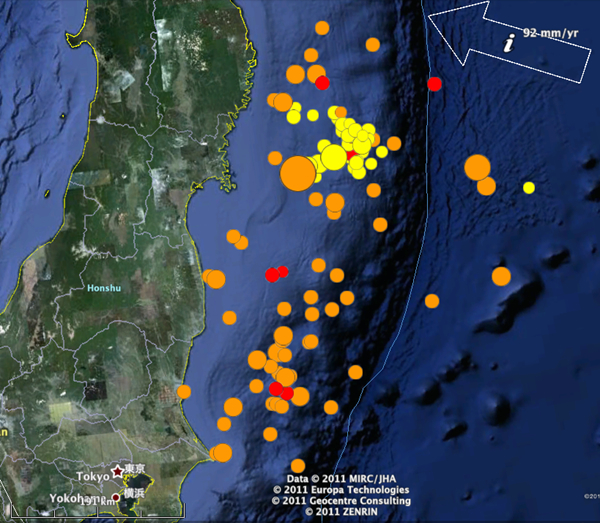
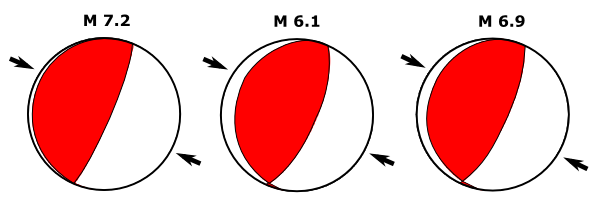
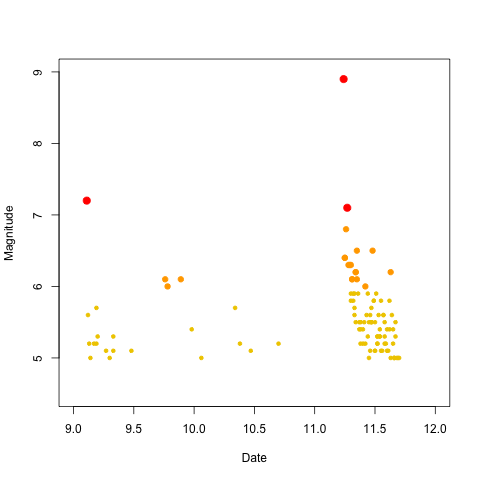
Yes to the first, no to the second. On Wednesday, there was a magnitude 7.2 earthquake in the same region as today’s earthquake, with a very similar-looking compressional focal mechanism, which was followed by a number of smaller >M 5 quakes, including three M 6-6.1 events (the focal mechanisms for two of these are also shown in the figure below; there is no focal mechanism available for the third). These were mainly clustered in a region just to the northeast of today’s larger rupture, and within the much larger cloud of aftershocks that are still being produced by that event (at my last count, there have been more than 100 aftershocks of greater than magnitude 5, and almost 20 of greater than magnitude 6). Thus, in hindsight, these earthquakes were clearly foreshocks of today’s main event.

Map showing location of seismicity on 9th and 10th of March (yellow circles) compared to March 11's ~M9 (largest orange circle) and its aftershocks (other orange and red circles).

However, there was no way of telling this in advance: there is nothing particularly “foreshock-y” about foreshocks beyond the fact that they end up being smaller in magnitude than the main shock they precede. In fact, if you plot the last few days of earthquakes over time, you can see that, on Wednesday and Thursday, seismic activity seemed to be dying down again in the wake of Wednesday’s 7.2 quake.

Magnitude of earthquakes (M5-6=small yellow circles, M6-7 orange circles, M7+ large red circles) off the coast of Honshu, 9-11 March.

What didn’t cause this earthquake?

In case you were wondering, this earthquake was not anything to do with:

  • The moon (or the ‘Supermoon’, which is the woo-ified way of saying ‘the Moon, a teeny tiny bit closer to Earth than it is on average) – Erik Klemetti has a good dismantling of this one.
  • The Christchurch earthquake – devastating as it was due to it’s location, this month’s M 6.3 earthquake in Christchurch was not that large in the grand scheme of things, releasing around 30 times less energy even than Wednesday’s 7.2 foreshock.
  • Non-existent US government earthquake weapons
  • The run-up to 2012 (we’re still way behind the 1960s)

Sadly, devastating events like this are a part of the way the planet we live on works. Despite claims and pseudo-predictions to the contrary, they require no special explanation beyond normal plate tectonics, with all of the unpredictability – on human timescales, at least – that that implies.

Categories: earthquakes, focal mechanisms, geohazards, tectonics

Stuff we linked to on Twitter last week

A post by Anne JeffersonChris has been on Twitter holiday this week, so you’ll be treated only to Anne’s Twitter obsessions in this week’s linkfest.

Volcanoes

Fossils

(Paleo)climate

Water

Environmental

General Geology

Interesting Miscellaney

Categories: by Anne