Lingering flooding along the Middle Mississippi River and tributaries

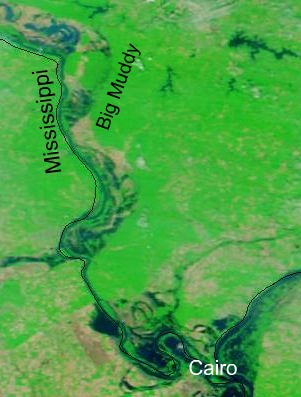
NASA MODIS image of flooding along the Middle Mississippi, 20 May 2011

Figure 1. NASA MODIS image of flooding along the Middle Mississippi, 20 May 2011.

One week ago today (28 May 2011), I had the chance to explore the lingering flooding along the Mississippi River and its tributary Big Muddy River in southern Illinois. The area was long past its crest; it is upriver of Cairo and the Birds Point Floodway. Around Carbondale, evidence of the recent high water was still visible in all of the drainages, but the water was back well within the stream banks. Closer to the confluence with the Mississippi though, high water levels on the Mississippi were still forcing backwater flooding of the floodplain and the Big Muddy River.

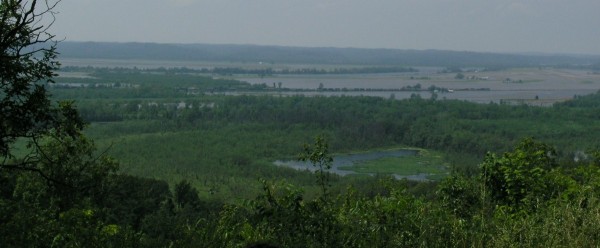
Driving and hiking along the escarpment of the LaRue-Pine Research Natural Area afforded expansive views of the flooding – and the remnant landscapes of previous millenia of river activity.

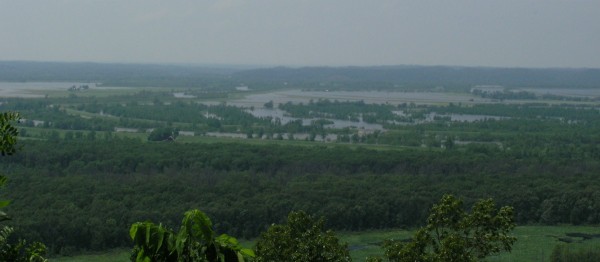
Foreground: An abandoned channel remains as a wetland. Background: Levees and flooding along the Big Muddy River.

Figure 2. Foreground: An abandoned channel remains as a wetland. Background: Levees and flooding along the Big Muddy River. (Click for larger version)

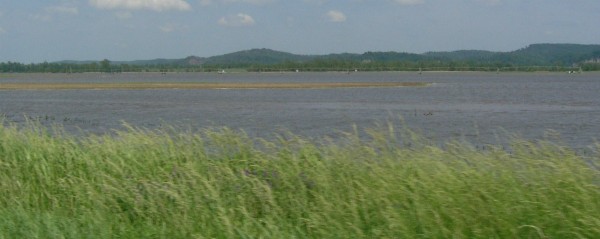
Flooding along the Big Muddy River, 28 May 2011

Figure 3. Flooding along the Big Muddy River, 28 May 2011 (Click for larger version)

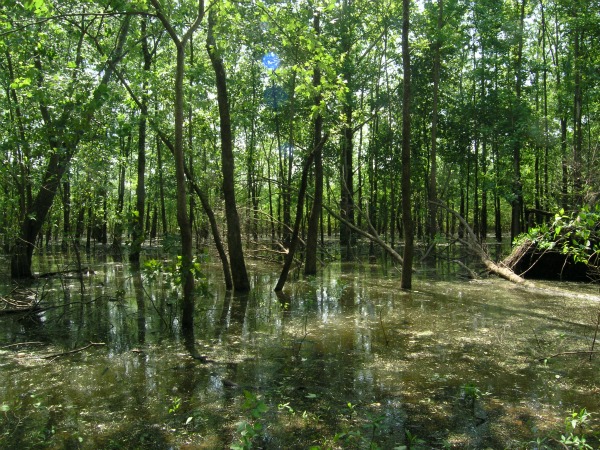
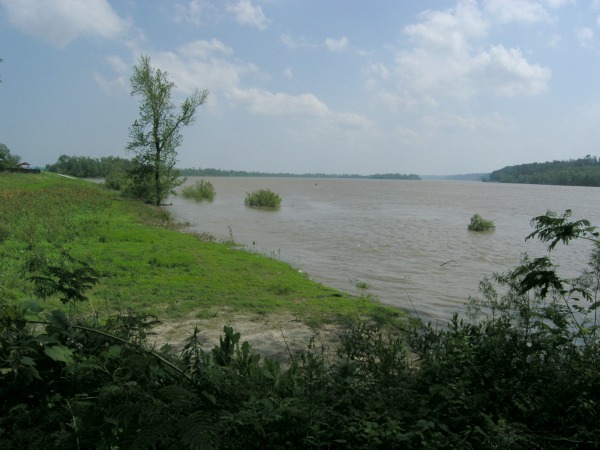
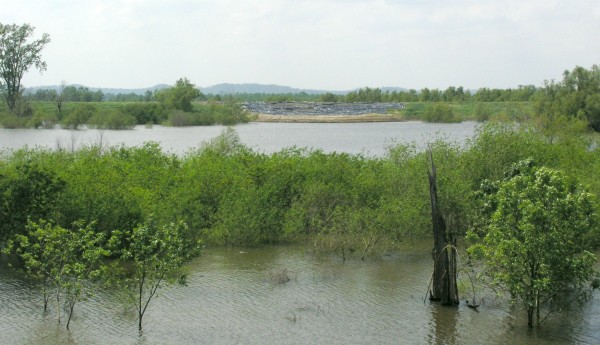
Once we descended from the hills and onto the floodplain, we were immediately greeted by floodwaters.

Flooded bottomlands

Figure 4. Flooded bottomland forest along the Big Muddy River.

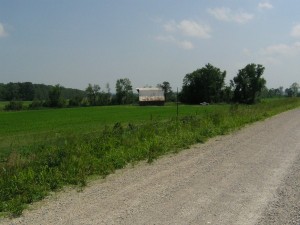
Driving away from the hills towards the Mississippi, our road took us along the top of the levee, giving us close up views of the effects of leveeing, levee repairs, and local wildlife.

Big Muddy inside the levee

Figure 5. A barn and fields protected from flooding by the levee on which we drove. (View out the window on the south side of the car.) (This barn is visible in the middle left of Figure 3).

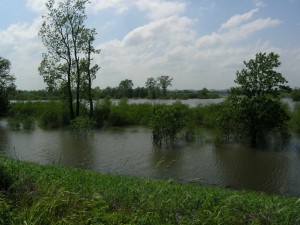
Big Muddy outside the levee

Figure 6. The Big Muddy River, in flood, contained by the levee we drove along. (View out the window on the north side of the car, immediately opposite Figure 5.)

Levee repair along the Big Muddy

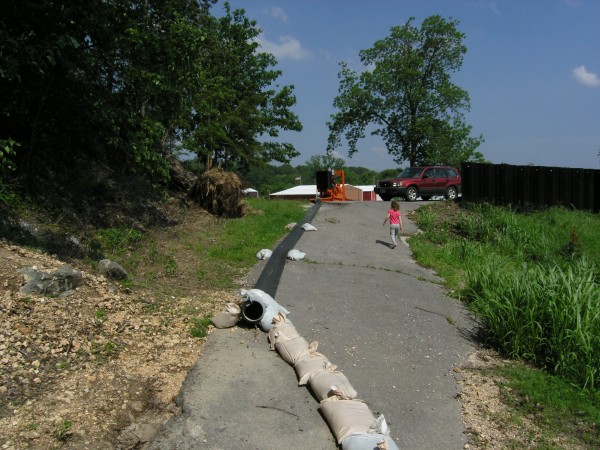
Figure 7. Temporary levee repair along the Big Muddy. The plastic sheeting and sandbags may be covering an area that had cracked or started to erode (click for larger).


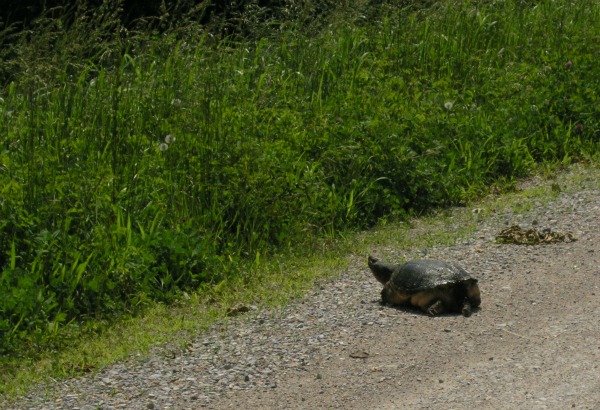
Snapping turtle

Figure 8. Why did the snapping turtle cross the levee road?

After crossing the Big Muddy River, we drove along a state highway that was not atop a levee, and only a few feet above flooded fields. Egrets and herons were everywhere in the standing water, and a pleasant breeze whipped up waves on the water. But we were reminded that this scene was normally not so watery…in the image below, you might be able to see a center pivot irrigation line in the field, standing in the flood waters.

Flooded fields and an irrigation line

Figure 9. A flooded field, with an irrigation line. Normally, this landscape would not be so blue. (Click for larger)

Finally we reached the Mississippi itself, in Grand Tower, Illinois. The river was definitely high, but open for business – we watched a tow and barges go by. The town of Grand Tower is situated immediately adjacent to the Mississippi – and protected by a big levee. Near the north end of town, the levee was a few feet lower than the rest, and here a metal floodwall had been constructed atop the levee. There was also evidence that a pumping operation had been set up – to pump water from behind the levee back into the river. Whether this pumping was necessitated by seepage or localized ponding, I couldn’t tell. But here, in a sleepy little town on the Mississippi, the effects of our efforts to keep floodwaters off the floodplain were in full display.

Pumping set up and a floodwall atop a levee

Figure 10. A pumping and a floodwall atop a levee (on right side of photo) in Grand Tower, Illinois.


Mississippi River flooding, Grand Tower, Illinois

Figure 11. Mississippi River flooding, Grand Tower, Illinois. Looking downstream, with a levee on the left side of the image.

Categories: by Anne, geohazards, hydrology

If you’re waiting for an earthquake warning, you’re doing it wrong

A post by Chris RowanThe magnitude 6.3 earthquake that stuck central Italy near the city of L’Aquila in April 2009 killed more than 300 people, made tens of thousands more homeless, and caused billions of Euros’ worth of damage. No-one could have predicted exactly when it would strike, or how large it would be when it did, because you can’t predict earthquakes. And yet, despite this, six Italian seismologists and an official of Italy’s Civil Protection Agency are in the process of being prosecuted for the manslaughter of those killed in the earthquake. In Italy at least, it seems you can be held accountable for failing to predict the unpredictable.

The case being brought hinges on a meeting that took place on 31 March 2009, one week before the L’Aquila earthquake hit. Just prior to this there was a swarm of earthquakes in the magnitude 3-4 range in the region, and this seems to have been enough to prompt the Italian Civil Protection Agency to confer with Italian seismologists, to clarify if these tremors were a prelude to a bigger earthquake. In a press conference following this meeting, Bernardo De Bernardinis (the accused Civil Protection Agency official) said:

The scientific community tells me there is no danger, because there is an ongoing discharge of energy. The situation looks favourable.

This statement seems to imply – incorrectly – that the small earthquakes felt up to that point reduced the risk of a larger earthquake later. In fact, they would have had only a minor effect on the stored regional strain that was eventually released by the L’Aquila earthquake. However, misleading as this statement is, it does not appear in the minutes of the meeting: it seems we’re probably looking at De Bernardinis’ own confused interpretation of what the seismologists told him (I wonder – and this is pure speculation – if they were discussing how the swarm that prompted the meeting seemed to be dying down).

However, there is a far more fundamental problem. The implication at the heart of the prosecution’s case is that the press conference should have proclaimed the opposite: that there was a risk of a big earthquake in the coming days. If they had, the prosecution claims, then people in the area would have taken the last minute precautions that would have saved more lives, if only the accused hadn’t translated “their scientific uncertainty into an overly optimistic message”. The problem with this line of reasoning is that there was no basis for saying such a thing based on the information available at the time. The small earthquakes in the week before the L’Aquila main shock may well have been foreshocks, but there’s no way of knowing this in advance; there is nothing inherently ‘fore-shocky’ about foreshocks, it’s just a classification made in hindsight.

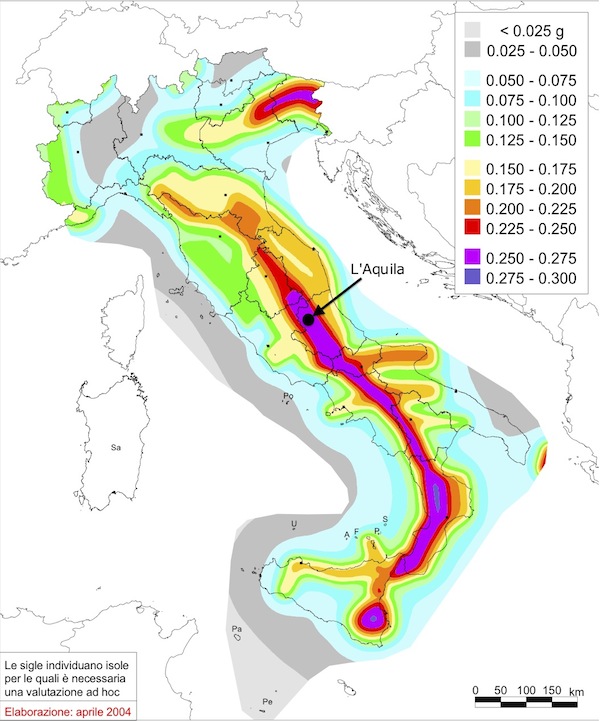
The message the seismologists probably wanted to convey (and, admittedly, failed to) was that there was no immediate danger – beyond the normal risks associated with living in a tectonically active region. In Italy, events like the 2009 earthquake are no surprise at all: since 1900 the country has been stuck by 11 magnitude 6 or greater earthquakes, including the 1915 Avezzano earthquake, only 30 km or so south of L’Aquila, that had an estimated magnitude of 7 and killed more than 30,000 people. Italy’s equivalent of the USGS or BGS, the INGV, produced this map of the seismic hazard in 2004. Guess which city falls smack bang in the middle of one of the areas of highest risk?

Seismic hazard map of Italy

Seismic hazard map for Italy, showing the peak ground accelerations that have a 10% chance of being exceeded in 50 years. Source: INGV.

This is the real crux of the issue: for those living in L’Aquila, a damaging earthquake was inevitable. And, given that there is no reliable method of short-term earthquake prediction, waiting for some sort of official warning so that you could then rush around like a headless chicken is not a good strategy. What you need to do is acknowledge you live in a seismically active area, and be prepared for the earthquakes that are a consequence of this, whenever they chose to strike. For the authorities, this means setting and enforcing building codes, improving the resilience of vital infrastructure, and making sure clear emergency response plans are in place. For the general populace, it is about making sure you know how to best protect yourself when your house starts shaking.

This prosecution distracts from this message, and plays to the misguided idea that there was something concrete for the Italian seismologists to miss, or play down, in the run up to L’Aquila earthquake – something that should have prompted an explicit warning. There wasn’t. This is just another example of the perennial problem when talking about earthquake risks. The public wants to be told that they might not want to be in the area next Friday; all a seismologist can justifiably say is that if you hang around for the next 50 years, you’ll definitely feel something. Probably.

Categories: earthquakes, geohazards, public science, ranting, society

Simulating river processes…ooh shiny, stream table!

A post by Anne JeffersonI’ve got a shiny new Emriver Em2 river processes simulator (i.e., stream table), thanks to departmental equipment funds and enthusiastic colleagues. I’ve been on sabbatical this semester and away from campus, so I haven’t had a chance to play with it yet, but it is enticing me to return. I’ll be teaching Fluvial Processes fall semester, so I’m sure that my students and I will get plenty of chances to explore all of the nifty ways in which we can demonstrate and experiment with fluvial geomorphology. I’m also playing with ideas for using the Emriver model in my hydrogeology class in the spring. I think it will be a perfect way to demonstrate ideas of hyporheic flow, seepage erosion, and break through curves in tracer tests. I think my colleagues are planning to use it in sedimentology, geomorphology and hydrology classes, and one colleague may take it with him when he does outreach activities. I’m sure we will come up with even more uses for it once we get started.

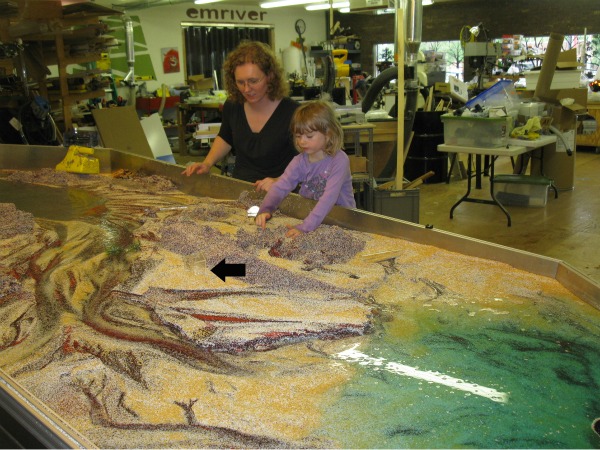
Em4 model at work.

Em4 model at work in promoting discussion about whether the arrow points to a good place to build a house.


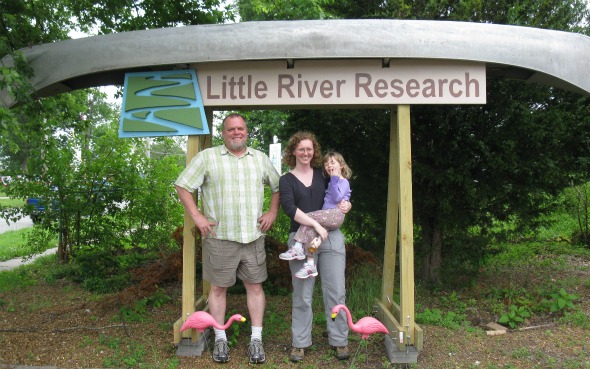
My appetite for experiment with the stream table was whetted by a recent visit to Carbondale, Illinois and the base of operations for Little River Research and Design (LRRD). Steve Gough is the owner of LRRD, the mastermind behind the Emriver models, and a genuinely fantastically nice person. Motivated by the idea that hands on education about stream processes is the best way to instill respect for and promote protection of streams and rivers, Steve has poured himself into making the best stream table on the market, and making it affordable enough to for people like me to get their hands on.

Steve Gough, Anne Jefferson and a research assistant in front of LRRD, May 2011

Steve Gough, Anne Jefferson and a research assistant in front of LRRD, May 2011

Personally, I’d always been somewhat underwhelmed by teaching- and demonstration-grade stream tables before seeing the Emriver ones. Partly it was because I’d seen and read about big research flumes, like those at the St. Anthony Falls Lab and Johns Hopkins. But another part of it was that every time I had a chance to play with a home-built stream table I was frustrated by what it couldn’t do. Principally, most stream tables don’t do a very good job of reproducing the meandering behavior of lowland streams. This has even been an area of active and high profile research in the fluvial geomorphology community. Steve’s use of low density plastic beads instead of quartz sand solves that problem pretty nicely, though there’s definitely still some braiding going on.

In addition to the 2-m long Em2 model that I have, LRRD also makes an extremely cool and versatile 4-m long model Em4. With beads colored by size, you can see (and measure) the sorting and selective transport of sediments. You can tilt the table laterally – simulating differential uplift/subsidence across the basin. There’s even a groundwater feed and extraction system! This model is pretty much as cool as I can imagine – at least short of the big research flumes mentioned above.

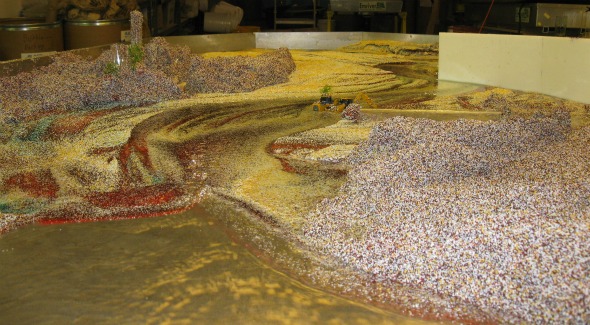
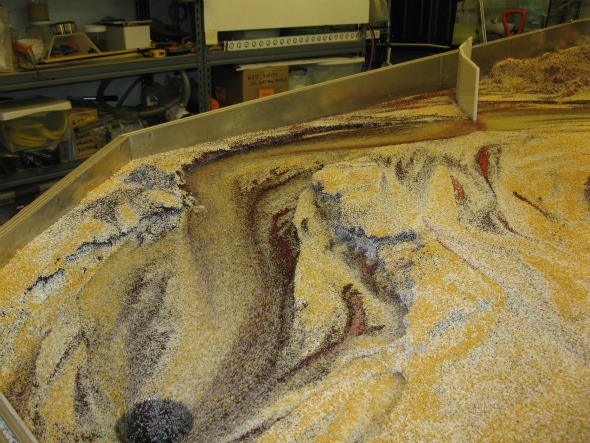
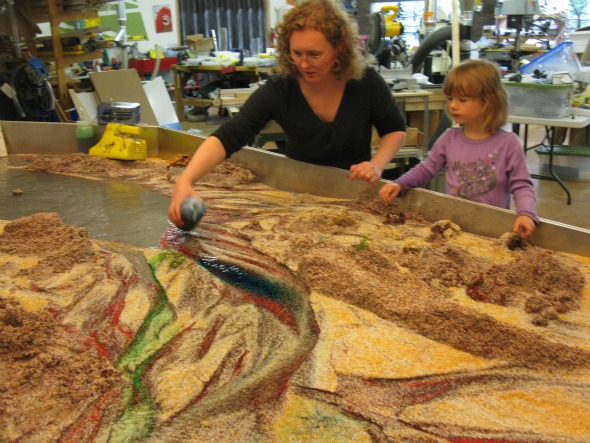
I can personally attest that this stream table model has the versatility to entrance both a PhD and a preschooler for more than two hours…and the preschooler wanted to go back the next day! Below I’ve added some shots of the Em4 in action. What geomorphic processes do you see?

Em4 looking downstream

Looking dowstream, I see a transition from "bedrock" to alluvial substrate, a really nice train of standing waves, meandering, a floodwall, and some sort of infrastructure project in the floodplain gone horribly wrong.

base level fall

A sudden base level fall is driving incision through an old delta. The dark red sediment is the finest grain size.

tracer test

Green dye was used to examine hyporheic flow transversely through a mid-channel bar. Now blue dye is being added to look for zones of in-channel transient storage.

Categories: by Anne, geomorphology, public science, science education

New at Erratics – Biofuels: What would you say you do here?

Will Dalen Rice finishes his series on the Advanced Biofuels Leadership Conference, by talking about the state of biofuels technology:

Although there is still significant future distance to travel, the technology had come a long way. The leader of the conference made some joking remarks about how the common technological aspects are glossed over as being something simple. “And as you see her on slide 6, we just took the bacteria and rearranged its genes so it would do what we want.” … After the Gulf oil spill, it seems like there is no limit to peril and damage, but then there was no other option. Now there I another choice, and making the oil ourselves is the new elegant solution, that will lead us into the future.


Read the rest of his post on Erratics.

Remember: Earth Science Erratics welcomes contributions from anyone who is tempted to dip their toes into the geoblogging waters, for one post or several, or from new bloggers who want to promote their work through cross-posting. If you’re interested, please contact us.

Categories: conferences, environment, links

Bacteria in the sky, making it rain, snow, and hail

A post by Anne Jefferson ResearchBlogging.org

Even though we all think of the freezing point of water as 0 °C, very pure water remains a liquid until about -40 °C. Water crystallizes to ice in the presence of tiny nucleation particles in the atmosphere. These particles can be sea spray, soot, dust … and bacteria.

Bacteria are particularly good at ice nucleation (IN), causing it to occur at temperatures as high as -2 °C. As Ed Yong described 3 years ago:

Ice-forming bacteria like Pseudomonas syringae rely on a unique protein that studs their surfaces. Appropriately known as ice-nucleating protein, its structure mimics the surface of an ice crystal. This structure acts as a template that forces neighbouring water molecules into a pattern which matches that of an ice lattice. By shepherding the molecules into place, the protein greatly lowers the amount of energy needed for ice crystals to start growing.

USDA photo of ice on flowers

Ice on fruit tree flowers. There because of bacteria? (USDA photo)

The fact that bacteria like P. syringae nucleate ice crystals has been known for decades. They can be used for gee-whiz science demonstrations, and, at a much larger scale, as one method for creating artificial snow. On the flip side, the presence of P. syringae is also also makes plants more likely to be frost damaged at temperatures just below freezing. Only in the last several years, though, has the role of bacteria in producing precipitation from the atmosphere begun to be appreciated.

First, Brent Christner and colleagues discovered that every freshly fallen snow sample they collected, even in Antarctica, contained these ice nucleating bacteria. In the resulting 2008 Science paper, they noted:

The samples analyzed were collected during seasons and in locations (e.g., Antarctica) devoid of deciduous plants, making it likely that the biological IN we observed were transported from long distances and maintained their ice-nucleating activity in the atmosphere…our results indicate that these particles are widely dispersed in the atmosphere, and, if present in clouds, they may have an important role in the initiation of ice formation, especially when minimum cloud temperatures are relatively warm.

Then researchers in the Amazon rainforest discovered that primary biological aerosol (PBA) particles, including plant fragments, fungal spores…and yes, bacteria, were a dominant contributor to ice nucleation in clouds above the rainforest. (Even the though the Earth surface is hot in the Amazon, high enough in the troposphere, it’s still below freezing.) As Pöschl and colleagues reported in Science in 2010:

Measurements and modeling of IN concentrations during AMAZE-08 suggest that ice formation in Amazon clouds at temperatures warmer than –25°C is dominated by PBA particles… Moreover, the supermicrometer particles can also act as “giant” [cloud condensation nuclei] CCN, generating large droplets and inducing warm rain without ice formation.

The latest contribution to the growing understanding of bacteria’s role in precipitation was recently presented at the American Society of Microbiology meeting. Alexander Michaud studied hailstones that fell on his Montana State University campus, and as reported by the BBC:

He analysed the hailstones’ multi-layer structure, finding that while their outer layers had relatively few bacteria, the cores contained high concentrations. “You have a high concentration of ‘culturable’ bacteria in the centres, on the order of thousands per millilitre of meltwater,” he told the meeting.

What all of this adds up to is that we now know that bacteria and other biological particles are prevalent in the atmosphere around the world and are stimulating multiple forms of precipitation. As a hydrologist, I think I can wrap my head around this. But what’s really wild is the feedback between biological productivity and precipitation and the possibility that the ice nucleating bacteria moving in the atmosphere may be an evolutionary trait.

Precipitation stimulated by ice nucleation above an ecosystem where the bacteria or other biological particles were emitted sustains the ecosystem that created those particles. As Pöschl et al write:

Accordingly, the Amazon Basin can be pictured as a biogeochemical reactor using the feedstock of plant and microbial emissions in combination with high water vapor, solar radiation, and photo-oxidant levels to produce [secondary organic aerosols] SOA and PBA particles (31, 32). The biogenic aerosol particles serve as nuclei for clouds and precipitation, sustaining the hydrological cycle and biological reproduction in the ecosystem.

Or, in discussion of the recent hailstone findings [from the BBC]:

Dr Christner, also present at the meeting, said the result was another in favour of the bio-precipitation idea – that the bacteria’s rise into clouds, stimulation of precipitation, and return to ground level may have evolved as a dispersal mechanism. … “We know that biology influences climate in some way, but directly in such a way as this is not only fascinating but also very important.”
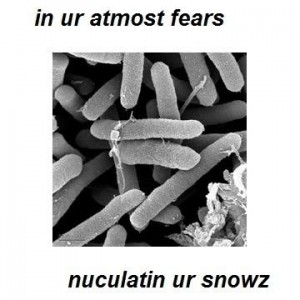
Tara Smith lolbacteria

and ur rainz and ur hailz (image created by Tara Smith on the Aetiology blog)

Christner, B., Morris, C., Foreman, C., Cai, R., & Sands, D. (2008). Ubiquity of Biological Ice Nucleators in Snowfall Science, 319 (5867), 1214-1214 DOI: 10.1126/science.1149757

Pöschl U, Martin ST, Sinha B, Chen Q, Gunthe SS, Huffman JA, Borrmann S, Farmer DK, Garland RM, Helas G, Jimenez JL, King SM, Manzi A, Mikhailov E, Pauliquevis T, Petters MD, Prenni AJ, Roldin P, Rose D, Schneider J, Su H, Zorn SR, Artaxo P, & Andreae MO (2010). Rainforest aerosols as biogenic nuclei of clouds and precipitation in the Amazon. Science (New York, N.Y.), 329 (5998), 1513-6 PMID: 20847268
Categories: by Anne, climate science, hydrology, paper reviews