Geological maps: still interesting even when there’s only one rock type

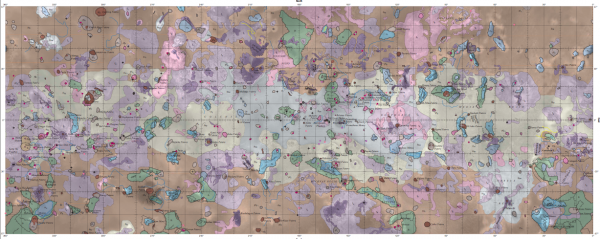
A post by Chris RowanThe USGS, in collaboration with NASA, have just released a geological map of Jupiter’s ultra-volcanically active moon Io, based on images from the Voyager and Galileo probes. It is a thing of beauty.

Geological Map of Io

Geological map of Io. Click to enlarge. Source: USGS

The sheer variety of different geological units that Io’s surface has been divided into is a little eye-opening, especially when you consider that the entire surface of the moon is constantly being resurfaced by the most active volcanoes in the solar system. How can there be so much variety when the whole surface is relatively young volcanic lava?

Volcanism on Io

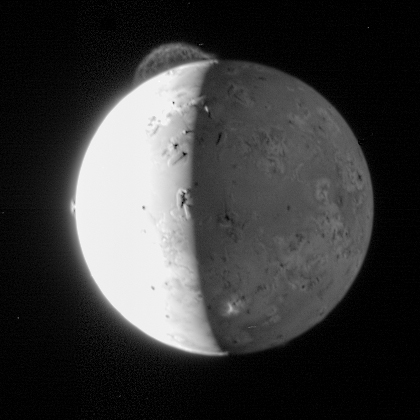
A volcanic eruption on Io captured by the New Horizons probe.

In fact, the answer is simple: there is so much variety because Io is so geologically active. Hundreds of volanoes are regularly producing individual lava flows, which cover and cut through older flows from the same vent, and other flows from neighbouring vents. Big eruptions dust the surrounding plains with ash. Crater walls collapse and produce debris flows. The surface is faulted and deformed as volcanic edifices are built on top of the crust and magma is extracted from beneath it.
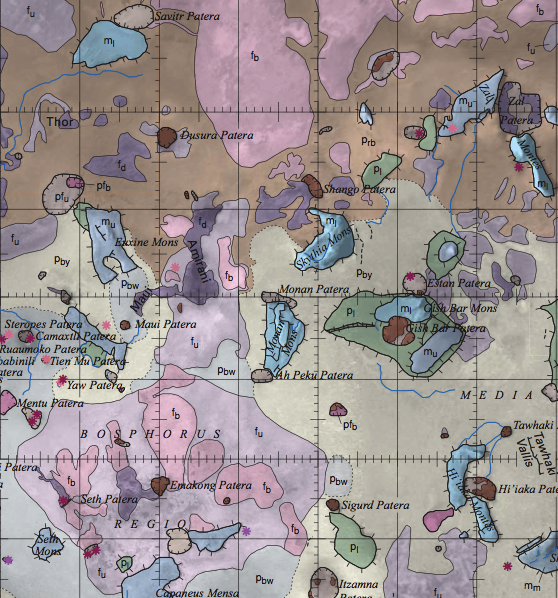
Geology of Io's northern hemisphere

Geological map of Io, zoomed in to part of Io's northern hemisphere. Different lava flows (f_), vents or patera (p_) and crustal blocks uplifted by tectonics (m_) have been distinguished and mapped as separate units. Source: USGS.

So, whilst two bits of rock on Io’s surface might be fairly similar in terms of their composition and mineralogy, they can be very different in terms of their history – how they have got where they are. For geologists, the concept of a ‘mappable unit’ basically boils down to ‘if you can reliably distinguish it, you can map it’, and rocks can just as easily be distinguished by the processes that deposited them, and the relative timing of those processes, as chemistry and mineral content. In the case of Io, for example, lava flows of different ages can be distinguished from each other based on their albedo, colour, and the way they cut across older units, and are themselves cut across in turn. They are thus mappable units, and can be assigned their own colours on a map.

Back on planet Earth, we can see similar principles at work on geological maps of volcanic islands like Hawaii. The whole of the Big Island is effectively made up of variations on a theme of basalt, but assigning it all into one unit would give you a boring – and uninformative – island-shaped blob of a single colour. But different lava flows can be individually mapped, and dated, and traced to different vents, allowing you to produce something a lot more interesting: a map that clearly depicts the rich volcanic history of the Big Island.
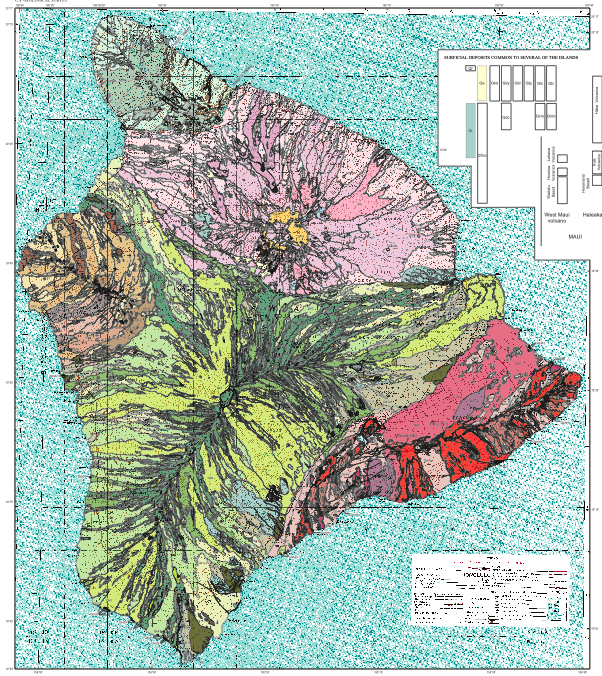
Geological map of the Big Island

Geological map of the Big Island, Hawaii. Not simply all basalt, but all sorts of different basalt. Source: USGS.

It’s not just volcanic rocks either. A single sandstone formation can be mapped as one unit, or divided into individual units representing the different pulses of sediment that have filled up a basin. Glacial tills formed in the last million years can be lumped together, or divided up into markers of the waxing and waning of the ice sheets.

In geology, the composition of a rock and the process that formed it are often intertwined; but even when the type of rock you’re looking at stays the same, the processes forming it can change and give you something entirely new, and distinct – and mappable.

Categories: geology, planets, volcanoes

Stuff we linked to on Twitter last week

A post by Chris RowanA post by Anne Jefferson

Other posts on All-geo

Earthquakes

Volcanoes

Planets

(Paleo)climate

Water

Environmental

General Geology

Interesting Miscellaney

Categories: links

Scenic Saturday: from desert to verdant grassland in 10 miles (and 1000 m)

A post by Chris RowanThis view up the south-western slopes of Kohala volcano on the Big Island of Hawaii is a study in climatic contrasts.

South-west flank of Kohala

Looking north-east towards the summit of Kohala volcano, Big Island, Hawaii. Photo: Chris Rowan, 2012.

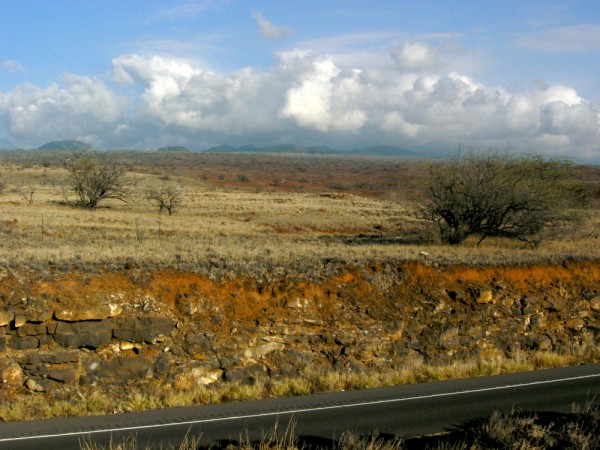
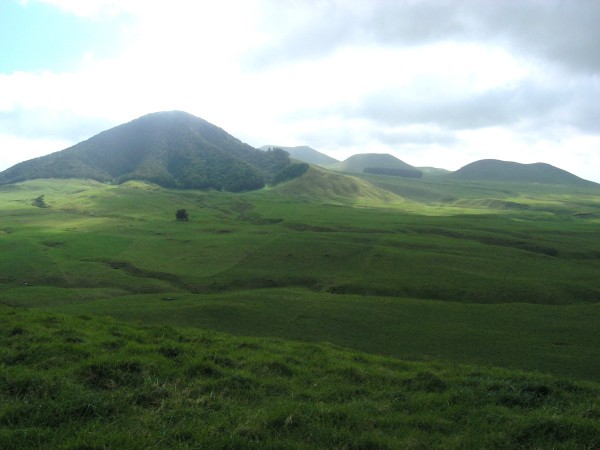
The ground that I’m standing on is dry, and clearly arid: the sparse and obviously parched vegetation suggests that this landscape sees very little rainfall most of the time. Yet at the very moment I took this photo, the top of Kohala itself is wreathed in storm clouds. When we visited the summit earlier in the day, the weather was fortunately a little more amenable, but the green, green grass and the forests on the summits of the cinder cones show that it is no stranger to precipitation.

Kohala Cinder Cones

Cinder cones on the summit of Kohala, Big Island, Hawaii. Photo: Chris Rowan, 2012.

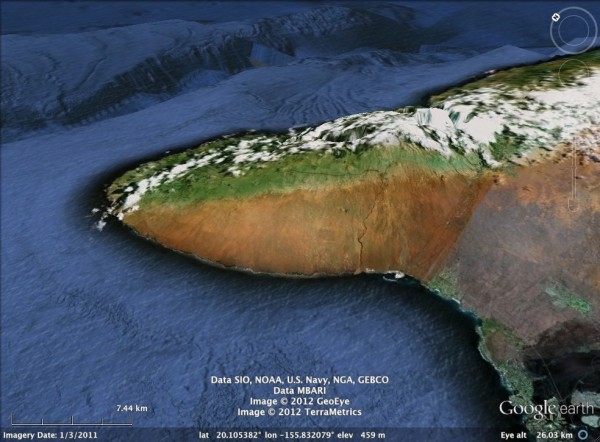
From altitude, the contrast between the lower and upper slopes is even more striking.

Perspective view of Kohala from the southwest.

Kohala viewed from the southwest in Google Earth. Note the sharp change in colour/vegetation.

This is all caused by Hawaii’s position in the midst of the northern hemisphere’s trade winds, which blow moist air against the north-east slopes of all the Hawaiian islands.
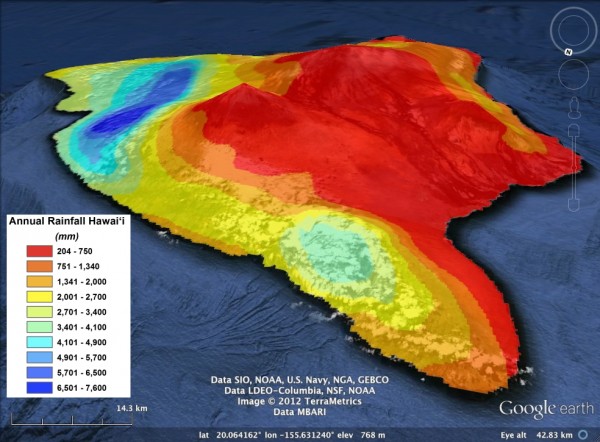
Forced upwards on the other side of Kohala, the air cools, condenses into clouds and rains out all of its moisture as it crosses the summit, created a dry rain shadow on the south-west slope. This orographic precipitation, or “relief rain”, is hardly unique to Hawaii, but the combination of a very tall volcanic mountain, isolated in the middle of an ocean, and fairly constant wind patterns do mean that on the Big Island and other ocean islands experience very large changes in rainfall over exceedingly short distances. From where I was standing, it was less than 10 miles to the other side of Kohala as the crow flies, but along that line the average annual rainfall increases 20-fold (up to 4 metres, compared to 20 cm or less).

Mean annual rainfall for the Big Island.

Mean annual rainfall for the Big Island. Perspective view from the north: Kohala is the promontory in the right foreground. Google Earth overlay from the Rainfall Atlas of Hawaii (http://rainfall.geography.hawaii.edu/)

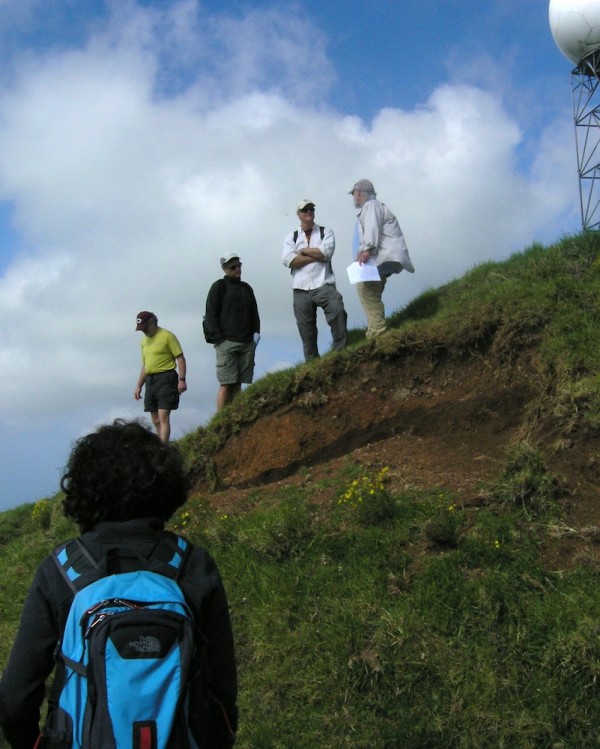
The people who guided our trip around Kohala are interested in how these large variations in rainfall affect the development of the volcanic landscape. One obvious effect is on the rate of soil development. The lava in this roadcut is probably around 100,000 years old, and whilst weathering in the dry conditions here has produced some top-soil, it’s fairly thin – perhaps a metre or so. Up near the summit, more rainfall has led to a lot more soil.

Soil on the summit of Kohala

Thick soil horizon revealed by a slump on the summit of Kohala, Big Island, Hawaii. Photo: Chris Rowan, 2012.

It’s easy to see why you can get some pretty cool science done in a place with high climatic variability and an easily datable landscape. It’s relatively straightforward to trace a lava flow across many different climatic zones, and since you know that the composition of the initial bedrock and the elapsed time are the same, any changes you observe in processes like soil development will be almost entirely be due to differences in rainfall. It’s rarely so easy to untangle all of these variables. I guess this is why our trip guides endure the extreme hardship of a field season on Hawaii: it gives them the rare opportunity to do fieldwork with good experimental controls. Yes, that must be the reason…

Categories: geomorphology, outcrops, photos, volcanoes

The humbling legacy of the Tohoku earthquake

A post by Chris RowanA year ago on Sunday, one of the biggest earthquakes ever recorded ruptured the subduction megathrust that dips beneath the east coast of Japan. The rupture displaced the seafloor by tens of metres and generated tsunami waves up to 20 metres high, which hit the coast less than an hour later with devastating effect. My abiding memory of the morning I woke up to news of the earthquake, other than the near-constant pinging of my iPhone with alerts for all the aftershocks, is watching a helicopter video of the tsunami, having overwhelmed any coastal defenses, rushing across the Japanese countryside, sweeping away everything in its path. It was hard to believe wasn’t just something generated in a computer for a new disaster movie.

http://youtu.be/J2hUwFo6Vpc

There were 19,000 casualties, with an additional 3,155 people still listed as missing; more than 370,000 buildings were destroyed or damaged; 300,000 people are still homeless. The estimated total cost to the Japanese economy is more than 300 billion US dollars. All this in a country that is well aware of its violent seismic history, and has taken the risk of future large earthquakes very seriously indeed. This investment was not in vain: compare the casualties and damage caused by the Tohuku event to the magnitude 9.2 Sumatra–Andaman earthquake on Boxing Day 2004, and the resulting tsunami that killed 230,000 people; or the much, much smaller magnitude 7 earthquake that struck Haiti in January 2010 and killed over 300,000. Japan’s strict building codes, sea walls, warning systems and preparedness drills were surely mostly responsible for this order-of-magnitude difference, and yet it still wasn’t enough. That is a humbling reminder of how even our most advanced societies are still at the mercy of the planet we occupy.

But the Tohuku earthquake has handed earth scientists an even more humbling lesson. One reason that the tsunami overwhelmed Japan’s coastal defences so thoroughly is that it met seawalls whose designers had underestimated how big a wave they might have to repel; an underestimate that was based on our faulty understanding of how big faults actually behave. Here’s how we thought it worked: long plate boundary faults such as the subduction megathrust beneath Japan could be divided into discrete segments that behaved quasi-independently. Each segment produced earthquakes of a characteristic size with a characteristic average repeat time, although an earthquake on one segment could affect the timing of rupture on its neighbours due to changes in the local stress.

This understanding was based on our instrumental and historical records of earthquake activity. These records have relatively short durations compared to the timescales of strain build up and release on large faults, so we’ve always known that extrapolating recent behavour over longer time periods might not give us the full picture. But what Tohoku and other recent megaquakes have shown is that it’s not just parameters such as the length of the earthquake cycle on individual segments that can vary over longer timescales, but the nature of the segmentation itself. The really big earthquakes seem to be cases where several segments of a fault all rupture in concert; even more disconcerting is the fact that magnitude 7 and 8 earthquakes every few decades or centuries along a particular stretch of the subduction zone does not rule out a magnitude 9 occuring in the same region every couple of millenia. Rather than being a simple saw-tooth wave of slow strain build-up and rapid release, we’re starting to see that faults sing a much more complex song, with a number of different frequencies mixed in. For most of the time we’ve been recording earthquakes, we’ve been hearing the high notes; we’re only now becoming aware of the base line – the longer earthquake cycles that govern larger, more potentially catastrophic ruptures.

The past decade has been full of rude surprises for geologists: starting with the 2004 magnitude 9.2 Sumatra–Andaman earthquake, the earth has rung with the vibrations of 5 quakes of magnitude 8.5 or greater. As Thorne Lay puts it in this week’s Nature, The Tohuku earthquake is just the most recent in this sequence, all of which “have violated some theories of where and when great earthquakes can occur and what their consequences can be.” We’re starting to realise that there is a lot more tectonic and seismic complexity than we thought in the space between the smooth motion of plates over million-year timescales and the jerky motion of faults over decades, centuries and millennia, and that looking at the long-term behaviour of dangerous faults using tools like paleoseismology (which had uncovered evidence of past events that were similar in scale to last years tsunami, even before it happened) is just as important as measuring contemporary deformation using GPS.

But the most important lesson is this: that no matter how much we think we know, our planet still has an infinite capacity to surprise us.

Categories: earthquakes, geohazards, tectonics

Stuff we linked to on Twitter last week

A post by Chris RowanA post by Anne Jefferson

Other posts on All-geo

Anniversary of the Tohuku Earthquake

It is one year today since a magnitude 9.0 earthquake and accompanying tsunami devastated the east coast of Japan, prompting many stories about the event and its aftermath.

Volcanoes

Environmental

Water

Planets

General Geology

Interesting Miscellaney

Categories: links