The pulse of the Earth’s surface

A post by Chris RowanOn the Earth, matter is always in motion. We all learn about the water cycle at school – the fact that, thanks to energy from the sun, and the Earth’s surface being in a temperature range where water can exist in its solid, liquid and gaseous forms, H2O is continuously shuttled from oceans to atmosphere to land and back into the oceans via rivers again. Put simply, the Earth consists of a series of connected boxes full of varying levels of stuff (we normally refer to them as ‘reservoirs’, because it sounds more science-y that way) that is continuously being shunted around from one box to another. The speed at which an individual piece of stuff – water, carbon, nitrogen, and a panoply of other elements and compounds – moves between different boxes can be pretty rapid, but in a complicated system like the Earth, the total amount of stuff in each box often reaches an uneasy balance – despite all the movement and activity, the amount of stuff in each box remains fairly constant, giving the appearance of stability despite all the furious activity behind the scenes*. But this balance can be altered: change one of these fluxes, even a little bit, and all of the boxes may end up filling or emptying to a different state. As geologists we are generally interested in longer term changes, but the most obvious example of this is the seasons: reduce the amount of solar energy reaching the ground in the Northern hemisphere, and more water vapour and water becomes ice. Carbon is also shunted between the ground and the atmosphere as plants grow and prosper in the spring and summer, and then die or go dormant in the autumn and winter: this is what causes the sawtooth pattern superimposed on the worrisome upward trend of atmospheric CO2 concentrations.

The Keeling Curve

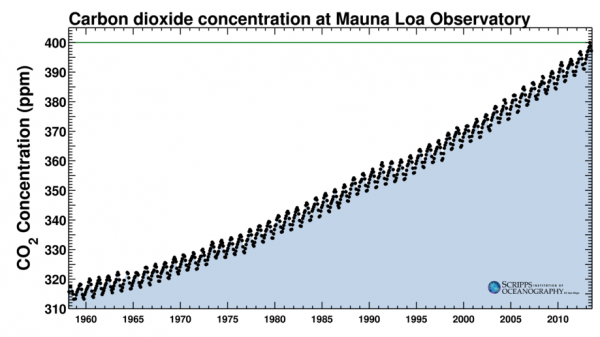
Atmospheric CO2 concentrations measured at the Mauna Loa Observatory since 1958.

But you don’t just have to take my, or a dry old graph’s, word for it: now, thanks to the latest NASA cloud-free satellite imagery, you can see it. And its mesmerising.

Click to access large versions at John Nelson's blog. You won't regret it.

Click to access large versions. You won’t regret it.

This animation comes courtesy of John Nelson (who seems to have a talent for awesome geological visualisations). His post is titled ‘The Breathing Earth’, and its easy to see why. The waxing and waning of the ice sheets is impressive, but I’m just as fascinated with the physical manifestation of that seasonal sawtooth in the Keeling Curve – patches of green vegetation waxing, waning, and migrating in time with the seasons. I strongly suggest finding a large monitor and loading up one of the large versions of these images available on John’s site. It’s a visual and intellectual treat.

*this is known as ‘dynamic equilibrium‘ or ‘steady-state’, also a feature of many of the more interesting chemical reactions.

Categories: geology, links

Reflecting on Teaching Urban Hydrology

A post by Anne JeffersonI was hired as part of a cluster hire focused on urban ecosystems at Kent State University, and while my research has a significant urban component to it, I had not taught an urban-focused class… until this past semester, when I created a new class in Urban Hydrology. Urban hydrology is a fascinating and relevant topic, but its not part of the standard curriculum for geology students in the US. Where urban hydrology is typically taught is at the graduate level to civil engineering students, and follows on courses on hydraulics, fluid mechanics, etc. Thus, the content and approach taken in civil engineering Urban Hydro classes was not quite what I wanted for the senior geology majors and graduate students in my class, most of whom had no experience with hydrology before arriving in my classroom. This class was my first full course taught at Kent State, so it was a big semester of learning about the students here and how to effectively teach to them. While I think my students learned a lot in my class, I can say with some confidence that I learned just as much from the experience of teaching a new topic to a new audience.

At the beginning of my course planning, I set four learning objectives for the students:

  1. Understand the natural and human factors that regulate hydrologic processes in urban areas
  2. Evaluate watershed land use changes and associated hydrologic impacts
  3. Describe methods to mitigate the effects of urbanization on aquatic systems
  4. Analyze the scientific literature on urban aquatic systems and discuss the approaches and main conclusions with fellow scientists and the public

Upon reflection, the first two objectives have some significant overlap, though “evaluation” requires a different set of skills than “understanding.” These two objectives were the primary focus of the first half of the semester, in which I introduced students to the concepts of watersheds, water budgets, and hydrographs, and had them work through the USDA NRCS handbook TR-55 “Urban Hydrology for Small Watersheds” (pdf link) with a real example from the Cleveland metropolitan area. Overall I’m very happy with how this part of the course went, because I took students from not knowing how to define a watershed given a topographic map to being able to solve an applied hydrologic problem in an urban setting.

The first half of the course could also be summed up as “how we got to where we are today in urban watersheds,” and my goal for the second half was to help students understand “where do we go from here.” This is where objectives 3 and 4 came into greater play. We talked about principles and practices of stormwater control and low impact development, stream restoration, solving the legacy problem of combined sewer overflows, and attempts at watershed-scale approaches to reducing stormwater inputs to streams. I organized two optional field trips – one to look at stream restoration and dam removal sites in Kent (with help from the Ohio EPA) and surrounding towns and one lead by Cleveland Metroparks to look at stormwater BMPs and stream restoration in the West Creek watershed in Parma. The culminating project for this half of the class was the design of rain garden. While I’m reasonably happy with how this half of the class went, there are some tweaks I’d like to make for the future. I need to tie the topics covered in the second half of the semester into a more cohesive unit, and I need to rethink my fourth learning objective (re: scientific literature), because I didn’t do as a good of a job as I would like with implementing it. We certainly read quite a number of papers, and they wrote reflective essays about them, but the discussion with the public part didn’t happen.

I’m quite pleased with the final project though. In many neighborhoods, this rainfall that lands on a rooftop is delivered to driveways, streets, or pipes that lead to the storm sewer network and straight to streams. The goal of rain gardens is to “disconnect” the rooftop and treat the water on-site, returning the hydrology to a more natural state. The class worked in teams of three as competing consulting firms angling for a design-build contract on the rain garden. They had to survey the site to quantify impervious surface, soil characteristics, and lot and topographic limitations. Then using a variety of resources that they’d identified for rain garden design and construction, the teams developed plans that detailed size, position, soil characteristics, and planting for the rain garden. On the last day of class they presented their designs to each other. I didn’t actually ask the students to construct the rain garden (that’s something Chris and I have taken on over the summer, since it is in our front yard), but several have asked how the process is going. (I may post some pre-, syn- and post-project pictures later.)

I also had students participate in water quality data collection and analysis for the Cuyahoga River in Kent. I think this was a very valuable way for the students to gain a small amount of experience with hydrologic data from hypothesis generation and testing, to quality control of field measurements, to putting their results in the context of the literature. I’d like to keep a version of this project in future iterations of the course, but I want to tie it more explicitly into the course objectives.

I’m not likely to teach the course again for at least two years, but I’m hopeful that I can build off of what I did last spring to create an even better Urban Hydrology class at Kent State. In the meantime, almost all course materials can be found on my website, which I hope will be a resource for other people interesting in learning more about this fascinating and important field of hydrology.

Categories: by Anne, hydrology, teaching

GeoKid goes to the zoo with her cousins

Mom’s note: A family trip to the zoo inspired these GeoKids reflections on animal classifications and families. As a parent scientist, my proudest moment was when GeoKid excitedly told her cousin, “That’s an orangutan. It’s our cousin.”

A post by Geo KidOn July 25th, I went to the Colchester zoo.

I really like red pandas because I like that they are red and it was awesome to see them at the zoo. In this picture you will see them sleeping at the zoo. First, scientists put red pandas in the bear family, and then they were put in the racoon family. Then, were put in their own family. The red pandas were originally discovered before the giant pandas. Red pandas eat bamboo like the giant panda. The red pandas can have one to four babies.

Red pandas sleeping on a beam.

Komodo dragons aren’t really dragons. In this picture, when I’m at the zoo, I’m next to the statue of the Komodo dragon, which was made to show how big they can get. Komodo dragons lay 15-30 eggs. When we looked at them, the one Komodo dragon was staring at us. It was sitting on the window sill. I think it was sitting there to examine us. Komodo dragons are the biggest type of lizard.

GeoKid with Komodo for scale.

GeoKid with Komodo for scale.

Red pandas are mammals and Komodo dragons are lizards. At the zoo!

Categories: by Geokid

A land of basalt and chalk

A post by Chris RowanWe’ve just spent a great week exploring Ireland, which included very sunny days on the Antrim Coast of Northern Ireland. Anne sometimes teases me for picking holiday itineraries based more on the the prevailing geology more than the prevailing weather, and I can’t deny that our choice of locations may possibly have been influenced ever-so-slightly by the close proximity to the Giant’s Causeway, which I have tried to visit before. Fortunately, the weather was a lot more co-operative this time: and despite the large crowds and a very ugly visitor centre (the only redeeming virtue of which is that you can’t see it from the Causeway itself), it is definitely a very impressive geological feature (for all these photos, you can click through to larger versions).

The Giant's Causeway, Northern Ireland. Photo: Chris Rowan, 2013

The Giant’s Causeway, Northern Ireland. Photo: Chris Rowan, 2013.

There are many places in the world where you can see columnar basalts from the side, in cliffs and the sides of valleys and gorges; what makes the Giant’s Causeway so special is that the erosive power of the sea has created a Escher-like landscape where you can scramble over and between them. The key to understanding the eerie geometry of tens of thousands of hexagonal and pentagonal columns of volcanic rock, all stacked together, is realising that ‘stacked together’ is the wrong way to think about it; the columns formed after the basaltic lava flow was emplaced over the landscape, due to cooling, shrinkage and cracking, their spacing and shape controlled by the constant, regular physical laws that control heat transport.

A panorama looking out to sea across the Giant's Causeway, Northern Ireland.  Photo: Chris Rowan, 2013

A panorama looking out to sea across the Giant’s Causeway, Northern Ireland. Photo: Chris Rowan, 2013.

The Giant's Causeway from above.  Photo: Chris Rowan, 2013

The Giant’s Causeway from above. Photo: Chris Rowan, 2013.

The flow that formed the Causeway is but one small part of the extensive volcanic episode 50-60 million years ago that accompanied the opening of the North Atlantic; lavas and intrusive rocks of a similar age can be found all along the coast in Northern Ireland, and up through the western coastal region of Scotland. Later-erupted lava flows can be seen in the cliffs above the causeway, sometimes with their own impressive columns. At ‘the Organ’, you can even see a lovely example of a transition from the slow cooling interior of the flow, where columnar joints eventually formed, into the fast-cooling top.

'The Organ', a cliff exposure of columnar basalts near the Giant's Causeway.  Photo: Chris Rowan, 2013

‘The Organ’, a cliff exposure of columnar basalts near the Giant’s Causeway. Photo: Chris Rowan, 2013.

A close-up of 'The Organ', showing how the regular columnar jointing vanishes in the fast-cooling top of a lava flow.  Photo: Chris Rowan, 2013

A close-up of ‘The Organ’, showing how the regular columnar jointing vanishes in the fast-cooling top of a lava flow. Photo: Chris Rowan, 2013.

The other prominent feature in the cliffs above the Causeway is the red horizon about half-way up, which marks a laterite, a soil rich in iron and aluminium oxides formed by a long-period of weathering of lavas between successive eruptions.

Giant's Causeway in the foreground, cliffs of more lava punctuated by a red laterite horizon beyond.  Photo: Chris Rowan, 2013

Giant’s Causeway in the foreground, cliffs of more lava punctuated by a red laterite horizon beyond. Photo: Chris Rowan, 2013.

A close-up of the laterite horizon in the cliffs above the Giant's causeway, formed by intense weathering of the top of a lava flow before the next eruption.  Photo: Chris Rowan, 2013

A close-up of the laterite horizon in the cliffs above the Giant’s causeway, formed by intense weathering of the top of a lava flow before the next eruption. Photo: Chris Rowan, 2013.

Grey and red banding shows leaching and oxidation of iron minerals during weathering. 50 pence piece for scale at top.  Photo: Chris Rowan, 2013

Grey and red banding shows leaching and oxidation of iron minerals during weathering. 50 pence piece for scale at top. Photo: Chris Rowan, 2013.

Exploring further afield, all that basalt had to be intruded through and erupted over something, and in places along the coast you can see that sometimes, that something is chalk, the same stuff – lithologically and stratigraphically – that forms the White Cliffs of Dover in southeast England. Black lava cutting through or lying on top of white chalk leads to some of the most easy-to-discern geological contacts I’ve ever seen. Can you spot the chalk-basalt contact here?

Basalt on top of chalk, Carrack-a-rede, Northern Ireland.  Photo: Chris Rowan, 2013

Basalt on top of chalk, Carrack-a-rede, Northern Ireland. Photo: Chris Rowan, 2013.

How about here? I took several photos on this ferry trip over to Rathlin Island which may well make it into my Intro Geology lectures…

An early Cenozoic lava flow on top of Cretaceous chalk, near Ballycastle, Northern Ireland.  Photo: Chris Rowan, 2013

An early Cenozoic lava flow on top of Cretaceous chalk, near Ballycastle, Northern Ireland. Photo: Chris Rowan, 2013.

The unique geology of this area has also clearly shaped its inhabitants, both human and non-human, and how they live. The steep cliffs meant that overland travel was difficult (even today, some of the roads are a little terrifying to drive), meaning that it was often be easier to sail the 15 miles to Scotland (I was surprised how close we were to Islay) than drive a cart to the nearest big Irish town. But the cliffs have also provided sanctuary for hundreds of thousands of nesting seabirds, especially on Rathlin Island.

Sea stacks on the west side of Rathlin Ireland - basalt with a veneer of guano. Photo: Christ Rowan, 2013.

Seastacks on the west side of Rathlin Ireland – basalt with a veneer of guano. Photo: Christ Rowan, 2013.

All those little dots? Nesting seabirds, by the tens and hundreds of thousands. Photo: Chris Rowan, 2013

All those little dots? Nesting seabirds, by the tens and hundreds of thousands. Photo: Chris Rowan, 2013

Basalt, chalk and the flint nodules within it have all been well-utilised as building material, depending on what was easiest to hand.

Drystone wall with columnar basalt blocks, near the Giant's Causeway. Photo: Chris Rowan, 2013

Drystone wall with columnar basalt blocks, near the Giant’s Causeway. Photo: Chris Rowan, 2013

Drywall of mostly chalk on Rathlin Island. Photo: Chris Rowan, 2013.

Drywall of mostly chalk on Rathlin Island. Photo: Chris Rowan, 2013.

So, I may get teased about my alleged geological bias in trip-planning, but as far as I can tell, it seems to work pretty well!

Categories: outcrops, photos, rocks & minerals, structures, volcanoes

To England: transit travails and a historical interlude

A post by Anne Jefferson

http://storify.com/highlyanne/transit-travails-and-a-historical-interlude

Categories: by Anne, outcrops, photos