![]() A slightly different Scenic Saturday this weekend, as we celebrate an important milestone in geological science: a look at the South Pacific through a geophysical lens.
A slightly different Scenic Saturday this weekend, as we celebrate an important milestone in geological science: a look at the South Pacific through a geophysical lens.
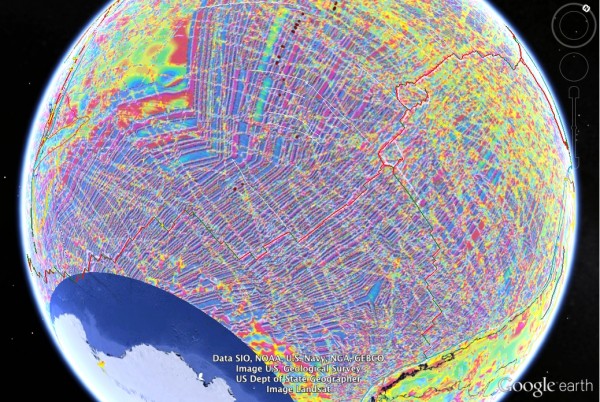
Magnetic anomalies in the South Pacific: part of the World Magnetic Anomaly Map, via a Useful KML file from San Diego State University
The colours on this map show fluctuations in the Earth’s magnetic field produced by strongly magnetised bits of the Earth’s crust: reds and purples show where the crust is magnetised in the same direction as the current magnetic field, and give it a bit of a boost: blues show where it is magnetised in the opposite direction, and cancel some of it out.
You can’t miss that when viewed through magnetic eyes, the Earth’s ocean basins are distinctly stripy. When geophysicists first started mapping the seafloor in earnest with sonar and magnetometers in the 1950s, the only thing more surprising than the discovery of a 60,000 km linear chain of mountains running through the middle of most oceans was the long linear areas of positively and negatively magnetised crust that paralleled the trend of these mid-ocean ridges. But 50 years ago today, a paper was published in Nature that purported to explain this grand geophysical mystery. Fred Vine and Drummond Matthews thought through the consequences of the hypothesis put forward by Harry Hess, that new oceanic crust was being continuously produced by the eruption of basalt at mid-ocean ridges. When combined with the facts that newly cooled basalt has a strong remanent magnetisation aligned with the ambient magnetic field, and that the Earth’s magnetic field reverses its polarity every million years or so. Vine and Matthews* argued that if seafloor spreading was indeed occurring at mid-ocean ridges, then linear positive and negative magnetic anomalies, formed from crust produced in normal and reversed polarity chrons, would form a symmetric pattern around the mid-ocean ridges, which is exactly what we see.
Despite some of the coverage in the past few days, the publication of the Vine and Matthews paper does not really mark the “birth of plate tectonics”. No scientific revolution really happens overnight; you will never see a scientific community collectively double-take and say, ‘Doh! That’s so obvious! Why didn’t I realise that before?!’. This is just one step on a journey that started before even Alfred Wegner’s theory of continental drift, and continued into at least the late 1960s, when the idea of rigid plates was formalised, and even the 1970s, when the wider geological community finally took notice of what those crazy marine geophysicists were up to. For the full story – told far better than I ever could – read this great piece by Naomi Oreskes. Nonetheless, publication of the Vine and Matthews paper was an important milestone in the development of plate tectonics, because it demonstrated how an observation that was very hard to explain without invoking plate tectonic processes became very easy to explain if you did; and it is that sort of achievement that makes other scientists start to take notice of an upstart new theory.
I’ve therefore taken to thinking of this week as marking 50 years since the turning of the tide. Last night, I applied a bit of geonerdery in the kitchen and created a commemorative pie crust to mark this anniversary.
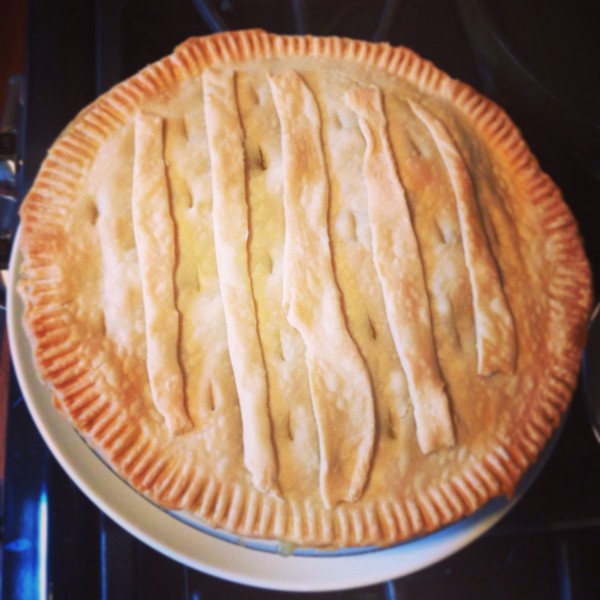
Anomalies on a (pie) crust.
Perhaps not quite as pretty as an ocean magnetic anomaly map; but much more tasty.
*Vine and Matthews share the credit with Lawrence Morley, who came up with the same explanation but was less successful in getting it published.