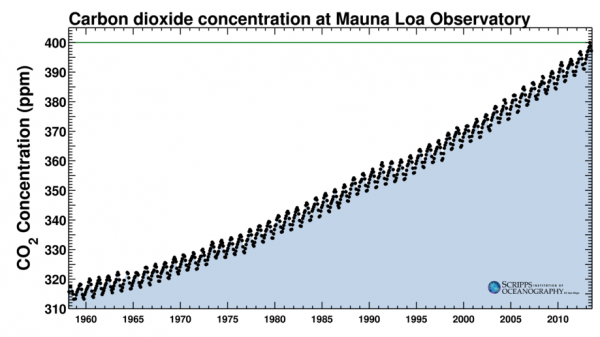
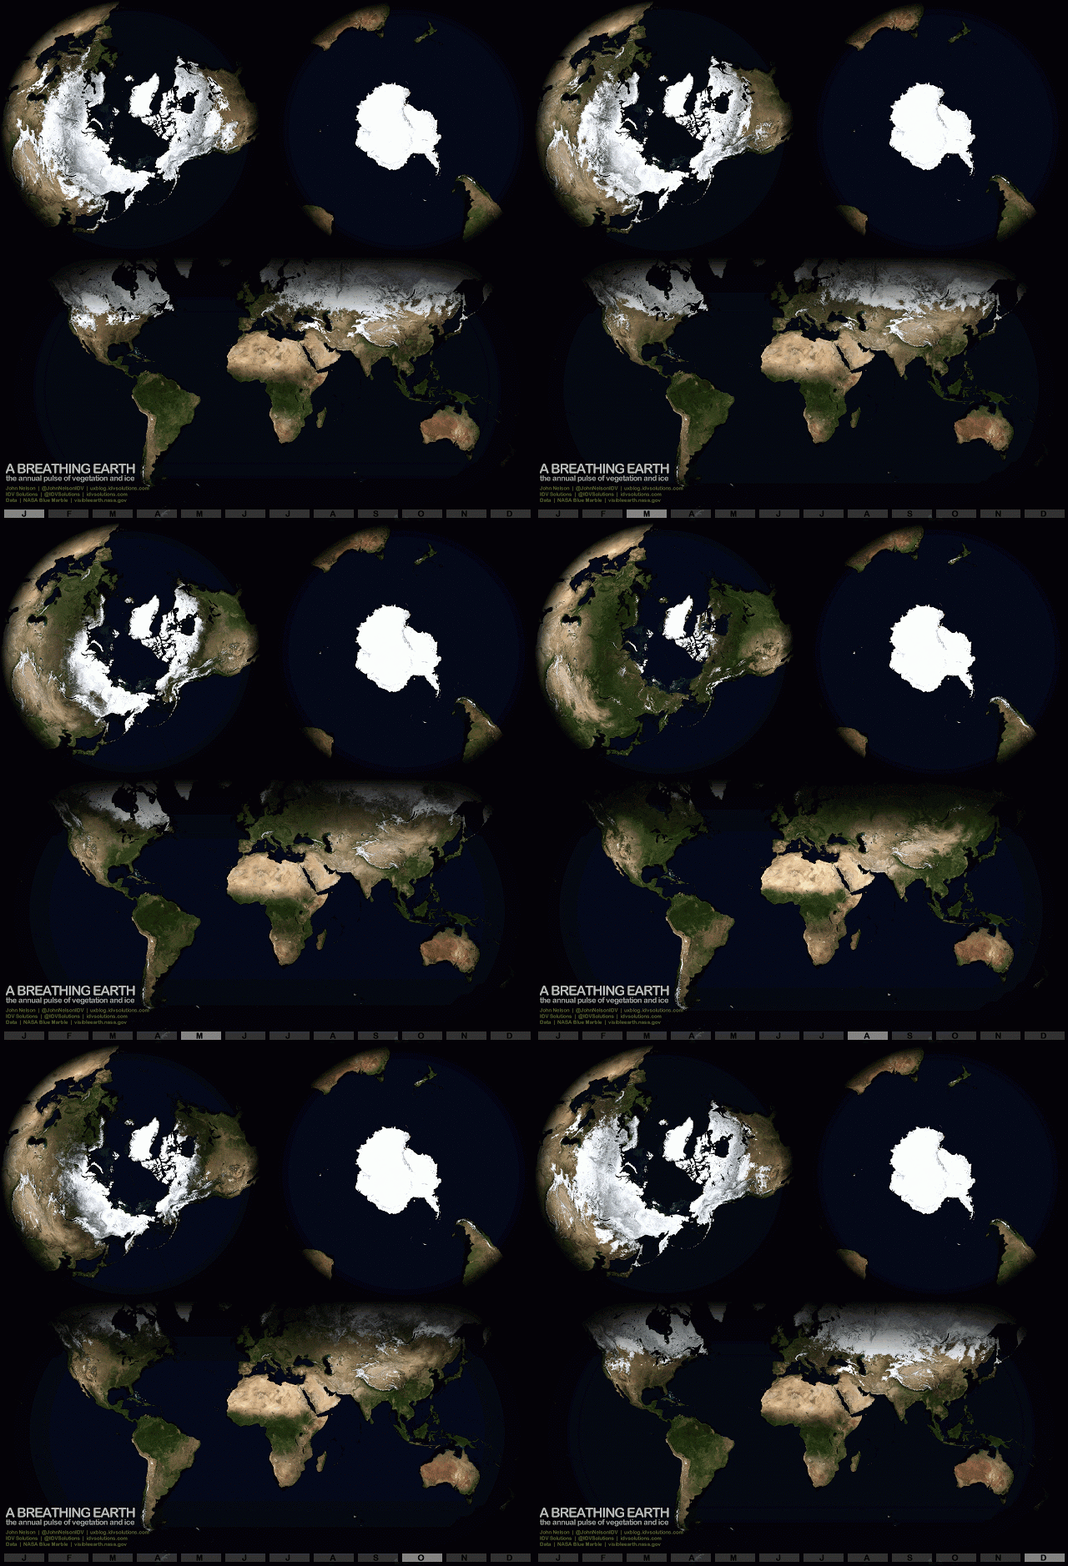
![]() On the Earth, matter is always in motion. We all learn about the water cycle at school – the fact that, thanks to energy from the sun, and the Earth’s surface being in a temperature range where water can exist in its solid, liquid and gaseous forms, H2O is continuously shuttled from oceans to atmosphere to land and back into the oceans via rivers again. Put simply, the Earth consists of a series of connected boxes full of varying levels of stuff (we normally refer to them as ‘reservoirs’, because it sounds more science-y that way) that is continuously being shunted around from one box to another. The speed at which an individual piece of stuff – water, carbon, nitrogen, and a panoply of other elements and compounds – moves between different boxes can be pretty rapid, but in a complicated system like the Earth, the total amount of stuff in each box often reaches an uneasy balance – despite all the movement and activity, the amount of stuff in each box remains fairly constant, giving the appearance of stability despite all the furious activity behind the scenes*. But this balance can be altered: change one of these fluxes, even a little bit, and all of the boxes may end up filling or emptying to a different state. As geologists we are generally interested in longer term changes, but the most obvious example of this is the seasons: reduce the amount of solar energy reaching the ground in the Northern hemisphere, and more water vapour and water becomes ice. Carbon is also shunted between the ground and the atmosphere as plants grow and prosper in the spring and summer, and then die or go dormant in the autumn and winter: this is what causes the sawtooth pattern superimposed on the worrisome upward trend of atmospheric CO2 concentrations.
On the Earth, matter is always in motion. We all learn about the water cycle at school – the fact that, thanks to energy from the sun, and the Earth’s surface being in a temperature range where water can exist in its solid, liquid and gaseous forms, H2O is continuously shuttled from oceans to atmosphere to land and back into the oceans via rivers again. Put simply, the Earth consists of a series of connected boxes full of varying levels of stuff (we normally refer to them as ‘reservoirs’, because it sounds more science-y that way) that is continuously being shunted around from one box to another. The speed at which an individual piece of stuff – water, carbon, nitrogen, and a panoply of other elements and compounds – moves between different boxes can be pretty rapid, but in a complicated system like the Earth, the total amount of stuff in each box often reaches an uneasy balance – despite all the movement and activity, the amount of stuff in each box remains fairly constant, giving the appearance of stability despite all the furious activity behind the scenes*. But this balance can be altered: change one of these fluxes, even a little bit, and all of the boxes may end up filling or emptying to a different state. As geologists we are generally interested in longer term changes, but the most obvious example of this is the seasons: reduce the amount of solar energy reaching the ground in the Northern hemisphere, and more water vapour and water becomes ice. Carbon is also shunted between the ground and the atmosphere as plants grow and prosper in the spring and summer, and then die or go dormant in the autumn and winter: this is what causes the sawtooth pattern superimposed on the worrisome upward trend of atmospheric CO2 concentrations.
But you don’t just have to take my, or a dry old graph’s, word for it: now, thanks to the latest NASA cloud-free satellite imagery, you can see it. And its mesmerising.
This animation comes courtesy of John Nelson (who seems to have a talent for awesome geological visualisations). His post is titled ‘The Breathing Earth’, and its easy to see why. The waxing and waning of the ice sheets is impressive, but I’m just as fascinated with the physical manifestation of that seasonal sawtooth in the Keeling Curve – patches of green vegetation waxing, waning, and migrating in time with the seasons. I strongly suggest finding a large monitor and loading up one of the large versions of these images available on John’s site. It’s a visual and intellectual treat.
*this is known as ‘dynamic equilibrium‘ or ‘steady-state’, also a feature of many of the more interesting chemical reactions.


Nice plan for content warnings on Mastodon and the Fediverse. Now you need a Mastodon/Fediverse button on this blog.