
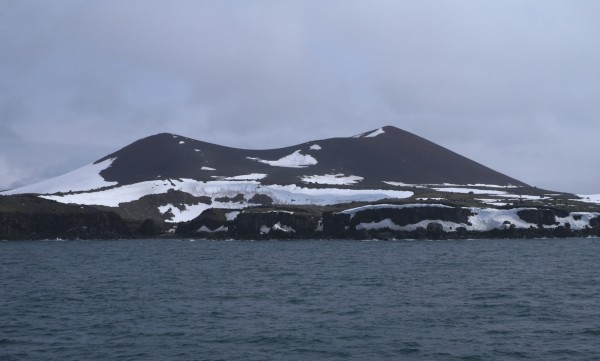
You can tell a trip is going to be pretty special when not only was the site of our first landing in Antarctica called Penguin Island – and we were given reason to believe it was not misnamed – but it was also very obviously a volcano.
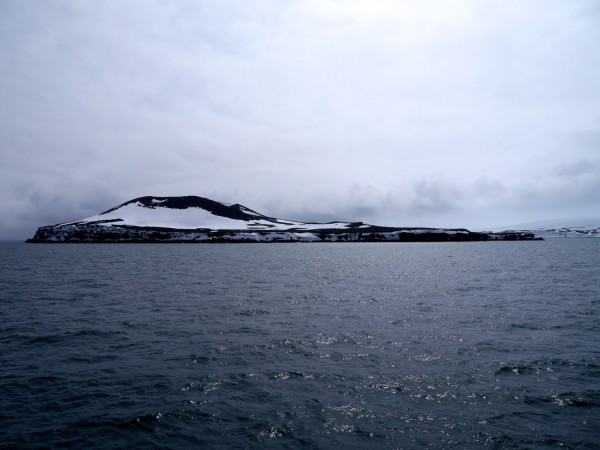
Penguin Island, South Shetland Islands. Basaltic lava flows topped by a scoria cone. Photo: Chris Rowan, 2013
There certainly were penguins, and they were certainly fascinating:
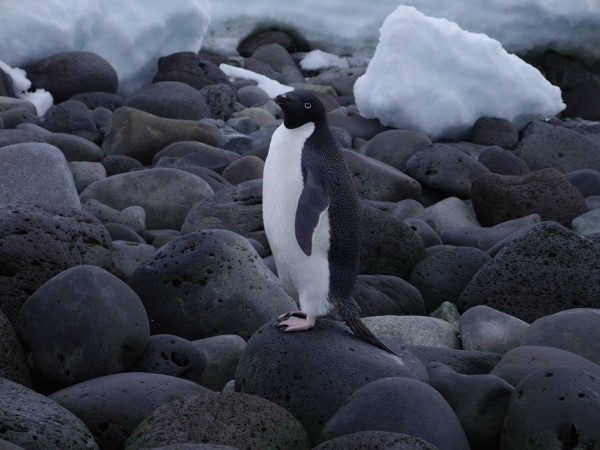
An Adelie Penguin atop a rounded basalt boulder on the shore of Penguin Island. Photo: Chris Rowan, 2013.
but let’s face it – we’re geologists, and this is a volcano.
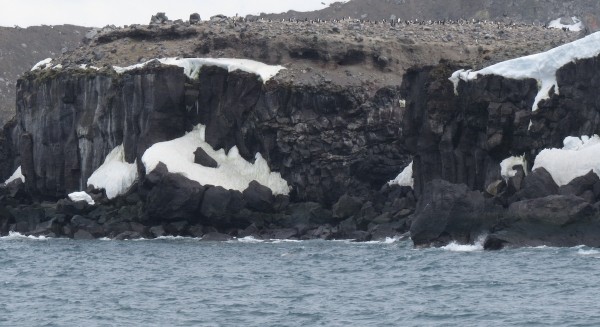
Yes, yes, I do see the lava flows forming those cliffs – oh, you mean the penguins? Photo: Anne Jefferson, 2013.
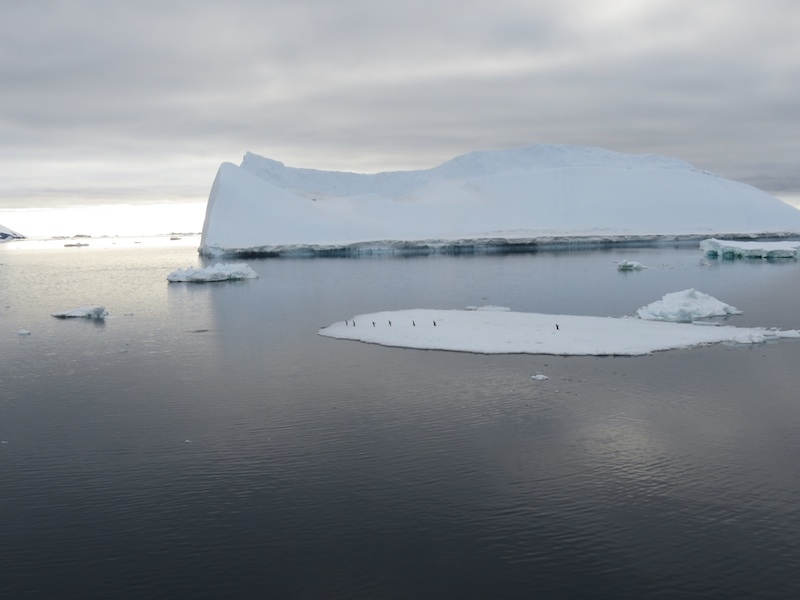
Technically Penguin Island is one of the South Shetland Islands, which are separated from the Antarctica Peninsula by the Bransfield Strait. It has been historically active – according the the Global Volcanism Program it last erupted in the mid 19th and early 20th centuries – and is likely to do so in the future. But right now the only rumblings are from the penguin rookeries, so there was nothing to stop combining some wildlife-watching with a hike up to the summit. As we climbed, we got a nice view of the larger ice-covered King George Island. It shows up quite nicely in the photo, but it actually took a while for your eyes to key in to the fact that the line marking the top of the ice sheet was in fact the top of the ice sheet, and not a line of clouds in the sky.
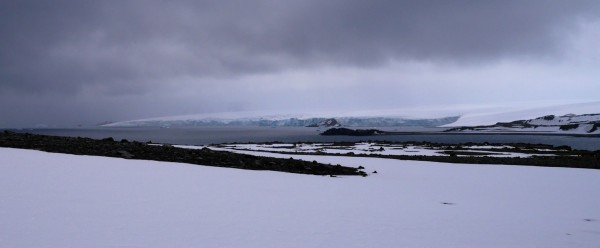
View from the slopes of Penguin Island: a thick ice cap blankets King George Island to the northeast.
Our climb was really more of a scramble, up a slope of scoria – chunks of dark, vesicular volcanic rock formed from blobs of cooling, gaseous magma thrown out of an erupting vent.
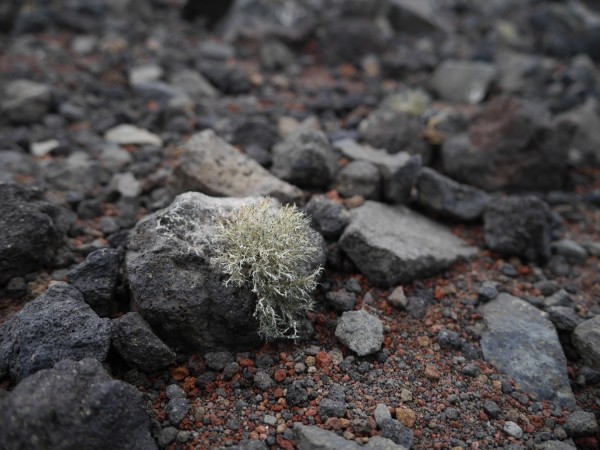
A hardy lichen growing on a bit of volcanic debris (scoria) near the summit. Photo: Chris Rowan, 2013.
We were rewarded with a great view at the summit*: within the central crater was a little cinder cone, and a tall plug of basaltic lava.
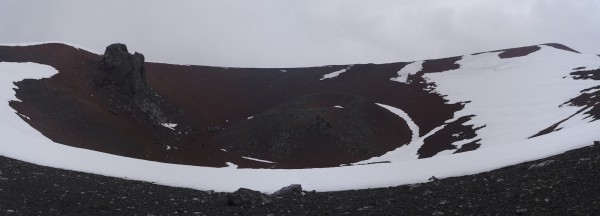
Panoramic view of the summit crater, Penguin Island. Cinder cone towards the centre, volcanic plug on the left. Photo: Chris Rowan, 2013.
We can interpret a little geological history from this: the summit was once a bit higher, and the plug formed from lava that cooled and solidified at the top of a conduit that fed the vent of this higher cone. It was then excavated by a later slightly more explosive eruption that formed the main summit crater, with the smaller internal cinder cone having formed most recently. Although in fact, the last eruption on Penguin Island was actually much closer to the shore, where the combination of hot magma and cold Antarctic seawater created a lot of an explosive steam, excavating a maar – a large crater that is now home to many nesting seabirds.
Maar formed by the most recent eruption on Penguin Island. Photo: Chris Rowan, 2013.
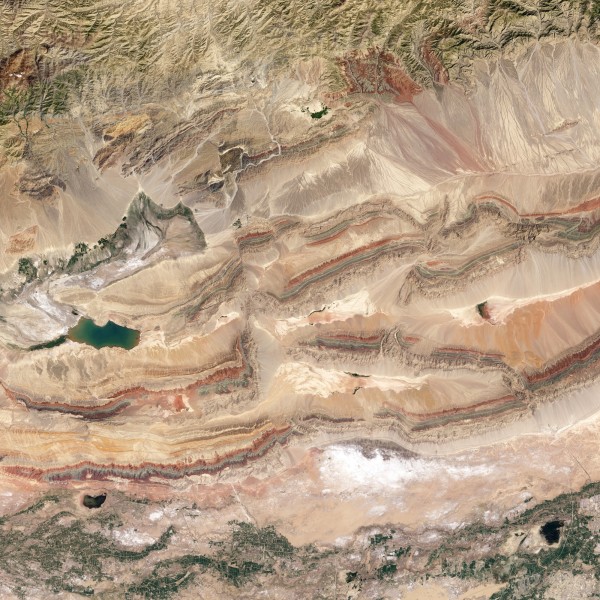
Of course, as geologists, we also want to know, why is this volcano here? There was a lot of talk on our cruise about how the Antarctic Peninsula is a continuation of the Andes – and it is certainly true that if you take the wide view you can kind trace out a link in the topographic and bathymetric features, although it takes a rather circuitous route. When the Andes reach the bottom of South America, their continuation does not directly cross the Drake passage: instead it cuts sharply east through Tierra del Fuego out into the South Atlantic, running south of the Falklands before lazily looping back west via the Sandwich arc to finally link with the tip of the Antarctica Penisula.
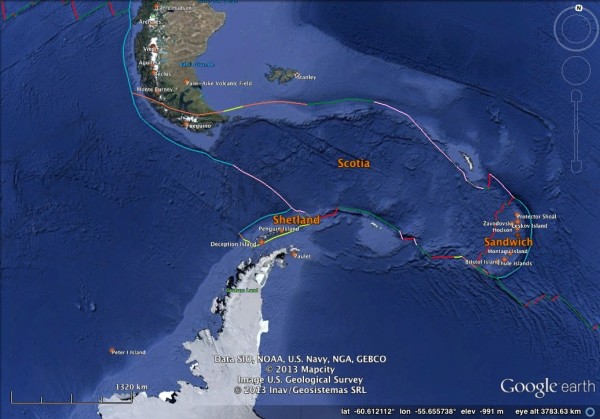
Bathymetry and tectonic plate boundaries in the Drake Passage between South America and the Antarctic Peninsula. Subduction zones are blue.
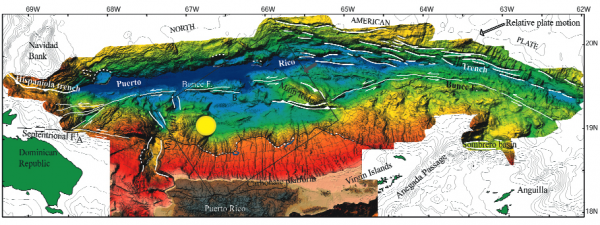
Chris is still trying to get the full tectonic history of this area straight in his head, but it seems that originally the Andes and the Antarctica Peninsula were indeed once northern and southern segments of a single chain of mountains and volcanoes. However, this simple arrangement was disrupted in the past few tens of millions of years due to the opening of the Drake Passage and the associated formation of several micro-plates. Nowadays, subduction off the Antarctic Peninsula – and hence volcanism on it – has mostly shut down; The exception is on the Drake-ward side of the South Shetland Islands, where there is a subduction zone (the South Shetland Trench). The South Shetlands are on their own little micro-plate that is breaking away from the Antarctic Peninsula. This rifting causes the crust to stretch and subside, forming the Bransfield Strait, and allowing the underlying mantle to rise, melt, and erupt at the surface at places like Penguin Island (and Deception Island, the other historically active volcano in the South Shetland Group). Based on this geophysical survey (pdf), from which I took the figure below, the rift has yet to get to the stage where new oceanic crust is being produced.
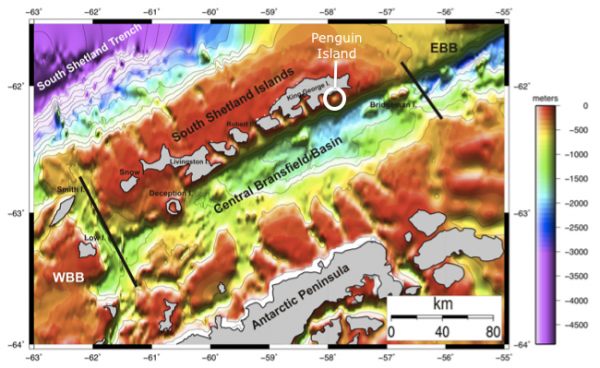
Bathymetry of the Bransfield Rift, an actively stretching basin that separates the South Shetland Islands from the Antarctic Peninsula. From Catalán et al. (2013)
So Penguin Island is the product of rifting, rather than subduction, which explains all the basalt. Of course, the penguins probably don’t care either way.
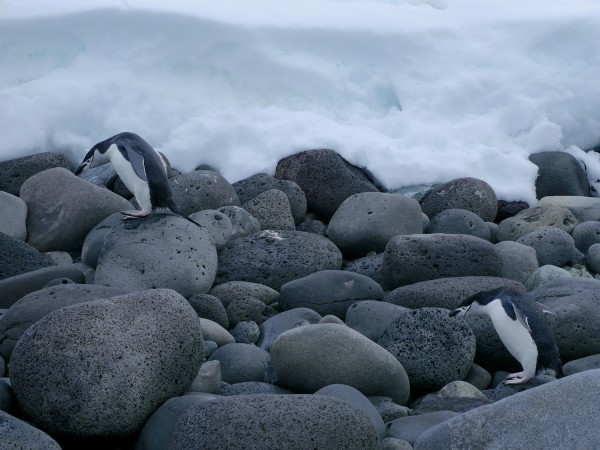
Chinstrap Penguins negotiating the basalt boulders on the shores of Penguin Island.
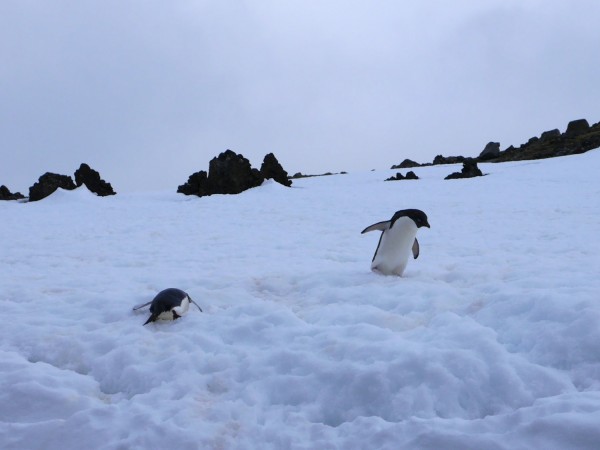
Adelie Penguins playing in the snow, Penguin Island. Photo: Chris Rowan, 2013.
*What do you mean, I’m looking in the wrong direction?
