Anne’s picks of the December literature

A post by Anne JeffersonI’m a few days behind on sharing my picks from December’s journals, but Chris has been doing such a stupendous job of sharing absolutely wonderful geology posts (and of deconstructing terrible science reporting), that I hardly feel guilty waiting until he’s occupied with travels before sneaking this post onto the blog.
Without further ado, here is the odd assortment of articles that hit my email box in December that I found most intriguing. They reflect a mixture of my past, present, and future research and teaching interests and should not be considered a reflection of anyone else’s tastes in science.
Burbey, T.J. (2010) Fracture characterization using Earth tide analysis, Journal of Hydrology, 380:237-246. doi:10.1016/j.jhydrol.2009.10.037
Tides are popping up all over in the geology literature these days, from the Slumgullion earthflow (atmospheric tides) to the San Andreas fault (earth tides). Here Burbey uses water-level fluctuations in fractured rock confined aquifers to quantify specific storage and secondary porosity. Fractured rock aquifers are notoriously tricky to understand, and this method gives hydrogeologists one more tool in their arsenal for understanding places like the Blue Ridge Mountains and the Piedmont. Since I’m getting interested in the fractured rocks in just those areas, this paper caught my eye.
Burnett, W.C., Peterson, R.N., Santos, I.R., and Hicks, R.W. (2010) Use of automated radon measurements for rapid assessment of groundwater flow into Florida streams Journal of Hydrology, 380:298-304. doi:10.1016/j.jhydrol.2009.11.005
Radon is a conservative tracer with concentrations several orders of magnitude higher in groundwater than surface water. That means that it can be used to evaluate the groundwater inputs into different stream reaches, though it is often used in conjunction with other tracers to get quantitative estimates. In this paper, Burnett and colleagues lay out a method for using radon as a sole tracer to quantify groundwater discharge. I’m looking around for tracers to separate overland flow, flow through the soil/saprolite, and groundwater from rock fractures, so this paper piqued my interest as radon is one candidate I’m learning more about.
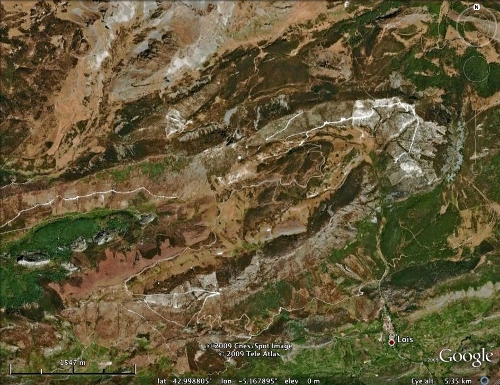
Garcia-Castellanos, D., Estrada, F., Jim?©nez-Munt, I., Gorini, C., Fern?†ndez, M., Verg?©s, J. and De Vicente, R. 2009. Catastrophic flood of the Mediterranean after the Messinian salinity crisis. Nature, 462, 778-781, doi:10.1038/nature08555.
5.6 million years ago the Mediterranean basin was nearly dry and highly saline in the midst of a period known as the Messinian salinity crisis, but 5.33 million years the Atlantic Ocean rapidly refilled the basin by overtopping and incising through the sill at the Straits of Gibraltar. How fast did that sea refill? How big was the peak discharge? And what did all that water do the straits itself? Those are the questions tackled in this paper, which combines borehole and seismic data with hydrodynamic and morphodynamic modeling. The story that Garcia-Castellanos and colleagues tell as a result of their work is truly astounding. The Atlantic Ocean overtopped the sill and slowly began to refill the Mediterranean, but as the sill eroded, discharge (and incision) increased exponentially until peak discharges on the order of 108m3/sec were reached and sea levels in the Mediterranean were increasing by up to 10 m per day. While the beginning and the end of the flood may have stretched out for thousands of years, the modeling work suggests that the vast majority of water transfer and the incision of greater than 250 m deep canyons across the Straits of Gibraltar was done on a time scale of several months to two years. That peak discharge is ten times greater than that estimated for the Missoula Floods, themselves not trifling events, and there may have been profound paleoclimate repercussions from such a significant change in the region’s hydrological status.
Grimm, R. E., and S. L. Painter (2009), On the secular evolution of groundwater on Mars, Geophys. Res. Lett., 36, L24803, doi:10.1029/2009GL041018.
Grimm and Painter created a 2D pole-to-equator model of subsurface water and carbon dioxide transport, initiated the model by simulating sudden freezing, and then looked at the effects over geologic time scales (secular evolution). According to their abstract, their model predicts water to be found in different places on the Martian landscape than previous ideas had suggested. I guess we’ll just have to go look and see who is right.
Jiang, Xiao-Wei; Wan, Li; Wang, Xu-Sheng; Ge, Shemin; Liu, Jie Effect of exponential decay in hydraulic conductivity with depth on regional groundwater flow Geophys. Res. Lett., 36, L24402, doi:10.1029/2009GL041251.
In soils and in the Earth’s crust, hydraulic conductivity (K) generally decreases exponentially with depth. This phenomenon is the result of the compaction and compression of the overlying strata. In this paper, Jiang and colleagues examine the implications such decreases in K on local versus regional groundwater flow systems. They find that the more quickly K decreases, the less water makes into the deeper regional flow systems and local flow systems extend deeper into the subsurface. They suggest that when hydrogeologists try to interpret regional flow problems, that we need to bear in mind the effects of decreasing K on the systems.
Knight, D.B. and Davis, R.E. 2009. Contribution of tropical cyclones to extreme rainfall events in the southeastern United States. J. Geophys. Res., 114, D23102, doi:10.1029/2009JD012511.
Knight and Davis used 25 years of observational, wind-corrected, and reanalysis data for the southeastern Atlantic coastal US states and found that extreme precipitation from tropical storms and hurricanes (TCs) has increased over the study period. They find that this increase in TC contribution to extreme precipitation is a function of increasing storm wetness and frequency, but not storm duration. If TCs are producing more precipitation, their flood hazards are also increasing, and flooding is already the leading cause of deaths associated with TCs.
Meade, R.H. and Moody, J.A. 2009. Causes for the decline of suspended-sediment discharge in the Mississippi River system, 1940-2007. Hydrological Processes. 24, 35-49. doi:10.1002/hyp.7477
Dams on the Missouri and Upper Mississippi Rivers have been blamed for trapping almost 2/3 of the sediment that used to reach the Lower Mississippi and Delta. Here, Meade and Moody show that the dams are only trapping half of the missing sediment, while engineering practices such as bank revetments and meander cutoffs, combined with better erosion control practices in the drainage basin, probably account for the rest. Meade and Moody suggest that this river system, in the largest basin in North America, has been transformed from transport-limited to supply-limited, which is a pretty amazing fundamental shift in the behavior of the river and its ability to deliver sediments to the Gulf of Mexico. [Note that there’s another article in the same issue on “A quarter century of declining suspended sediment fluxes in the Mississippi River and the effect of the 1993 flood.” Both articles are in the public domain and not subject to US copyright laws, though there doesn’t seem to be an obvious way to take advantage of that from the Wiley website.]
Neumann, R.B., Ashfaque, A.N, Badruzzaman, A. B. M., Ali, M.A., Shoemaker, J.K., and Harvey, C.F. 2010. Anthropogenic influences on groundwater arsenic concentrations in Bangladesh, Nature Geoscience 3, 46-52. doi:10.1038/ngeo685
The story of groundwater of southeast Asia’s deltas, where tens of millions of people live at risk of arsenic poisoning from their drinking water, is perhaps the most compelling contemporary scientific story of how geology, geomorphology, hydrology, and humans intertwine. It’s also an extremely complicated story, with arsenic-laden sediment from the Himalayas settling in the deltas , irrigated rice fields and ponds changing the local groundwater flow patterns, and microbially mediated oxidation of organic carbon driving the geochemical release of the arsenic into the groundwater. This story has been being pieced together in many papers in the last several years, and in this paper Neumann et al. show that groundwater recharge from the ponds, but not the rice fields, draws the organic carbon into the shallow aquifer, and then groundwater flow modified by pumping brings the carbon to the depths with the greatest dissolved arsenic concentrations. Add some biogeochemistry data, isotope tracing of source waters, incubation experiments, and 3-D flow modeling, and this paper adds some important elements to our understanding of how this public health risk came to be – and how we might be able to mitigate the risks for the people who have little choice but to drink the water from their local wells. [Also note that the same issue of Nature Geosciences has another article on “arsenic relase from paddy soils during monsoon flooding” as well as an editorial, commentary, backstory, and news and views piece on the southeast Asia arsenic problem.]
Pritchard, D., G. G. Roberts, N. J. White, and C. N. Richardson (2009), Uplift histories from river profiles, Geophys. Res. Lett., 36, L24301, doi:10.1029/2009GL040928.
In rivers that have adjusted to their tectonic and climatic regimes, the long profile of a river is smooth and concave. The interesting places are where river profiles don’t look like that ideal. This paper interprets river longitudinal profiles as a way to understand the tectonic uplift history of the area, through a non-linear equation. They check their interpretation against an independently constrained uplift history for a river in Angola.
Stone, R. 2009. Peril in the Pamirs. Science 326(5960): 1614-1617. doi: 10.1126/science.326.5960.1614
Dave Petley at Dave’s Landslide Blog has the must-read summary of this article on the risks associated with the giant lake impounded by the world’s tallest landslide dam. This is seriously fascinating stuff. I already talked a bit about the Usoi Dam in my dam-break floods spiel in my Fluvial Processes class, and now I have more ammunition for this year’s crop of students. In the same issue of Science, Stone also summarizes some of the other water issues facing Central Asia.

Please note that I can’t read the full article of AGU publications (including WRR, JGR, and GRL) until July 2010 or the print issue arrives in my institution’s library. Summaries of those articles are based on the abstract only. UNC Charlotte also does not have access to Nature Geosciences.

Categories: by Anne, climate science, geochemistry, geomorphology, hydrology, paper reviews, planets

Fox News: volcanic coal kills off dinosaurs before they even evolved

A post by Chris RowanTwitter can be cruel sometimes. Without it, I never would have come across (via user @DoubleBeam) this aneurysm-inducing travesty on the Fox News website. I’ve italicised sentences of particular ‘interest’ in the first three paragraphs.

Cataclysm That Killed Dinos Still Taking Lives Today

Coal from China’s Xuan Wei County, widely used for cooking and heating, may contribute to unusually high rates of lung cancer among women in the region.

The tremendous volcanic eruption thought to be responsible for Earth’s largest mass extinction which killed more than 70 percent of plants and dinosaurs walking the planet 250 million years ago is still taking lives today.

Scientists investigating the high incidence of lung cancer in China’s Xuan Wei County in Yunnan Province conclude that the problem lies with the coal residents use to heat their homes. That coal was formed by the same 250-million-year-old giant volcanic eruption termed a supervolcano that was responsible for the extinction of the dinosaurs. The high silica content of that coal is interacting with volatile organic matter in the soil to cause the unusually high rates of lung cancer.

That’s right. In just that second highlighted sentence, Fox News tells its readers that:

  • The dinosaurs were made extinct before they actually evolved (in reality they radiated after the Permian extinction killed off the mammal-like reptiles that were the dominant large land animals at the time0.

  • Volcanos erupt coal (if you read later in the article, this might just be clumsy wording – but I’m not sure that makes it any better).

My browsing of the various science news feeds indicates that the Fox News story was probably adapted from this press release. Compare the first sentence (my emphasis again) to the second paragraph of the Fox piece:

The volcanic eruptions thought responsible for Earth’s largest mass extinction — which killed more than 70 percent of plants and animals 250 million years ago — is still taking lives today.

So, the Fox reporter replaced ‘animals’ with ‘dinosaurs’. Because all extinct animals are dinosaurs, right?
Seriously, if you’re planning to actually expand on a press release for your story – a laudable aim, in principle – perhaps it might be best to fact-check your additions. I’d prefer churnalism to gratuitous insertion of wrong. On a more positive note, Alexis Madrigal wrote up what is actually quite an interesting story properly for Wired. It can be done, allowing us to ponder the actual point of the story – the potential impact of long-ago geological events on human health today – without having to grind our teeth to do so.
Update: The Volcanism Blog is also understandably perturbed about this story, and has a bit more on the actual research behind it.

Categories: general science, public science, ranting, science education

12 folds a-plunging

A post by Chris RowanOn the 12th day of Christmas my true love sent to me: 12 folds a-plunging…

Anyone with even a hint of structural geologist in their soul loves a good fold. As well as their geometrically appealing curves, they represent a tangible, easily read footprint of the tectonic forces that have lifted up the hills and mountains around you. A fold is said to plunge if its axis of curvature has been tilted away from the horizontal, such that the landscape will cut through the fold, rather than running parallel to it.

plunge.png

This means that when seen from above, plunging folds look rather beautiful; the differently eroding beds form a tableau of warped ridges and valleys, all co-operating to tell their tale of orogonies past.

Australia.jpg
Australia (click images to open in Google Earth)

Algeria.jpg
Algeria

Oman.jpg
Oman

IranFold.jpg
Iran

Cantabrians.jpg
Cantabrians

SouthAfrica.jpg
South Africa

Pakistan.jpg
Pakistan

Pakistan2.jpg
Pakistan again

Harrisburg.jpg
Pennsylvania

SplitMt_Utah.jpg
Utah

StGeorgeUT.jpg
Utah again

Wyoming.jpg
Wyoming

For the examples above (click here to open the full set in Google Earth) I’ve borrowed heavily from the SERC page of Google Earth mapping locations, as well as adding a few from my own personal experience. I was hoping to include at least one from the UK, but none of the examples I know of show up well on satellite; if you know of any, in Britain or elsewhere, I’d be happy to hear of them in the comments.

11 terranes amalgamating,

10 probes a-probing,

9 isotopes fractionating,

8 streams reversing,

7 glaciers melting,

6 fields a-flipping,

5 focal mechanisms,

4 index fossils,

3 Helmholtz coils,

2 concordant zircons,

and an APWP.

Thus ends my Christmas epic. Phew. I hope it provided some interest and enjoyment over the festive season.

Categories: geology, tectonics

11 terranes amalgamating

A post by Chris RowanOn the 11th day of Christmas my true love sent to me: 11 terranes amalgamating…

Strip away the last 200 million years or so of sediment covering the British Isles, and you discover a complicated jigsaw of different pieces of crust (in deference to Christie, I shall avoid calling it ‘basement’):

UKterranes.png
Adapted from Woodcock and Strachan (2000) Fig 2.8

The different coloured blocks are separated from each other by major faults, and have distinctive geological records: in other words, sequences of roughly the same age on adjacent blocks were formed in different depositional settings, and have different geochemical and fossil signatures. This suggests that these different crustal fragments – usually referred to as exotic blocks or terranes – started off their lives widely separated from each other, and have been juxtaposed by later tectonic activity involving the faults that surround them.
I have, in a previous post, discussed the period between about 500 and 350 million years ago, which started off with the crust underneath England and Wales (Avalonia) attached to Africa (or, as it was known in those times, Gondwana) on one shore of an ocean, and Scottish crust attached to North America (Laurentia) on the other shore; and ended with the closure of that ocean bringing them together, followed quickly thereafter by the rest of Gondwana, forming the Caledonian mountain chain in the process.
Avalonia1.png

Avalonia2a.png
Read this if you want the details

Following this story, then, you might expect to see that the underbelly of the British Isles was composed of at most three independent terranes, representing Laurentia, Avalonia, and Gondwana. So why are there so many more? That is most easily explained by looking at what is happening, and what is going to happen, all the way round the other side of the world:

Aus_Asia.jpg

It might not be immediately obvious, but we’re looking here at the very early stages of another continental collision: that of Australia and south east Asia. If you run current plate motions forward for a few tens of millions of years, Australia will slowly move northwards with respect to the Eurasian plate, and eventually collide with it. However, if you look within the steadily closing ocean between them, it is obvious that this collision will involve more than the two bounding continents; there are also lots of smaller continental fragments, such as Indonesia and Papau New Guinea, lying between them. These fragments will not be subducted, but will also be swept up into the collision zone and crammed together into a geological mishmash of numerous unique crustal blocks, all with different origins and trajectories.
‘Imagine’, a lecturer of mine once said, ‘trying to sort out that mess in 50 million years’ time’. But it is a similar mess, made 350 million years ago, that awaits those trying to unravel the roots of the British Isles. The different terranes represent Palaeozoic Indonesias and Papau New Guineas, which were crushed together with Avalonia as they all collided with the margin of Laurentia; even, the southernmost terrane in the first figure, Armorica, is actually another crustal fragment that rifted away from a completely different part of the Gondwana margin than Avalonia, and was only eventually merged with it on the other side of an ocean. The eagle-eyed amongst you will also note that the Avalonian block itself can be divided into at least two distinctive terranes; a further complication that suggests an earlier history of amalgamation. And if you think Britain looks complicated, remember that the Appalachians formed along the same long-lived convergent margin:

NorthAppalachianterranes.jpg
Source: Natural Resources Canada

and lets not even start on the Pacific Northwest.
Basically, as a rule of thumb, if you keep subduction going for a few tens of millions of years, you end up with a geological mess. Or, if you’re willing to look at it the right way, the coolest and most challenging jigsaw puzzles ever.

10 probes a-probing,

9 isotopes fractionating,

8 streams reversing,

7 glaciers melting,

6 fields a-flipping,

5 focal mechanisms,

4 index fossils,

3 Helmholtz coils,

2 concordant zircons,

and an APWP.

Categories: geology, Palaeozoic, past worlds, tectonics

10 probes a-probing

A post by Chris RowanOn the 10th day of Christmas my true love sent to me: 10 probes a-probing

I may be firmly Earth-bound in terms of my own research, but I have a long standing fascination with the geology of other planets. Partly because it helps place our own planet’s geological quirks and history in a richer context, but mainly because seeing all of these alien worlds in all their weird glory is just darned cool. Fortunately for me, we are living through an extremely exciting period in space exploration: manned space flight might remain stranded in Low Earth Orbit, but robot probes are exploring our planetary neighbourhood in ever more exquisite detail – and are starting to explore planetary neighbourhoods beyond our own. Which of these probes am I most eagerly awaiting new data and images from?

  • NASA’s Lunar Reconnaissanace Orbiter will spend 2010 scrutinising the Moon from low polar orbit. If you think that there may be nothing more to discover about our near-sister planet, think back to all that fuss about water last year; after a decade or three of relative neglect, I’d be surprised our renewed attention, with modern instruments, did not unveil some more surprises.
  • A bit further away, the Mars Reconnaissanace Orbiter is now back online after computer worries last year led to it being left in ‘safe mode’ for an extended period. And if the MRO is online, that means HiRISE will go back to work, which means more images like this competing to become the next wallpaper on my desktop:

    Martian_bouldera.jpg
    Martian_boulderb.jpg
    Bouncing boulder tracks! Source

    It is, of course, a little unfair to ignore the other five science instruments on the MRO – but I can’t help it.


  • On the surface, the Spirit Rover may be stuck, possibly for good, but Opportunity continues to make progress towards Endeavour crater, although it still has some way to go. For both rovers, however, more than six years of roving is quite an achievement for missions originally slated to last only 90 Martian days.
  • Opportunity_loc.jpg
    Adapted NASA image

  • It was recently announced that the European Space Agency’s Venus Express mission will continue until the end of 2012. It is soldiering on with little fanfare compared to many other planetary missions, perhaps because it is more geared at observing the Venusian atmosphere than its surface, it has less access to pretty images to whet the public appetite whilst the more detailed science is being written up. But Venus is worth some attention: we have yet to really resolve the contradiction of a planet so like ours in terms of size, composition and orbit being so unlike it terms of its habitability. Understanding this conundrum better will equip us to better interpret the results of our search for ‘Earth-like’ planets around other stars.

  • Which seems like a good time to mention Kepler, which is currently at the forefront of this search. There is a press conference tomorrow that will reveal the latest data. There were reports a couple of months ago that data analysis was being hampered by a (fixable) problem with noise in the electronics, which suggests that whatever discoveries they announce will not include definite detection of Earth-mass planets – but the year is young.

  • Back in our own solar system, Cassini continues to explore Saturn, including its geologically interesting moons. The currently listed flyby schedule has 6 close passes of Titan listed for the first half of the year, the first one in happening in just over a week; these periodic snapshots will hopefully proviide more insight into the effects of the changing seasons on its hydrocarbon lakes.

  • New Horizons will not reach Pluto until 2015, but 2010 has some signficance, as it marks the half-way points of the mission. I say points, because it seems there are a number of different half-way points to be commemorated, due to the vagaries of orbital mechanics and slingshot manoeuvres. The first actually fell just before the turn of the decade: after Dec 29th last year, it was closer to Pluto than is was to Earth. At the end of Feburary, it will be half the heliocentric distance to Pluto; in April, half as far from the Sun as Pluto will be at the time of the 2015 flyby; and in October, half the total flight time to Pluto will have elapsed. Only 5 more years until our first glimpse of a Kuiper Belt object. Will Pluto show some signs of geological activity in the time since its formation?
  • The newly re-upgraded Hubble Space Telescope is of course spending a large chunk of it’s time peering towards the edges of the Universe. It may also be enlisted to attempt imaging more extra-solar planets. However, I’m also hoping that some time is allocated to looking at the planets not currently hosting robotic visitors, because the results are pretty cool when it does.
  • Hubble_Jupiter.jpg
    Source: Hubblesite

  • Finally we musn’t forget our own pale blue dot: I’ll certainly be keeping an eye on the output from EOS-1 and Aqua, as packaged by NASA’s Earth Observatory, who periodically wow me with images both beautiful and informative, such as this recent shot of fringing coral reefs fringing an island in the Adaman Sea, that were lifted above sea level by the Boxing Day 2006 earthquake.
  • N_sentinel_reef.jpg
    Source: NASA Earth Observatory


All in all, there’s lots of geoplanetary excitement to look forward to in 2010.

9 isotopes fractionating,

8 streams reversing,

7 glaciers melting,

6 fields a-flipping,

5 focal mechanisms,

4 index fossils,

3 Helmholtz coils,

2 concordant zircons,

and an APWP.

Categories: geology, planets