
As watershed hydrologists, we care a lot about precipitation, especially when it reaches the land surface (or the vegetation just above it). Precipitation is the dominant input to our water balances and a major driver of streamflow and water table responses. Because precipitation is so important, we need to spend some time talking about how we measure it. Some hydrologists spend large chunks of their careers working out the best ways to measure and analyze precipitation (and understanding the processes that make it so hard to do!), so this is just an overview.
All about rain gauges
The simplest way to measure precipitation is to put a rain gauge at a point on the landscape. Almost all rain gauges have a funnel down to an opening that then drops water into a collection container. The amount of water in the container is either measured at specified intervals, or it is automatically measured and recorded. Knowing the size of the top of the funnel relative to the size of the collection container lets us related the volume or depth of water in the container to the amount of rainfall.
Standard rain gauges
Here’s what’s called a standard rain gauge:
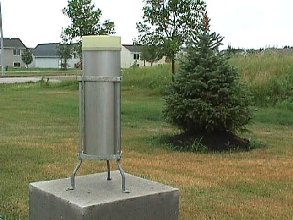
Standard rain gauge, as pictured by the National Weather Service.
This is what the Cooperative Observers for the National Weather Service (NWS) use to measure rainfall. Here’s how the National Weather Service describes the gauge: “The most common is the non-recording gauge called a Standard Rain Gauge, SRG. Typically the SRG is a metal cylinder with a funnel on top and a plastic measuring tube in the middle. The measuring tube can handle up to 2.00 inches of rain before overflowing into the larger outer cylinder. During the winter, the observer removes the funnel and inner tube and allows the snow to collect in the outer tube. The observer then melts the snow and measures it, getting an accurate water equivalent to report.” Dr. Jefferson has a standard rain gauge sitting in her office. Ask her to show it to you some time.
From that picture, you can’t see what the inside of the rain gauge looks like, but there’s a smaller version of it that a lot of people (include Dr. Jefferson) use. It’s the official rain gauge of the CoCoRAHS network (more on them in a minute).
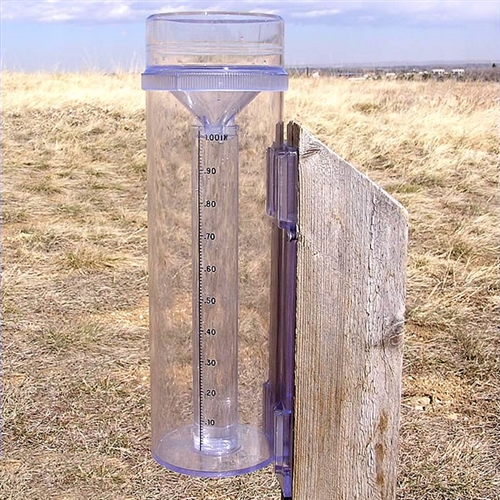
4″ rain gauge made by Stratus and required by CoCoRAHS. When more than 1″ of rainfall is collected, it overflows from the inner cylinder to the outer cylinder. Then if you need to measure it, you can carefully pour increments of water into the inner cylinder and add it up. In the winter, you take off the funnel and inner cylinder and can collect snow.
The limitation of these rain gauges is that someone has to go outside and manually measure the water level in the gauge, so it is difficult to get frequent (sub-daily) measurements of rainfall. Enter the recording rain gauges.
Recording rain gauges
The National Weather Service (NWS) uses a recording rain gauge that weighs the collected precipitation every 15 minutes, converts that weight into a depth (again using the geometry of the funnel), and records the depth on a punch tape. Once a month, someone can visit the gauge, dump it out and put in a new punch tape. It’s old school, but it works accurately and with minimal maintenance.
Fancier still is the tipping bucket rain gauge. You should watch the video below to see how a tipping bucket rain gauge works. (The one in the video is heated to melt snow and ice, but not all tipping bucket rain gauges are.)
Tipping bucket rain gauges are appreciated for their ability to give high frequency data, because the data logger actually records every time the bucket tips (every 1 mm or 0.01 inch of rain). You can turn that record of tips into things like 5 minute rainfall intensity, which is fantastic. However, tipping bucket rain gauges can under-measure precipitation if it’s raining hard and water drains into the bucket in the middle of a tip. Also, clogging of the orifice (by things like bird poop) can keep a tipping bucket rain gauge from recording any precipitation. Still, this style of rain gauge is widely used.
There are some other technologies for measuring rainfall that are less widely used but still very interesting. These include optical sensors and impact sensors that measure the size and number of drops hitting a surface. The bigger the drop, the more water it contains, so size times number allows calculation of a rainfall depth. There also small Doppler radar sensors that measure drop speed, but we’ll talk more about radar technology later on. These impact, optical, and radar sensors differ from traditional rain gauges because they don’t have a funnel and they don’t in any way collect the precipitation that hits them. You can read a little bit about impact, optical, and radar sensors on this page. Like tipping bucket rain gauges, all of these sensors would be connected to some sort of data logger to record the data for you, enabling high frequency measurements.
Siting your rain gauge
As you can imagine, your choice of rain gauge technology depends on how frequently and accurately you want the measurements and how much you are willing to pay. But regardless of technology, there are some general rules you should follow in figuring out where to put your rain gauge.
- The funnel of your rain gauge should be approximately 1 m above the ground and horizontal.
- Your rain gauge should be sited away from taller objects. (Scroll back up and look at the clear plastic rain gauge. Notice how it is at the top of the post, and the post is beveled away from it.)
- While you want to be away from tall objects, but not in a wide open area (like a rooftop or the middle of a field), because then wind will have a bigger influence on the rainfall. The National Weather Service (NWS) says: “The best site for a gauge is one in which it is protected in all directions, such as in an opening in a grove of trees. The height of the protection should not exceed twice its distance from the gauge.” Figure 3.5 in your textbook (Brooks et al., 2013) shows what a well sited gauge looks like.
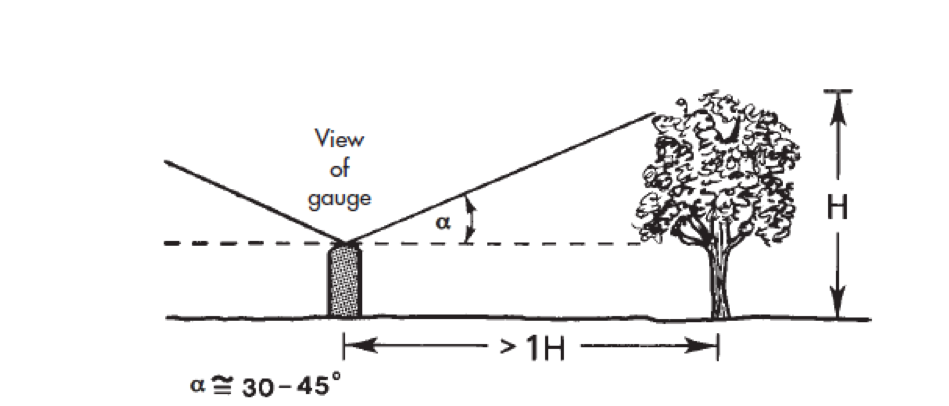
Proper siting of a rain gauge with respect to the nearest object (Brooks et al., 2013).
Undercatch
Even though we use rain gauges to measure rain, they don’t capture every last drop (even when they are well sited). The term “undercatch” refers to what is measured in the gauge relative to the true rainfall. Undercatch can happen because of wind blowing rain drops around and distributing the rainfall unevenly over a small area. If you are siting a rain gauge in a windy area, you can add a wind shield (not like on your car, click the previous link) to try to decrease these effects. Undercatch can also happen because some of the rain that hits the rain gauge doesn’t slide all the way down the funnel and into the collection tube or tipping bucket. Instead, surface tension holds the rain on the funnel or opening. This is called “orifice wetting loss” and is a bigger problem (in relative terms) for trying to measure small rain events. Rain gauge makers try to design materials that minimize orifice wetting lost, but some is inevitable. Finally, tipping bucket rain gauges underestimate high rain rate events, as previously described. The amount of undercatch your rain gauge experiences is determined by both the type of gauge and the particular location where it is sited. A combination of laboratory measurements and inter-comparisons of gauges in the field are necessary to really figure out what the undercatch is, but there are also scientific publications that can help you make estimates. If you ever have the job of getting super-accurate rainfall measurements, you’ll want to spend some time with the undercatch literature.
Beyond undercatch, precipitation data can have problems and be poor quality for a variety of reasons. For standard rain gauges, there can be observer error and the depths can be read wrong. Or a measurement can be completely forgotten. For both standard and recording gauges, the orifices can get clogged with leaves, bird poop, and other stuff preventing water from reaching the collection container or tipping bucket. If you don’t have a heated gauge, snow and ice can accumulate in the funnel and prevent later rainfall from reaching the orifice. Or, the gauge can record snowmelt as if it were rain. (You think measuring rain is hard, wait until we get to snow.) If you are using an automated recording rain gauge, electronics problems, battery problems, full memory, etc. are all things that can cause data to be lost or poor quality.
How many point rainfall measurements do you need to know how much it rained in your watershed?
Great question. We’ll talk about how to turn point rainfall measurements into areal estimates in class, but here’s some general guidance for thinking about how many rain gauges you might want in a watershed.
- It depends on size of watershed.
- It depends on the variability of precipitation you expect over the area. Are you in the mountains with big elevation differences or in an area with scattered thunderstorms? Then you’ll want more rain gauges than a flat area with mostly low intensity rainfall.
- Statistical methods can help you figure out how many gauges you might need, but you’ll have to spend time with the scientific literature to find an appropriate method.
- Random sampling might not be practical, because of site access, topography, forest cover, etc.
- Usually, we don’t have enough gauges.
Where can I get point precipitation data (in the US)?
The National Climatic Data Center (NCDC) is a one stop shop for a lot of weather and climate datasets for the US. These data can be accessed through: https://www.ncdc.noaa.gov/cdo-web/. When your computer is on a university IP address, you can download as much data as you want for free. Among the data you will find on NCDC are:
- ASOS = Automated Surface Observing System = “nation’s primary surface weather observing network” – hourly, high quality data, supported by NWS, FAA, and DoD– many stations are at airports (900 stations)
- NWS Cooperative Network = daily observations by trained volunteers w/ support from NWS (~8700 stations)
- US Climate Reference Network = 132 stations focused on long-term trends
Data available on the NCDC website has had some quality control done to eliminate errors like someone misreading or mis-entering a number or an electronics glitch that causes unrealistic readings. So these datasets are a great choice if they are available and meet your needs.
But, if the NCDC datasets won’t work for your purpose you have other options. There are research rain gauges maintained by university researchers (including students like you), the USGS maintains rain gauges (though they don’t do quality control of the data ), and other state or local agencies may have rain gauges in your area. For example, the Northeast Ohio Regional Sewer District maintains a network of rain gauges in the Cleveland area to help it understand and predict flooding and combined sewer overflows. The availability and quality of these datasets will vary depending on where you are, how happy they are to share, and what they are doing to maintain high quality data.
There are lots of amateur weather enthusiasts who maintain personal weather stations and upload their data in real time to sites like www.wunderground.com. Often you can get high frequency data right in your neighborhood. (There’s one just down the street from me.) But! If you are going to use these data for research or water management, be very careful. There is no one in charge of making sure that the data are accurate in anyway. Gauges may be poorly sited or poorly maintained, and I’ve seen examples of big variations in rainfall measurements (or even missed storms) in small areas.
“CoCoRaHS is a unique, non-profit, community-based network of volunteers of all ages and backgrounds working together to measure and map precipitation (rain, hail and snow). By using low-cost measurement tools, stressing training and education, and utilizing an interactive Web-site, our aim is to provide the highest quality data for natural resource, education and research applications. ”
Next up: Radar rainfall measurements and satellite precipitation measurements.
(Please note: The information above is designed for students in Kent State’s Watershed Hydrology class who are learning the basics of precipitation measurement. If you are an expert at anything in this post and discover an error, you can let me know with constructive pointers to better information.)