
Preface
For the 3rd year in a row, I have meticulously tracked each and every paper, proposal, manuscript, etc. I read for professional reasons. Begun by Jacquelyn Gill in early 2015, I found the twitter hashtag #365papers an appealing way to get a sense of what types of things and how many I was reading. In 2015, I was particularly curious how having an infant might affect my reading habits. I carried on logging my papers in 2016, when I was teaching a full load, including 2 graduate courses. It turns out that my teaching load does have a big impact on my reading, because I read (and discuss) so much primary literature in class. Based on how helpful I’ve found the process of being analytical about my reading, I continued to log my papers for 2017, as just a professional version of life logging or the quantified self idea. This year, I had a lighter teacher loading in the spring (but a high administrative/service load) and was on a research leave in the fall. What difference will I see?
Before we get into the data, a brief pause for a key definition and some discussion of that: What does it mean to read a paper? Here’s what I wrote in 2016:
I only counted papers that I read fully through the results and discussion sections, so there are quite a few papers that I read large chunks of but didn’t make the list because I didn’t finish.
What I’m logging as reading is not opening up a PDF to confirm something that I already think I know or check a key statistic. I’m not reading the abstract and I’m not hunting for a citation that I can plop at the end of a sentence for something I’m writing. I’m deeply reading the paper (introduction, methods, results, and discussion), looking at all of the figures and probably most of the tables. For most papers I count as read, I have either highlighted, made marginal notes, or written a brief synopsis after I’ve finished with them. I’m know that I’ve spent time with hundreds of other papers this year that never made my spreadsheet for the #365papers project, because in my mind I haven’t truly read them top-to-bottom.
Last week, Caitlin MacKenzie wrote a beautiful post about her own reading for this year and she reflects on this idea of deep reading. (Read it!) She talks about how we train ourselves to perfect the art of skimming a paper and how we flick-bounce between things we read, and then she mentions the number of papers that the average science faculty member allegedly reads per year: 468. Let me tell you in advance, I did not deeply read 468 papers in 2017, or 2016, or 2015, or probably any year since 2007 when I became a faculty member. And honestly, I don’t believe that the average science faculty member did either… or at least not deeply read that number of papers per year. (However, I’ve added the two papers that quantified these statistics to my “to read” pile for 2018 and I’m looking forward to see how they defined reading.)
With that important point made, I’ll refer you to my epic 2016 blog post for a detailed set of methods. The only methodological difference this year is that I did count student thesis proposals, because I was deeply reading them and decided that they deserved to be counted.
Results
In 2017, I deeply read 105 items, which falls neatly between 2016 (132) and 2015 (78). It does support my conclusion from last year that teaching grad classes enhanced my reading, but it also makes me wonder what exactly an average year looks like. If I ever have what I think is an average year, I’ll let you know.
Of the items I read, 70 were published journal articles or GSA publications and 12 were manuscripts that I either reviewed or for which I served as associate editor. (I have been an associate editor at Water Resources Research since May.) I know that there are both published articles and manuscripts under review that I read deeply more than once in 2017, but I only counted them one time each. I also reviewed 16 grant proposals, 3 unpublished dissertation chapters, and 4 MS thesis proposals. As in previous years, I did not count a zillion blog posts and news articles (even though I learned a ton from them) and an ungodly number of student thesis drafts and other writing assignments. Relative to 2016, it’s clear that my reading took a hit in the published journal articles arena, as I reviewed slightly more papers and proposals than last year.
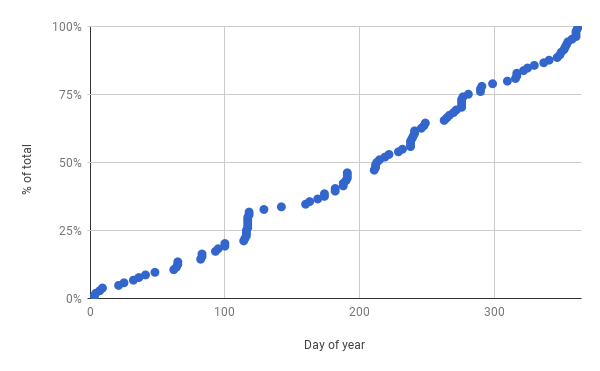
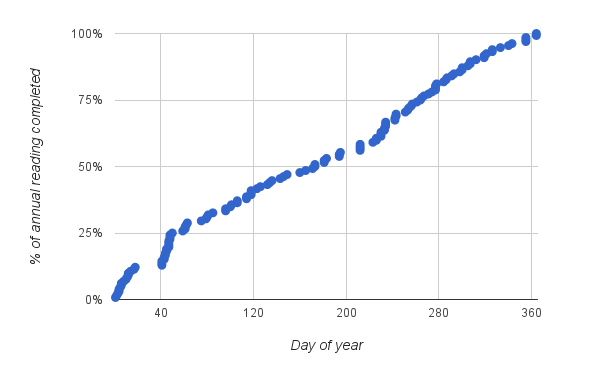
Figure 1. Cumulative distribution function of my reading in 2017.
The rhythm of my year comes into stark relief when I examine my patterns of reading over time (Figure 1). I read, slowly but steadily, through spring semester when my service load was heavy, with a push around the time I served on a grant review panel. I also read steadily through most of fall semester’s research leave, and at faster rate, which makes sense since my whole job was to read and write and think.
It’s the summer though where I see the most interesting phenomena. My reading clicks along steadily through my summer travels, helped by attending a conference and some train and plane journeys. But then there’s a big 20 day gap in July (centered on day 200) that I really can’t explain. And, oddly, there’s a similar gap in my 2016 data. I’m fairly certain that I didn’t just fail to record my reading during that period, and I sort of think it wasn’t just reading, because I remember that in early August I told myself that things had to change if I wanted to make my fall semester a success. The good news is that I did get back on track, picked up the reading pace, and read 50% of my items for the year on or after August 3rd. (I also got 3 papers submitted between August and December.) Heading into 2018, I’ll know to watch out for the July doldrums and hopefully can avert a similar slump.
For 2016, I made a graph that showed why I read the things I read and I found that my graduate class teaching accounted for 48% of my non-review reading for the year. In 2017, without those graduate classes, teaching-related reading was only 5% of my total.I also broke out graduate students (dissertation chapters, proposals) as their own category and that took up 12% of my reading space. And of course, some reading should really double-count, e.g., papers we discussed in our lab meeting were categorized as research, but they certainly served a teaching purpose as well. A higher percentage of my reading (11%) revolved around public engagement in 2017, and I did less generally keeping up with my fields sort of reading (18%) than in 2016. That left the majority of my reading (54%) categorized as directly related to ongoing research projects. With lots of research irons in the fire and 3 conferences (+reviewing) as vehicles for generally keeping up with my fields, I think this makes a lot of sense for 2017.
Another way of thinking about whether I’m keeping up with the literature in my fields is to look at when the papers I’m reading were published. As in previous years, it looks like I’m mostly reading papers published in the last few years (Figure 2). 50% of the papers I read were published in 2017, and my weighted-average publication date is 2014. So, yes, I’m reading the recent literature relevant to my research. Yay! On the other hand, these data suggest that if I don’t get to a paper within a year or two of its publication, I might not ever deeply read it, which is a little sad, given the size of my “want to read” folder.
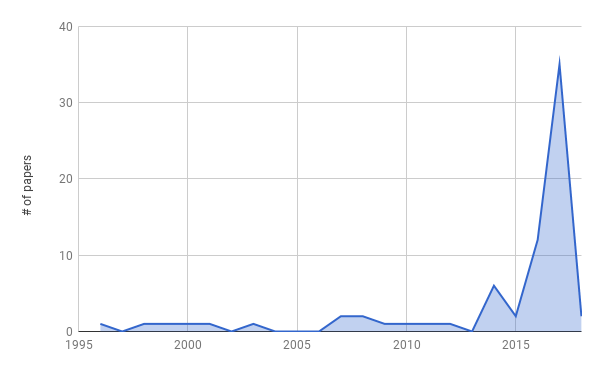
Figure 2. Publication date for papers I read in 2017. One paper had a 2018 publication date.
I also kept track of first authors, their likely gender, and what country they were affiliated with. I’m kind of thrilled that I read a nearly equal number of papers with women first authors as those by men. 48.6% of the papers I read had women first authors and 47% of the unique first authors were women. This substantially better than last year, and substantially better than than we might expect given the gender disparities that persist in the geosciences. I suspect, though, that some of this comes from my interdisciplinary reading habits and that fields like ecology and public engagement don’t skew so heavily male. On the other hand, about 75% of the papers I read had a first author affiliation in the USA and I still need to break out of the USA-Australia-Canada-UK reading hegemony.
Is the open-access revolution arriving? 33% of the papers I read were available for free from their publishers and another 11% were available elsewhere on the web for free. I’d been thinking that the availability of AGU publications >2 years old might be a reason for my increased ease of paywall-free reading, but when I look at the papers that were available OA, I see that I didn’t actually take advantage of that all that much (mostly because of Figure 2). Also, 33% of the papers that I published in 2017 are available open-access. This paper, with Tara Smith and colleagues,: “Prevalence and Characterization of Staphylococcus aureus and Methicillin-Resistant Staphylococcus aureus on Public Recreational Beaches in Northeast Ohio” was published in AGU’s new open access GeoHealth journal in November.
Over the course of 2017, I read articles from 43 different journals. I found these articles primarily via people (students, colleagues, twitter, the authors) (28), google scholar (18), and tables of contents sent to my email (10), with lower numbers attributed to citation alerts, browsing a journal (on paper or electronically), or in the references cited of other papers. Here I need to give a shoutout to my mom, who told me about the paper that ended up being one of my favorites for the year: on phosphorous and nitrogen budgets for urban watersheds, published in PNAS by Sarah Hobbie et al. The top journal I read from was Science (thanks to that digital subscription that comes with AAAS membership), but if you add back in my reviewing and editing, the top journal was Water Resources Research.
As in 2016, I tagged each article I read with a primary topic and sometimes a secondary topic. My top primary topics of the year were (no, surprise) urban hydrology, (general) hydrology, and geomorphology. When I add in the secondary topics, I add water quality/geochemistry, climate change/climatology, and science communication to the list of most frequently read topics. This, I feel, is a pretty nice summation of how I saw myself as a scientist in 2017.
Discussion
I could certainly be doing more reading in a year (especially in the summer), even if I don’t think I’ll ever deeply read anywhere near the 468 papers the average science faculty member allegedly reads. I continue to be concerned that reviewing takes up such a large fraction of my reading space. I’ve found it really helpful to track my reading habits the last few years, and I’ve also been tracking my writing habits for about 6 months now. Tracking my reading and writing has certainly made me more aware of my own productivity patterns, and has changed them for the better (the observer effect in action).
One thing that has been percolating through my mind is that there are lots of exhortations to write every day and to schedule regular time to write. There are even whole books about how to write a lot. Yet, I don’t often see similar calls to schedule regular reading time, read every day, etc. When I do see something about reading the literature, it’s more along the lines of this hilariously true article on someone’s first experience trying to read a scientific article. It’s all to easy to push aside the reading in favor of the “doing” bit of science, whether that’s collecting and analyzing data or writing up the results. As a profession, we reward productivity in the form of papers and grants, and sitting down to deeply read journal articles can feel like wasted time. Yet, if we aren’t regularly reading the literature, we risk that the work we are doing is out-of-date, duplicative, or derivative.
For myself, I’ve learned that I have a very hard time stopping in the middle of a workday to read papers. Most of the time, if I am reading during the workday, I’m looking for a very specific thing or for just big picture understanding. Or I’m reading abstracts and filing papers away to read “later”, whenever that might be. But on mornings when I get up early and the house is quiet, I can make myself a cup of tea and read papers until my family wakes up. Because my mind isn’t in busy-busy-do-all-the-things mode, I’m able to drink in the papers along with my tea. I’ve also found some success in listening to papers via PDF reader while walking the dog and folding the laundry, though that doesn’t work well for math or figure-heavy papers. I’ve also found hat I have more ideas and enthusiasm for what I’m working on if I’m reading a lot of papers in my field and that periods of intense reading are followed by periods of intense data analysis and/or writing productivity. The trick is not to completely drop the reading habit when I’m those other phases of work.
As all of these thoughts were playing in my head in the last week of 2017, Caitlin MacKenzie’s post gave rise to a great discussion on Twitter about reading habits. In particular, Meghan Duffy and Susana Wadgymar brought up the point and setting aside regular times to do that reading, and Nina Wale reminded us how it important it is to our job as writers.
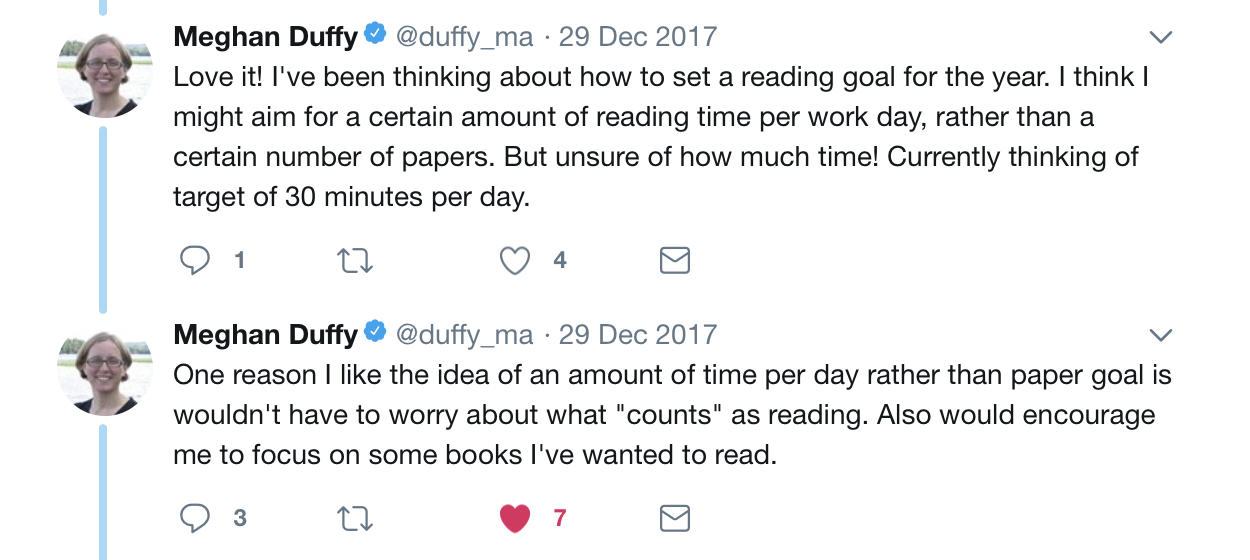
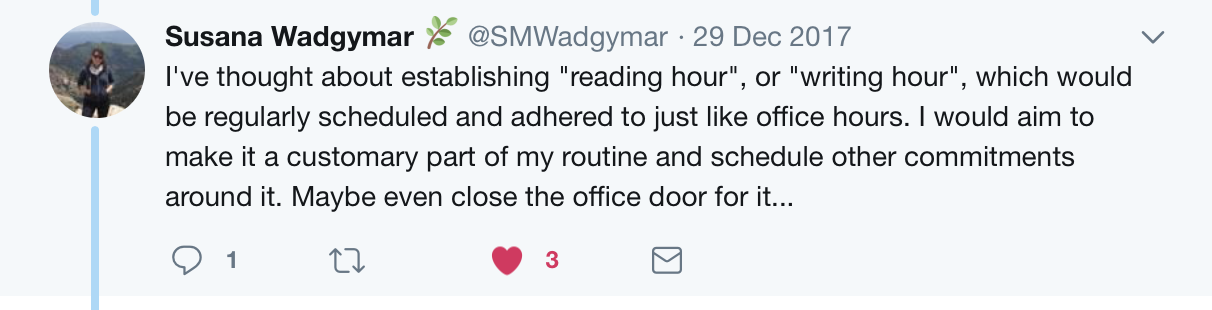
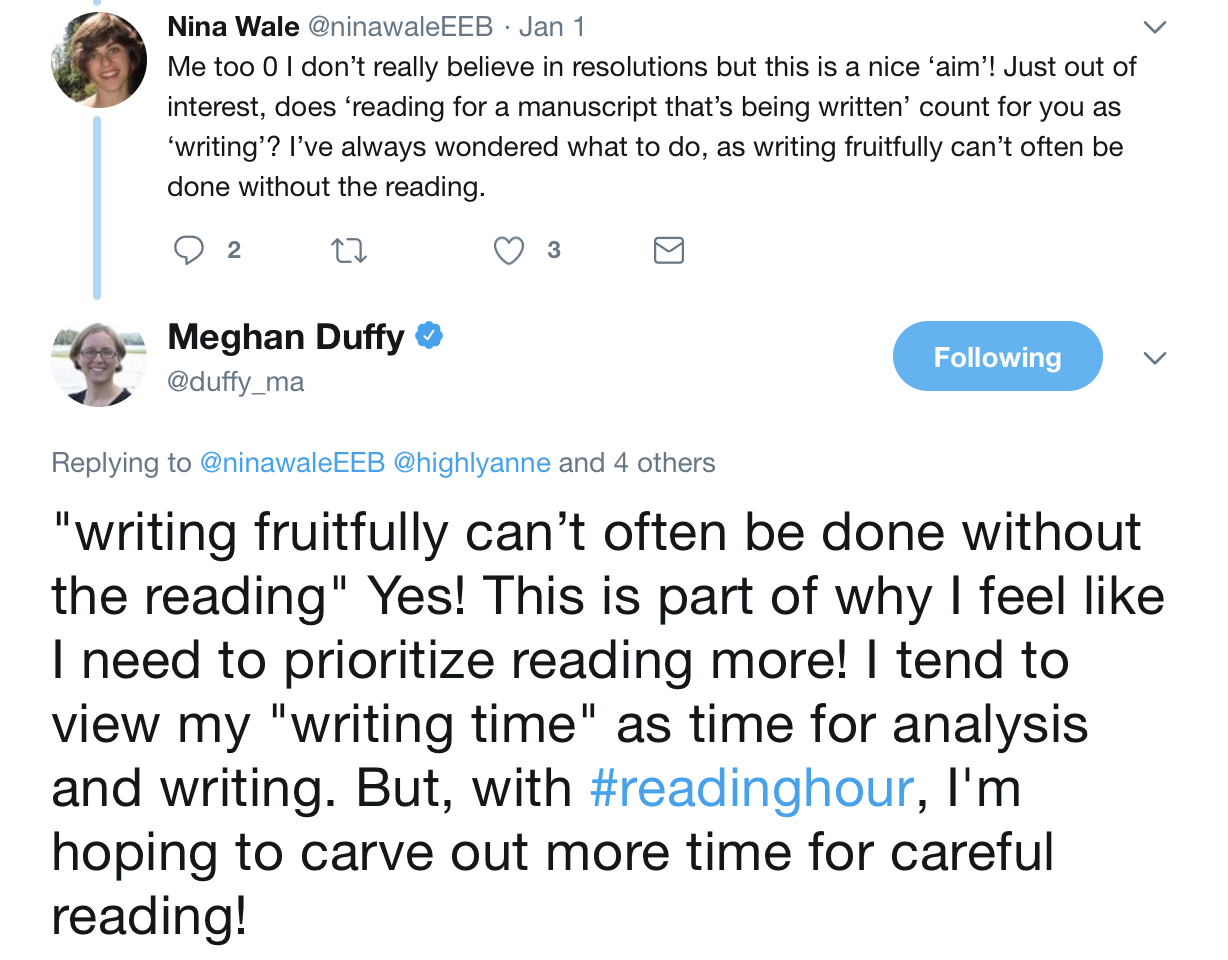
Spurred on by the conversation on Twitter, in 2018, I’ll be continuing to track my reading habits, but I’m also going to try something new. I’m setting aside time on my calendar, most days, for reading. Maybe I’ll tweet it using the Meghan suggested #readinghour hashtag, or maybe I’ll stay away from internet distractions. Sometimes my reading will be in the early morning, but other days it will be in my office, with the door closed, after brewing a cup of tea with my office kettle. We’ll see how it goes, but I’m hopeful that I’ll read more, more regularly, and be overall more creative, happy, and productive because of it. Whatever the case, I’m sure you can look forward to an update here a year from now.
Links (1)-
Pingback: #Readinghour: My plan to read more in 2018 | Dynamic Ecology