
 Over the weekend I finally got around to reading Polyak et al.‘s recent Science paper, which claims that at least part of the Grand Canyon is up to 10 million years older than most people have previously thought. Andrew, Callan, Brian and the newly resurrected Dave Schumaker have all discussed this, and the paper is also the subject of excellent articles in Wired and the Washington Post. But, as ever, I’m not going to let all this previous commentary prevent me from sticking my oar in, especially since it looks to me like the main conclusion of this paper is far from the only way that you can interpret the authors’ data.
Measuring rates of erosion – a destructive, rather than a creative, process – is not exactly trivial, and Polyak et al.‘s method is undeniably clever: they have searched the cave systems in the walls of the Grand Canyon for mammilaries – a particular sort of carbonate concretionary structure which only form near the top of the water table, and are also yet another entry in the long list of geological terms that brings out the puerile schoolchild in us all. By radiometrically dating the mammilaries found at various heights in the Canyon walls, you can then estimate how the level of the water table – used by the authors as a proxy for the height of the Colorado River, and hence the depth of the Grand Canyon – has changed over time.
Given this, I was quite surprised to see that the paper didn’t include a plot of mamillary age against canyon elevation, which seems the obvious way to illustrate patterns in the data. So I made my own.
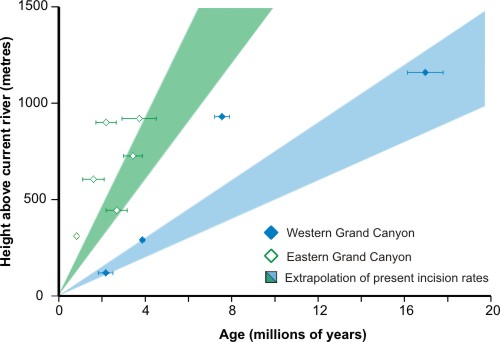
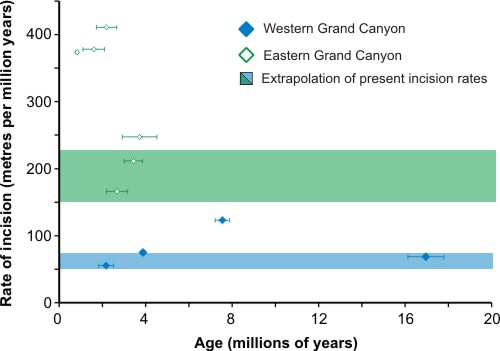
This plot clearly shows that you can differentiate between faster apparent incision rates in the eastern portion of the canyon (green) from slower rates in the western part (blue); but how much faster? I’m intrigued why Polyak et al. seem to have ignored the data point at around 7 or 8 million years (their Site 1), which implies that most of the topography in the western part of the Canyon has been incised since then, with only maybe a couple of hundred metres of relief being eroded at much slower rates since 17 million years ago. This is especially interesting given that this interpretation would fit more closely with some of the other geological evidence (such as when you start to see significant amounts of sediments eroded from the Canyon being deposited further downstream). Excluding this point does allow you to infer a constant rate of incision, within the range of estimated recent erosion rates (shaded blue region), over the entire proposed period of canyon formation. However, I don’t see why this should necessarily be the case, and a plot of incision rate against age shows that the rate of erosion in the eastern Grand Canyon appears to have varied considerably over time, being much higher that the present day estimates between one and three million years ago.
Note I’m not saying that Polyak et al.‘s interpretation is necessarily wrong; they may have had good reasons for excluding that data point. It’s just that they don’t seem to give any in the paper itself, only a – very brief – note that it is a little aberrant. Given that this exclusion fundamentally changes their interpretation, I find that a little annoying. In the conclusions, Polyak et al. say that many more of these mamillary deposits seem to be present in caves and fissures in the walls of the Grand Canyon; hopefully more are going to be dated, and make the picture a little clearer.
Polyak, V., Hill, C., Asmerom, Y. (2008). Age and Evolution of the Grand Canyon Revealed by U-Pb Dating of Water Table-Type Speleothems. Science, 319(5868), 1377-1380. DOI: 10.1126/science.1151248
Comments (2)