
For seismologists, the vast disparity between the human lifespan and the timescales over which geological processes operate is not just a conceptual problem, but also a practical one. One of their most important tasks is to assess the “seismic hazard” – a probabilistic estimate of the severity of ground shaking from an earthquake an area is likely to experience over the next 50 or 100 years (the USGS have some good background on this) – useful information to have when considering where, and how strongly, to build high-rise buildings, bridges, or nuclear power plants. However, to accurately estimate this risk, you not only need to know where all the faults are, you also need to have some idea of their past form: how often do they rupture? How severe were the earthquakes when they did?
For a decent picture of typical fault behaviour, you need a record of activity stretching over several cycles of strain build-up and rupture. Unfortunately, for a typical fault the period of each cycle can be hundreds of years, meaning that we need data stretching back far further than the advent of seismometers. Instead, we hit the history books; large earthquakes do tend to get noticed and written about, so by looking back at historical accounts of the damage caused by earthquakes you can start to construct a longer-term picture of earthquake activity in a particular area, and hence more accurately estimate the seismic hazard.
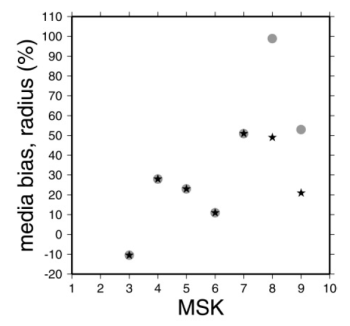
However, a written account is no seismogram, and given our reliance on historical records it is important to get an idea of how eyewitness accounts of severity match up to more objective measures. This is exactly what Susan Hough and Prabhas Pande set out to do in a recent study published in the Bulletin of the Seismological Society of America (doi). They estimated the intensity of the Bhuj earthquake, a large (magnitude 7.6) interplate earthquake which hit India in January 2001, from two independent sources: contemporary media accounts, and an extensive post-quake survey conducted by the Indian Geological Survey. Comparable intensity scales, based on building damage and peoples’ perceptions of shaking in a particular location, were used in both cases. As you would expect, the two datasets both showed the estimated shaking intensity decreased with distance from the earthquake epicentre. However, this falling away happened more slowly in the map produced from the media reports than in the map produced from the physical survey data; the zone estimated from media reports to be affected by a particular shaking intensity was wider than indicated by the more rigorous survey, particularly at higher shaking intensities. Hough and Pande calculated a ‘media bias’ parameter which estimated how much wider the zones based on the media reports were than the zones estimated from the direct survey: the plot below shows that shaking of intensity 4-6 was estimated to extend around 20% further away from the epicentre than it actually did, and shaking of intensity 7 and above about 50% further away.
It is unsurprising that estimates from media accounts, which by their nature tend to emphasise the more extreme destructive events, tend to be overestimates of the actual intensity. This study demonstrates that for large earthquakes, these overestimates can be significant, and need to be taken into account when considering historical earthquake records. What is doesn’t tell us is if the degree of bias can be easily estimated and thus corrected for, or whether it varies significantly depending on the type and location of the earthquake. Establishing that will require many more studies of this kind.