![]() On a map of global earthquake activity, Japan rather stands out right now: a pulsing boil of seismic activity that all but drowns out the shaking in the rest of the world.
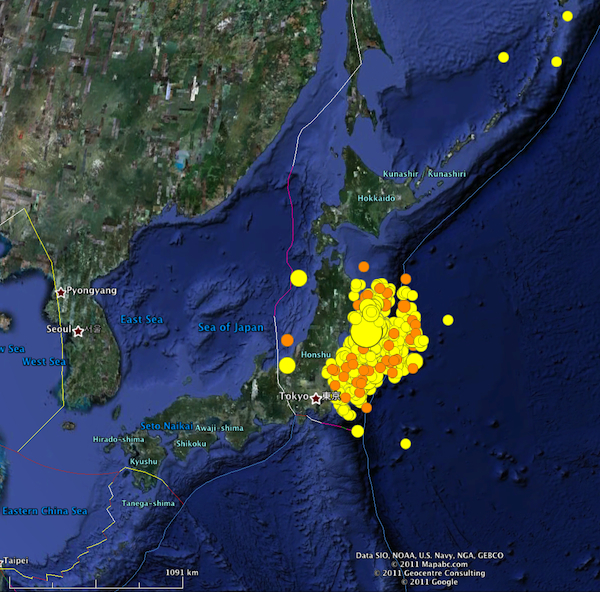
On a map of global earthquake activity, Japan rather stands out right now: a pulsing boil of seismic activity that all but drowns out the shaking in the rest of the world.

The last 7 days of earthquake activity in Japan. Data from the USGS.
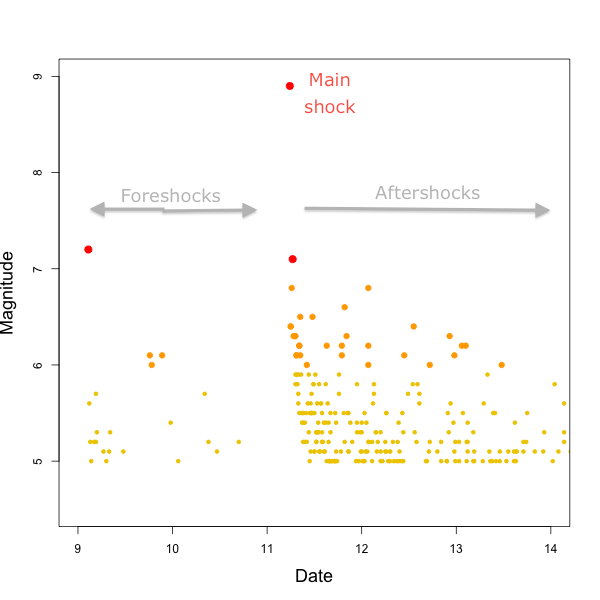
As of a few hours ago (5pm Central Time, 14 March) around 250 aftershocks of magnitude 5 or greater have occurred in the region surrounding the bit of the subduction zone that ruptured last Friday in a magnitude 9 (or thereabouts) earthquake. Around 1 in 8 of those 250 were greater than magnitude 6. Here’s an updated version of the plot of earthquake magnitude against time that I included in Friday’s post.

Magnitude of earthquakes (M5-6=small yellow circles, M6-7 orange circles, M7+ large red circles) off the coast of Honshu, 9-14 March
We can’t predict the timing and location of any particular aftershock any more than we can predict the timing and location of any earthquake before it happens. But records of the number and distribution of aftershocks following large earthquakes in the past show that we can make predictions about the aftershocks in aggregate. These observed relationships can be regarded as seismological rules-of-thumb: we may not be able to calculate them from first principles, but they have proven to be a useful guide to how the crust around a fault behaves after it ruptures.
So, what are these rules-of-thumb? Firstly, the frequency of aftershocks falls away at a rate inversely proportional to the time since the earthquake. What this means is that if there are 60 aftershocks in the first 24 hours after the main shock, then there will be around half that number – roughly 30 aftershocks – in the 24 hour period that follows that – and a third of that number – roughly 20 aftershocks – in the 24 hour period that follows that. This relationship holds true whether you are considering every single aftershock, or a subset such as ‘every aftershock greater than magnitude 6.’
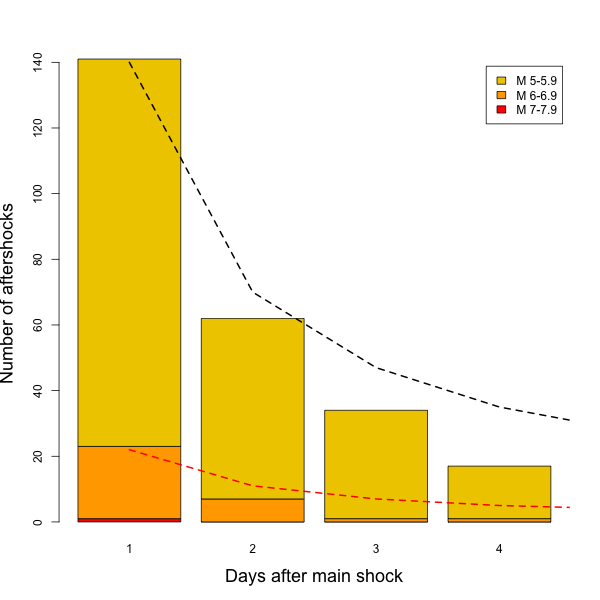
The graph above seems to show a fairly sharp decrease in both the rate and magnitude of the aftershocks since Friday, as we would expect. To show this more clearly I made the bar chart below, which shows the rate of aftershocks in the days following the March 11 quake, along with the ‘predicted’ rates for aftershocks of greater than magnitude 5 (black dashed line) and aftershocks of greater than magnitude 6 (dashed red line)

The fit isn’t perfect, but activity is declining at around the expected rate: although we’ll probably continue to see aftershocks in this region for a few months, they’ll occur at the rate of a few a day rather than lots an hour.
The other rule-of-thumb applies to the magnitude of the aftershocks, and is often expressed as ‘the largest aftershock will be one unit below the magnitude of the main shock.’ If so, the largest aftershock of Friday’s magnitude 9.0 would come in at around magnitude 8.0, which is a pretty sizeable earthquake in it’s own right. Thus far, the largest aftershock of the Sendai earthquake has been a magnitude 7.1 that occurred less than an hour after Friday’s main shock. Should the Japanese be worried, then? Not necessarily. According the the USGS page on aftershocks, ‘the difference in magnitude between the main shock and largest aftershock ranges from 0.1 to 3 or more, but averages 1.2’, so it seems that there’s a bit of slop in this particular rule of thumb. [Update: That 7.1 has now been upgraded to a magnitude 7.9 – all the seismic energy still bouncing around in the earth following the mainshock probably mucked up the original estimate. This still doesn’t absolutely rule out another >M 7 aftershock, of course. Thanks to Jascha Polet for the heads-up]. Also, due to the inverse time relationship we’ve already discussed, the likelihood of a large aftershock decreases with time. Conversely, however, a single large aftershock a long time after some earthquakes is not going to show up when looking at many many aftershocks in aggregate, and we’ve had recent proof that such things can happen, although in that case things were a little bit complicated.


Comments (4)
Links (2)-
-
Pingback: Tsunami Video Roundup | Deep Sea News
Pingback: Update: Christchurch aftershocks | Highly Allochthonous