Easily plot magma compositions (TAS diagrams) in Python

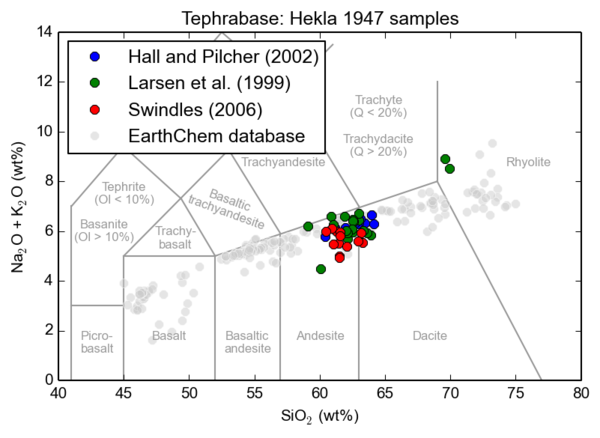
I recently made a total alkali vs silica (TAS) plot to compare the magma of the Hekla 1947 eruption with the compositions of magmas from previous eruptions.  This post contains the code to draw the plot, including a module that draws the different compositional regions for you.

 Total alkali vs silica plots

Volcanic rocks have a range of compositions, and consequently a range of properties.  The most important measure is the proportion of silica (SiO2).  Low-silica magmas such as basalt are more dense, have high melting points and form less-viscous (i.e. more runny) melts than high-silica magmas such as rhyolite.  Eruptions of andesite magma or higher are more likely to explosive and pumice-forming as pressurised gases struggle to escape from the sticky magmas.  Magmas that are rich in alkali metals (Na, K) are typically less-viscous and crystallise slightly different minerals to the lower-alkali compositions.

TAS plots are a graphical representation of the silica and alkali contents of a magma.  The regions on this TAS plot are named with familiar (and unfamiliar) magma types and were defined in a report by Le Maitre et al. (2002).  The TAS classification page on Wikipedia has more information and links to their individual pages.

Example total alkali versus silica plot with the different compositional fields marked.  The plot compares tephra from the Hekla 1947 eruption found in the UK (Hall and Pilcher, Swindles) with in Iceland (Larsen et al) and other eruptions from Hekla volcano. Click to enlarge.

Example total alkali versus silica plot with the different compositional fields marked. The plot compares tephra from the Hekla 1947 eruption found in the UK (Hall and Pilcher 2002; Swindles 2006) with in Iceland (Larsen et al. 1999) and other eruptions from Hekla volcano. Click to enlarge.

The plot shows that the Hekla 1947 eruption was dacite-andesite in composition.  As you might expect for this composition, it began explosively (showering southern Iceland with pumice and ash for a few hours) before going on to produce lava flows for over a year.  The data were downloaded from Tephrabase and EarthChem databases, respectively.

 tasplot.py

The following code was used to draw the TAS plot above.  I wrote a module, called tasplot, with the code that draws and labels the fields via the add_LeMaitre_fields() function.  All the other commands are typical for plotting with Python and Matplotlib.

Follow the instructions on the BitBucket repository page at https://bitbucket.org/jsteven5/tasplot to install.  You can browse the source code of tasplot.py directly by clicking here.

# Import plotting modules
import matplotlib.pyplot as plt
import tasplot  # This imports the tasplot module

# Set up figure
fig = plt.figure()  # create figure
ax1 = plt.subplot(111)  # create axes and store as variable
tasplot.add_LeMaitre_fields(ax1)  # add TAS fields to plot

# Note that you can change the default colour and font size e.g.
# >>> tasplot.add_LeMaitre_Fields(ax1, color='red', fontsize=8)

# Plot the data (from pre-existing variables)
ax1.plot(hallpilcher_silica, hallpilcher_alkali, 'o', alpha=1,
         label='Hall and Pilcher (2002)')
ax1.plot(larsen_silica, larsen_alkali, 'o', alpha=1,
         label='Larsen et al. (1999)')
ax1.plot(swindles_silica, swindles_alkali, 'o', alpha=1,
         label='Swindles (2006)')
ax1.plot(earthchem_silica, earthchem_alkalis, 'o',
         color=(0.8, 0.8, 0.8), alpha=0.5, mec='white',
         label='EarthChem database', zorder=0)

# Decorate the plot
plt.xlabel(r'SiO$_2$ (wt%)')  # Use LaTeX notation for subscript
plt.ylabel(r'Na$_2$O + K$_2$O (wt%)')
plt.legend(loc='upper left', numpoints=1)
plt.title('Tephrabase: Hekla 1947 samples')
plt.savefig('Tephrabase_Hekla1947.png', dpi=150,
            bbox_inches='tight')

#
Categories: Uncategorized

Holuhraun fieldwork videos

When we sing Auld Lang Syne and raise a glass to 2015 on Wednesday, the eruption of Bárðarbunga volcanic system, Iceland, will have been going for four straight months. In that time, the eruption has covered over 80 km2 (1.3 Manhattan islands) of sandy outwash plain at Holuhraun, to the north of the Vatnajökull glacier, with a jumble of jagged black basaltic rock ranging in thickness from the height of a car to more than the height of a house.

By all measures, the eruption is slowing. The seismic energy released by earthquakes in the dyke (underground crack) that carries the magma to the surface is one ten-thousandth of what it was as the dyke was forming. The subsidence of Bárðarbunga caldera, probably caused by draining of magma away from the volcano and out to feed the lava, dropped from over 80 cm per day to less than 25 cm per day; the accompanying magnitude 5 or larger earthquakes there, which used to happen every day, can now be a week apart or more. Satellite measurements of heat flux show a decline from over 20 gigawatts in early September (to put this amount of energy in context, the average UK electricity demand in 2012 was 36 gigawatts), to fewer than 5 gigawatts by the end of November.

This doesn’t mean that the eruption will stop soon. Like the weakening spray from an aerosol can, the eruption rate declines exponentially.  The lower the flow, the more slowly it declines.  SSKKKOOOOSSSSSSHHHHH ..ssshhhssshhhssshhhssshhhssss ..sssssssss..ssssss ….sssss……sssss……sss! Icelandic scientists have predicted that it has ‘at least some months’ more to go. From initial rates of up to 1,000 m3/s, an average of 200 m3/s through September, the eruption rate in November was less than 100 m3/s.  This still corresponds to a healthy river of lava; the mean flow of the Thames through London is around 60 m3/s.  Effusion rates of less than 5 m3/s are typical of recent Hawaiian eruptions.

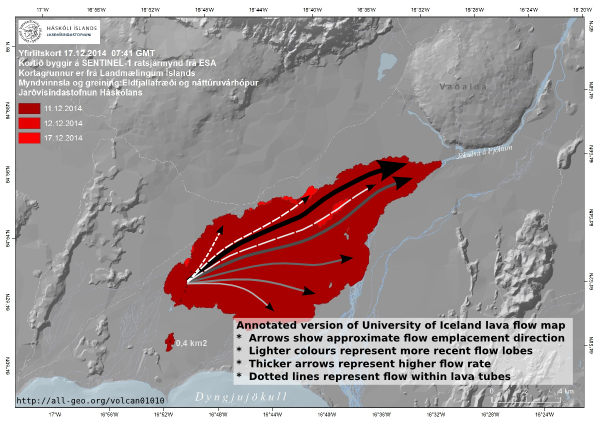
An interesting development is that the lava is now flowing through covered tubes. These are better insulated than open channels so the lava cools much more slowly (as little as 1°C per kilometre) and can travel further. I’m personally hoping that this means that the lava will extend further to the northeast, reaching Vaðalda and blocking the Svartá river that flows into Jökulsá á Fjöllum from the northwest (see map) to create a new lake.

Holuhraun lava flow field map, 24 December 2014 by Institute of Earth Sciences, University of Iceland modified to show the evolution of the flow field.  Source: http://en.vedur.is/earthquakes-and-volcanism/articles/nr/2947#des25 Click to enlarge.

Holuhraun lava flow field map, 24 December 2014 by Institute of Earth Sciences, University of Iceland modified to show the evolution of the flow field. Click to enlarge. Source: http://en.vedur.is/earthquakes-and-volcanism/articles/nr/2947#des25

Holuhraun Fieldwork Videos

The main purpose of this post is to share some videos that I recorded when I joined University of Iceland scientists studying the eruption in September. You can read about the trip and see photos in my Fieldwork at the Holuhraun post.

Fire fountains at the vent

This was filmed over a kilometre from the vent. The craters are over 50 m high, the fire fountains are 50 m above this. The lava sprays in the air powered by expanding gases, just like a Hogmanay champagne bottle. A few days after I filmed this, the craters filled with lava to become a churning lake of molten rock. There is spectacular drone footage of this on YouTube. A river of lava drains from the craters to feed the flow field. At the end of the clip you can see Suðri, a crater that was active at the beginning of the eruption.

In the foreground is the pale grey sand plains that extend north of the Vatnajökull glacier. All the darker material on top was produced by the eruption. The clouds above are mainly steam (+ sulphur dioxide, carbon dioxide, hydrogen chloride and other pollutants). The gas and the magma can easily separate, so there is no ash. This is why the eruption hasn’t affected aircraft or had nearly as much news coverage as it deserves for being Iceland’s largest eruption since 1783.

A ‘breakout’ on the lava flow

Every that you initially see here is lava. The coarse blocks formed as part of an early flow lobe that remains molten inside. Hot lava pours from a ‘breakout’ to form a smaller flow at the edge. The orange-yellow material has a temperature of over 800°C. Even standing 5 m away, the heat was intense. As the surface cools it solidifies to form a crust, like wax from a candle. This is broken by movement of the hot lava beneath and carried on the surface of the flow.

Sampling the lava

A University of Iceland scientist samples the active lava flow. The steel shovel has a melting point of around 1400°C so it doesn’t melt. Also, lava (rock) is a poor conductor of heat. The sample is dropped into a large metal saucepan and quenched by pouring water into it. Analysis of such samples has confirmed that the magma originates in Bárðarbunga volcanic system and estimated that it was last stored at a depth of 9-20 km beneath the surface. Future analysis of such samples will help explain why the eruption has produced so much sulphur dioxide pollution.

GPS mapping of the flow outline

One task at the eruption site was driving around the edge of the lava flow recording the tracks by GPS in order to map the extent of the flow. At the start of the eruption, the flow front advanced by hundreds of meters per day and the lava buried an area the size of a football pitch (soccer field) every 7 minutes. Now, the area of the flow field only increases slowly.  This is partly because the eruption rate has declined and partly because much of the new lava flows over or through the older material, contributing to the thickness of the flow instead.

Off road driving is illegal in Iceland, but the scientists obtained special permission to survey the lava. The tracks that you can see have since been buried beneath the extending flow. The most recent maps of the flow field are made from radar data collected by satellites, which has the advantages that it can cover the whole flow field instantaneously and that it works at night or in clouds. The downside is that it can be many days between measurements so it can miss rapid changes.

I like this video because it conveys the scale of the lava flow. You can see its height and the fridge-sized blocks on the original flow lobe. Reactions with the atmosphere have turned the surface pale. You can see all the fresh breakouts, dark and slabby, that still glow red inside in places. You can see how the wall of lava extends on and on into the distance. The NW margin of the flow was over 16 km long and it took 45 minutes to drive its full length.

Four months ago, this whole area was a flat and barren sandy plain. How will it look when we are toasting the arrival of 2016?

Happy New Year!

Further reading

As always, the best information on the eruption comes from the Icelandic scientists. Check out the Icelandic Met Office and the Institute of Earth Sciences pages for frequent updates from the Bárðarbunga Science Board. There are cool fieldwork photos on the Institute of Earth Sciences Facebook page.

The Fieldwork at Holuhraun post has more photos and explanations of the eruption.  You can find a list of my posts on Bárðarbunga and Iceland in general in the Every Post Ever page.

Categories: Uncategorized

Alaskan ash in Ireland: context, implications and media coverage

Long-range transport of volcanic ash was in the news last week, thanks to a recently published study by an international team of scientists, led by Britta Jensen and Sean Pyne-O’Donnell from Queen’s University in Belfast. They showed that volcanic ash grains found in Ireland had come from an ancient volcanic eruption 7000 km away in Alaska. This must have been an impressive ash cloud!

The study is a really nice example of scientific detective work, where different pieces of evidence are pieced together to support the conclusion. This post explains what they found and what it means.

How did they find the ash?

The team extracted tiny quantities of volcanic ash from a peat bog in Northern Ireland. Needless to say, the grains are extremely small (typically 20-125 microns). Such deposits are called ‘cryptotephra’ (Greek for ‘hidden ashes’; the word ‘tephra’ applies to everything ejected by an explosive volcanic eruption) and are useful as time markers in sediments and lake deposits. If you know that age of the eruption that produced a particular layer, you know the age of the sediment in which you found it.
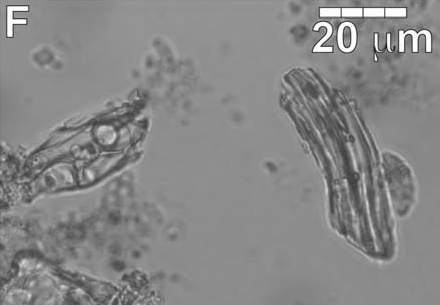
Example of 860AD tephra shards from Sluggan Bog, Northern Ireland.  Modified from Jensen et al (2014).  Click image to view article.

Example of AD860B tephra shards from Sluggan Bog, Ireland. Modified from Jensen et al (2014). Click image to view article.

Cryptotephra are extracted by roasting samples, or digesting them in strong acid, to remove the organic material, then separating the cryptotephra from other sediments using magnets or by floating in them liquids of carefully chosen densities. The grains can then be analysed under a microscope. Databases such as Tephrabase record the layers that have been found. The layer in question, known as AD860B, had been recognised in Northern Ireland, Germany and even cores from the Greenland ice sheet.

The mystery was where it came from.

How do they know it came from Alaska?

Structurally, volcanic ash is a type of glass; all the atoms that were jiggling round freely in the molten magma were suddenly frozen in place when it quenched in the atmosphere. An electron microprobe fires a beam of electrons into the glass, exciting the atoms to give off x-rays. The x-rays from each element in the sample (O, Si, Al, K, Na, Fe etc.) have their own characteristic frequency so, by recording the energy released at each one, you can calculate how much of each element is present. Jensen’s team used electron microprobes to measure the chemical composition of the ash, looking for the clues about the source volcano.

Most European cryptotephras come from Iceland, but the compositions of AD860B didn’t match any known Icelandic eruptions, especially when comparing the aluminium and iron content. The data are a much better match to tephra from Alaska’s Wrangell volcanic field.
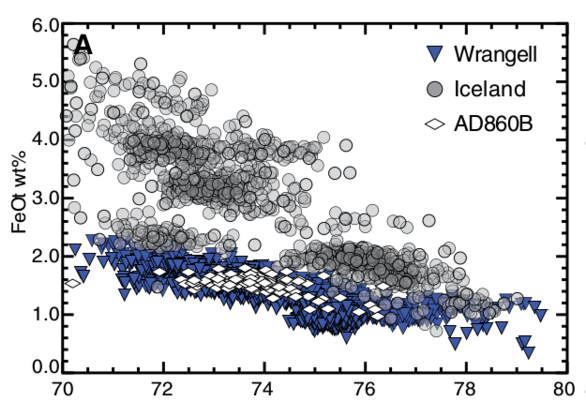
Major element geochemistry plot from Jensen et al (2014).  Click image to view article.

Major element geochemistry plot modified from Jensen et al (2014). Click image to view article.

Alaskan and Icelandic tephra have different compositions because of their different tectonic settings. Alaskan volcanoes are located on a subduction zone, where the Pacific tectonic plate is pushed underneath North America. Iceland is located on the mid-ocean ridge that runs through the Atlantic. The aluminium and iron contents of magma can be affected by crystallisation of a mineral called amphibole, which contains both elements and is commonly found in subduction settings but not mid-ocean ridges.

How did they know which eruption it was from?

Having identified a subduction zone volcano source, many candidates remain.  Alaska, British Columbia, the Cascades and even Kamchatka or Japan are all upwind of the sample sites. Three lines of evidence were used to link the cryptotephra to an eruption of the Bona-Churchill massif volcano in Alaska that produced a widespread deposit called the White River Ash.

  • There is excellent agreement on the age of each of the different deposits. Carbon dating of peat in Ireland gives a relatively wide age range of 776-887 AD. Carbon dating an Alaskan spruce tree killed by the eruption gave an age range of 833-850 AD. Ice-core tephras can be dated very precisely by counting annual layers in the ice. This gave an age of 846-848 AD.
  • The geochemistry of the tephrochronology and ice core samples all fall within the range of the White River Ash (red dots on figure).
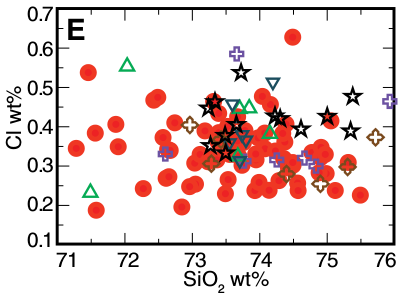
Comparison of distal tephra geochemistry with White River Ash (red circles).  Modified from Jensen et al (2014).  Click image to view article.

Comparison of distal tephra geochemistry with White River Ash (red circles). Modified from Jensen et al (2014). Click image to view article.

  • The texture of the cryptotephra grains is similar to those examined from the White River Ash.

How does this compare to other findings?

Volcanic ash grains can travel a long way from their source. In 2011, satellites recorded ash from the eruption of Puyehue-Cordón Caulle, (Chile) circle the globe. Very distal deposits can also be identified. Last year a French team revealed that the source of a cryptotephra deposited in Greenland around 1257 AD was Samalas volcano, 13,500 km away in Indonesia. Impressively, the same layer has also been found in Antarctica. But these cryptotephra were found in ice cores. It’s much easier to find ash in ice cores because there is less contamination and because volcanic sulphate deposited at the same time forms an ‘acid spike’ that gives researchers clues where to look. Also, the grains are tiny (<5 microns), which means that they could have remained in the atmosphere for weeks before being deposited.

It is much harder to extract cryptotephras from soils or sediments, and the most distant of these typically have ranges of 2,000-3,000 km, e.g. Saksunarvatn (Grímsvötn, Iceland) ash in Slovenia or the Campanian Ignimbrite (Campi Flegrei, Italy) ash in Russia. The Queens University Belfast team already pushed that limit when they found the White River Ash and a number of tephras from volcanoes on America’s west coast in Newfoundland on the east, over 5,000 km away. Until now, there was only one example of cryptotephra found 7,000 km downwind after an intercontinental journey; ash from an eruption of Toba (Indonesia) 75,000 years ago had been found in Lake Malawi, Africa. But the Toba eruption was huge – 2,500 km3 tephra erupted – while the White River Ash is only 50 km3.

What are the implications?

Linking the AD860B ash to an Alaskan eruption raises the possibility that other unidentified cryptotephra layers also came from North America and not just from Iceland. The size of the ash reminds us that volcanic ash grains tens of microns in diameter can travel long distances. This agrees with our finding that ash deposited in the UK from Iceland’s 2011 Grímsvötn eruption came from the bottom 4 km of the plume.

The big grains also indicate deposition from a relatively concentrated ash cloud, rather than after weeks of dilute stratospheric drifting. This highlights the possibility of ash clouds from Alaska causing disruption not only in America, but across in Europe as well. It is important to be aware of this and to plan for it.

It is significant that the eruption producing the White River Ash was not huge. The size of volcanic eruptions is described by the Volcanic Explosivity Index. Small eruptions (VEI 3: up to 0.1 km3 tephra), such as the recent eruption of Pavlov volcano happen somewhere on the planet at least once per year, on average, causing only local aviation disruption. Eruptions like Toba (VEI 8: >1,000 km3 tephra) happen less than once in 10,000 years. This is a good thing.  If a similar eruption happens again, missing your holiday will be the least of your worries.

An eruption of 50 km3 (VEI 6) happens about once every 100 years on average. To evaluate the threat to Europe, you also have to consider the proportion of volcanoes capable of such an eruption that are located in Alaska and how often the wind blows in the right direction. The answer will be in the cryptotephra record.  We are probably talking about a couple of transatlantic ash events per millennium. If it was much more, there would be many more non-Icelandic layers in European sites. Ash from Alaska’s 28 km3 Katmai/Novarupta eruption in 1912 has been found in Greenland. Is it also in Europe, sitting beneath Katla 1918?

A few events per millennium is nothing to panic about, but if you think that it isn’t worth considering at all, bear in mind that Iceland’s ongoing Holuhraun eruption topped 1 km3 of lava last month.  It now qualifies as a large magnitude fissure eruption: a once in 270 years event.  These things can and do happen.

Media coverage

When I read the coverage of this story on the BBC website, I tweeted the following in dismay:

I took exception to the word imminent. Learning that transatlantic ash clouds have happened before doesn’t mean that one is about to happen now. Why would they say that, especially given the centuries-long gaps between such events? And why would the Telegraph and the Mail Online say the same, adding that such eruptions are scheduled to happen every 100 years?

Unfortunately, the wording can be traced back to the original press release, which contains the following line:

“With volcanoes like Mount Bona-Churchill – much more volatile than Eyjafjallajokull – scheduled to erupt on average every 100 years, another ash-cloud drama could be imminent, this time with consequences for trans-Atlantic as well as European travel.”

Universities are now judged on the ‘impact’ of their research, so getting widespread news coverage is important to them. However, exaggeration like this is really poor form by the Queen’s University Belfast press office. It’s also a pretty bad reflection on the churnalists who seem to have cut and pasted the story without reading the paper or getting a second opinion.

Further Reading

Original paper (Open Access):

Jensen BJL, Pyne-O’Donnell S, Plunkett G, et al (2014) Transatlantic distribution of the Alaskan White River Ash. Geology 42:875–878. doi: 10.1130/G35945.1

Other coverage:

Blog posts:
Categories: Uncategorized

Easily plot data on a Google Maps background with the QGIS OpenLayers plugin

It has never been so easy to overlay your data on a background of satellite images.  This post explains how to do it using QGIS, which is free/open-source software. This gives it the huge advantage that you can download it and install it on as many computers as you want. It is very easy to use, and once you have your data into a Geographic Information System, you can then perform other analysis.

Save your image

1 – In the field

This part is obvious: make a note of the location where you take a measurement/sample! The easiest way is to use GPS and to make a new waypoint for each location. Write the coordinates in the notebook, too, as a backup.

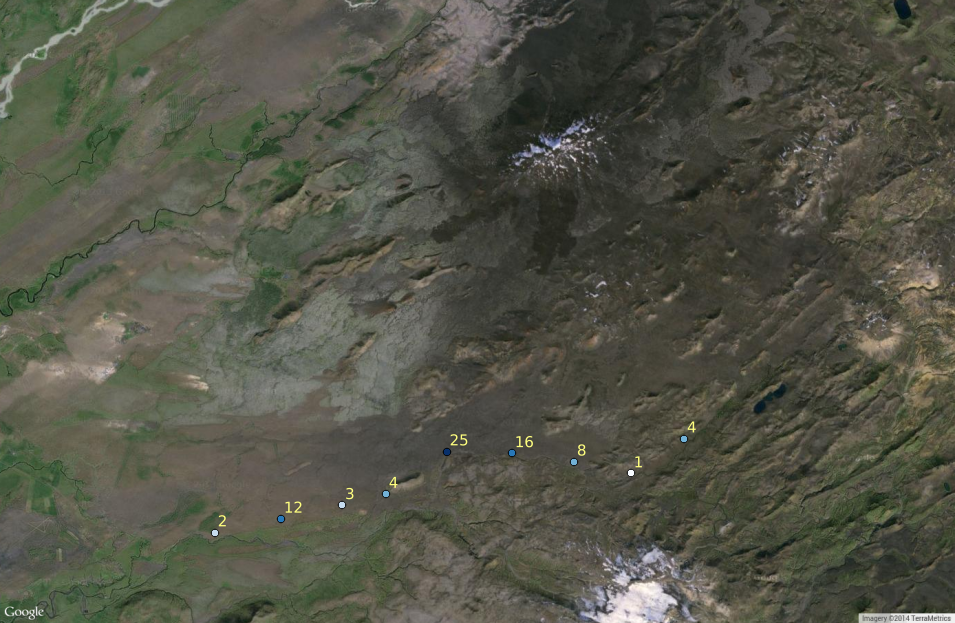
In this case, the data are the thickness of tephra (pumice, ash and other volcanic debris) deposited by the 1947 eruption of Hekla. The local wind was blowing towards the south, before swinging around to deposit volcanic ash across the UK and Ireland then over to Finland.

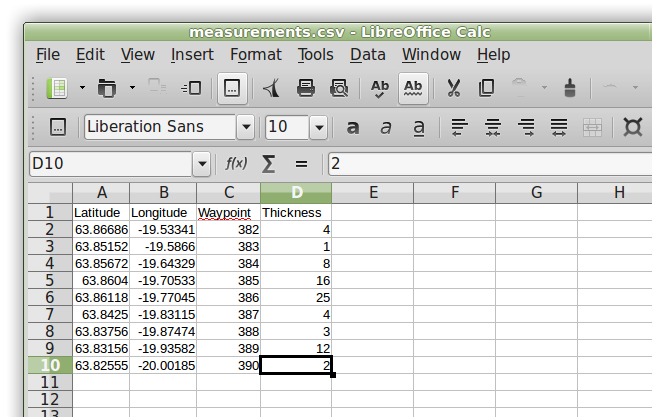
2 – Preparing a CSV file

We are going to load the data into QGIS from a plain-text comma-separated values (csv) file. Most GPS software should be able to export waypoints in this format. The free/open source GPSBabel software can download data directly from a GPS or convert between different formats. It has a graphical user interface and command line version. An example command to extract the waypoints from a .gpx into a .csv file is below:

gpsbabel -w -i gpx -f gps_data.gpx -o csv -F measurements.csv

Open the .csv file in a spreadsheet or text editor and make the following changes:

  • Add a row of column names at the top. Include as many extra columns as you need for your data (e.g. Latitude, Longitude, Waypoint, Thickness, Grainsize, SampleNo).
  • Add your measurements to the data columns.

edit_csvThen save and close the file. If you don’t have a GPS, you can make a blank spreadsheet and type in your own coordinates by hand.

3 – Loading into QGIS

Add Delimited Text Layer

  • Open QGIS and click on ‘Add Delimited Text Layer’, then select your file.
  • If it doesn’t do it automatically, set the X and Y fields for your data.
  • Press OK and your data should appear as a new layer.
  • Double check that the Coordinate Reference System is correct by right-clicking your data and selecting Set Layer CRS.
    • For raw GPS data, use WGS 84 (represented by Authority ID EPSG:4326)
    • UK Ordnance Survey coordinates are EPSG:27700

Select Coordinate Reference System

  • Next, make your data prettier, using the Properties dialog (right click).  We are going to change the symbols depending on the Thickness value and print the data alongside it.  Features like this make using QGIS is much better than using Google Earth.

Set the style

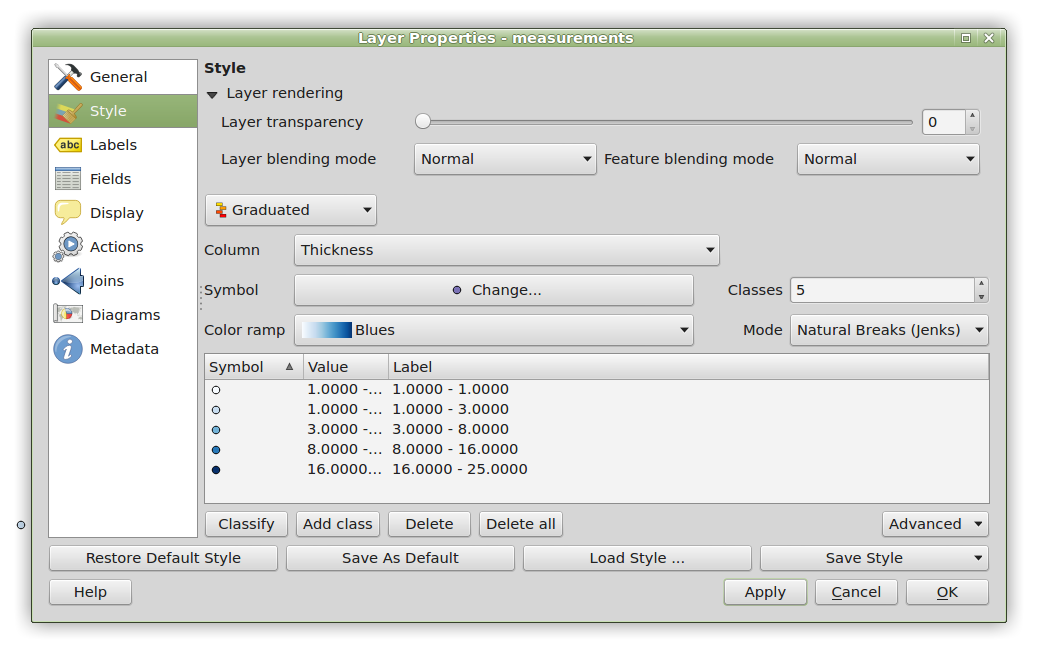
  • Choose a Style for your data. I have used graduated colours based on Natural Breaks in my Thickness data.
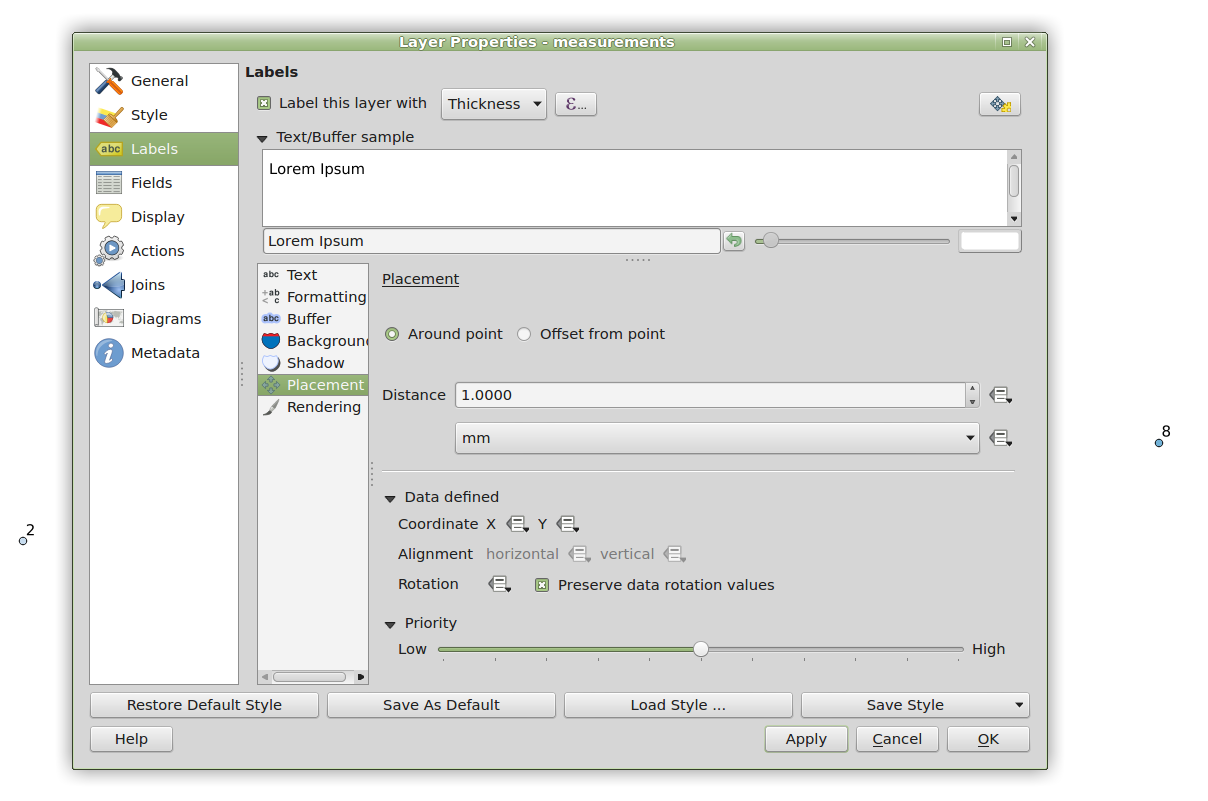
  • Use Labels to print the data values beside the points. I have selected the Thickness column and placed the text 1 mm away from the data. You could also use the Waypoint number or other data such as Sample Number.

Set the labels

4 – Plot the background map

Load OpenLayers background

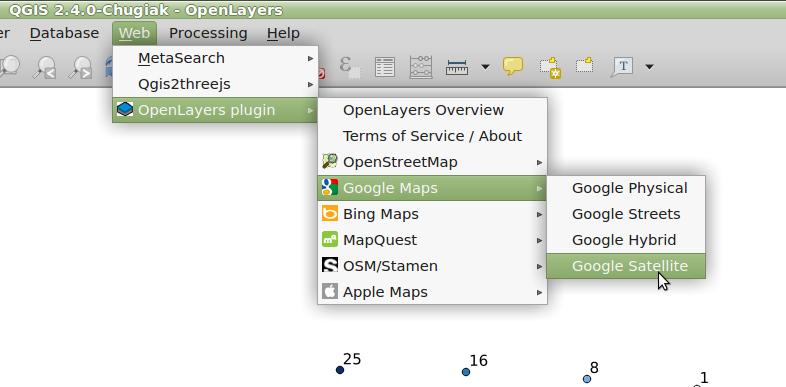
  • Use the OpenLayers plugin (from either the Web menu or the Plugins menu, depending on your version) to choose a background map.
  • Drag it to beneath your data layer in the Layers panel, then pan and zoom to get the map that you want.
  • Voila! Pretty easy, eh? You can save a copy using Project > Save as Image…

5 – Other tips

  • Experiment with the other layers. Sometimes Bing Aerial layers are better than Google. Google and Bing may have copyright restrictions for professional use. Open Street Map is a really clean map background, Open Cycle Map has topographic features.

Experiment with other layers

  • Sometimes the OpenLayers map opens to show the whole world. In this case, right click on your data layer and select ‘Zoom to layer’.
  • Sometimes the OpenLayers map doesn’t download all the tiles, leaving blank spaces. In this case, just pan the map a tiny bit and it should reload.
  • The OpenLayers plugin only works online. To make a map available offline, turn off all layers except the OpenLayers background, then Save as Image…. Notice that as well as saving the image, a ‘World File’ (e.g. bg_googlesatellite.pngw) is created that contains georeferencing information for the map. As long as you keep the two files together, you can load the map back in directly as a raster map with Add Raster Layer…. You will need to set the Coordinate Reference System; by default this is EPSG:3857 for OpenLayers maps.
  • If you select ‘watch this file’, then your maps will update with changes to the data.
  • Use the QGIS Map Composer to make a more formal map with title, scale bar etc.

Further reading

QGIS and GPSBabel can be installed on Ubuntu-like Linux systems with a single command:

sudo apt-get install qgis gpsbabel
Comments Off on Easily plot data on a Google Maps background with the QGIS OpenLayers plugin
Categories: Uncategorized

Fieldwork at the Holuhraun

Last week I joined the team from the Institute of Earth Sciences at the University of Iceland who are on the ground monitoring the eruption of the Holuhraun. This post is a description of the eruption and the monitoring work taking place. It is based on tweets sent out when I was away.


Surveying the fire fountains

The eruption is a fissure eruption, which began with a curtain of fire as magma sprayed from the ground. By the time I arrived the activity had focussed onto a few main vents. The main vent is named Baugur and has built a cone about 50 m tall. Using surveying equipment gives accurate measurements of the heights of the cones and the fire fountains.

The vents are spectacular once night falls. When bursts of lava fountain into the air they light up the whole surroundings and even from 1 km away you can feel the heat on your face.

Describing the points that we were surveying is easiest with a sketch. It was a geologist’s dream to annotate, too.

Infrared cameras measure the temperatures of distant objects. The fire fountains were over 850°C. This image uses a temperature scale that shows hotter temperatures as brighter. In real life, you can estimate rock temperatures from the colour, too. Red hot = over 600°C, orange = over 800°C.

The hot air above the vent rises quickly, and it carries the smallest, lightest particles with it. These scoria (basaltic pumice) fall to the ground downwind. Sampling them is useful because we know exactly when they formed. Analysing their composition will give a value for that particular time.

Larger particles fall close to the vent and build up the craters. They are often still molten when they land and the deposits are called spatter. The current eruption is referred to as the Holuhraun eruption because it is erupting onto a lava field, originally formed during eruptions in 1797 and 1862, which is called the Holuhraun.  The old cones are still present, and the new eruption has even reoccupied some of them.


Mapping the lava flows

The Holuhraun lava flow is growing amazingly quickly. It’s just three weeks old, but it’s as thick as a 2-storey house is high and to run around it would be about as far as a marathon. Another job is mapping the outline by driving alongside it in a 4×4. GPS data are compared to see the changes each day.

Unfortunately, it is now only possible to do this on the NW side.  The route around the flow front in the NE is blocked by the Jökulsá á Fjöllum river and there are deep cracks in the ground at the SW end near the vents.  This is a big disadvantage: when it seemed to us that the lava flow rate was slowing, it was actually growing more to the east.

Measurements from aircraft or satellites can be used to record growth on the SE side of the flow. These are very useful, but are sometimes limited by weather, resolution or the timing of satellites passing overhead.  Measurements from both methods are combined and published on the Institute of Earth Sciences website.

The front of the lava has stopped advancing since reaching the river where it is cooled by the water. Instead, the flow prefers grow sideways, with lava breaking out from the molten centre of the flow and spreading across the flat plains.

Study of the advancing lava is concentrated on the breakouts. Time lapse video shows how they move. Samples can reveal how the lava has crystallised and lost gas in the interior of the flow. Thermal images record variations in surface temperature. The latter are important because cooling of the lava can limit how far the flow can grow; the hotter the surface, the faster it is losing heat.

Flowing lava is molten rock, so, unsurprisingly, has a similar density to solidified rock. This means that chunks of solidified lava can float in the flow, especially if they have lots of air gaps and most of their bulk is submerged, like an iceberg. A great example of this are balls of spatter over 2 m in diameter that can be found kilometres downstream from the vent. These were originally part of the cone, but must have collapsed and been swept away by the flow.


Sulphur dioxide pollution

A striking feature of the Holuhraun eruption is the amount of gas being released, in particular sulphur dioxide (SO2). The plume is so clear that it was visible from the aeroplane window as I flew over the south coast of Iceland on the way from Edinburgh. It is also prominent on the drive south to the eruption from Mývatn.

Closer in, it rises from the fissure like smoke. Written Icelandic records refer to past eruptions as ‘fires’. It is easy to see why. Back in the 80’s, I remember when farmers in Scotland used to burn stubble and unwanted straw in their fields. Lines of orange flame ran hundreds of metres across the ground, shimmering in the heat haze, while blue curtains of smoke rose above. It turns out that a fissure eruption looks just the same, but on a much bigger scale.

The way the gas dominated the whole experience got me wondering why I hadn’t paid it much attention before.

In fact, it is a really serious concern at the eruption site. The area is closed off to the public, and those with permits to be there have to bring safety equipment.

The concentrations reach dangerous levels near the plume or near breakouts. Many more dead birds have been found in the past week since I got back. Even hundreds of kilometres away across Iceland, people are advised to stay indoors if the gas is blowing their way and the Icelandic Met Office has begun producing forecasts of where the concentration will be highest.

If you don’t feel 100%, it isn’t always easy to identify the cause.

The gas plume had a strong effect on the sun, cutting down the brightness and turing it red/pink. It makes you think that descriptions of ‘blood red’ suns during the devastating 1783 Laki fissure eruption were not exaggerations.

The effect was particularly weird in the middle of the day, when the sun should be high and bright.


Gas-induced tourism

When the gas plume went directly over the mountain hut where we were staying at Askja, about 25 km north of the eruption site, we decided to retreat to Mývatn. This was also an opportunity for much needed vehicle repairs and maintenance. It was also a chance to take in the local geology.  In particular, Hverfell is a tuff cone formed by the explosive interaction of a basaltic fissure eruption with groundwater or a lake.

I was especially pleased to see the Hekla 3 and Hekla 4 tephra layers, as my current research project is reconstructing these two huge ancient eruptions.  This ash had travelled over 200 km to be deposited at Mývatn.


Sources of good information

The best source of information on the ongoing Holuhraun eruption and unrest at Bárðarbunga is the Icelandic Met Office website. Click the links on the top banner for access to the latest monitoring information. I posted other useful links in my last post.

The following are some recent additions.


Acknowledgement

I’d like to thank the Royal Society of Edinburgh and Marie Curie Actions for providing funding for this trip. I’d also like to thank the University of Iceland for having me and for making sure that I got home in time to see Scotland decide its future.

If you enjoyed this post, you can read about the 12 hour glacier crossing and tephra wilderness adventure that I had when I worked with Icelandic scientists on the deposits of the Grímsvötn 2011 eruption.  You can follow the blog on Twitter at @volcan01010.

Categories: Uncategorized

Bárðarbunga – three weeks of tweets

It’s been over 3 weeks since unrest began at Bárðarbunga, and nearly a fortnight since the fissure eruption began at the Holuhraun.  It’s come at a busy time, so I haven’t managed to blog as much as I would have liked to.  I have been trying to provide context and interesting information via the @volcan01010 Twitter account instead.  This post is a compilation of tweets from the past few weeks.

I’m leaving for Iceland this afternoon to join the team of geologists from the Institute of Earth Sciences at the University of Iceland who are monitoring the lava flow.  I’ll be away for a week and hope to keep you updated from the field.

Enjoy.

Sources of good information


https://twitter.com/lithospheric/status/507832883545776129

Bárdarbunga monitoring and context


https://twitter.com/marco_bagnardi/status/505479368077230080

Holuhraun / Bárðarbunga videos and pictures

Iceland geology

Links to my blog posts

Categories: Uncategorized

Bárðarbunga – turning Dettifoss into Niagara Falls

While international concern about an eruption at Bárðarbunga is focussed on flight disruption, a jökulhlaup (meltwater flood) is the most destructive potential outcome of a subglacial eruption. It would travel north from the glacier along the Jökulsá á Fjöllum river, and for this reason roads have been closed in the area. Edwin Baynes is a PhD student at Edinburgh University who studies past jökulhlaups in this area. In this guest post, he puts such a potential flood in context.


Turning Dettifoss into Niagara Falls

An Icelandic geophysicist, Magnús Tumi Guðmundsson, has predicted that if a subglacial eruption were to occur at Bárðarbunga, the meltwaters could increase the discharge in the Jökulsá á Fjöllum river by 10 or 20 times (to 2,000 – 4,000 m3 s-1). He describes such a flood as ‘not catastrophic‘ because it is smaller than the jökulhlaups caused by the 1996 Gjálp eruption (45,000 m3 s-1), which washed away the Skeiðarásandur bridge in South Iceland, or the estimated discharge for the Katla 1918 flood (300,000 m3 s-1). It is still very serious, however, and has potential to inundate the landscape and destroy important infrastructure such as bridges and farms. The map below shows the areas most likely to be affected.

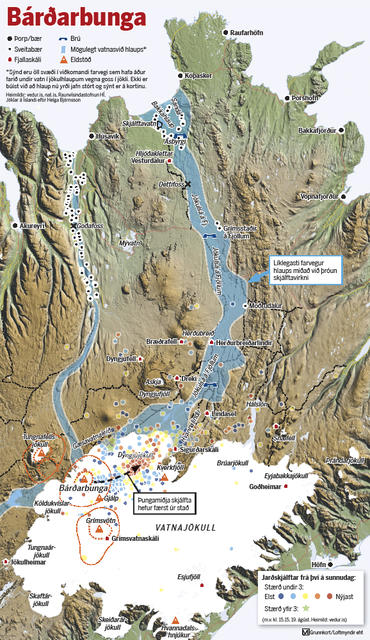
Area most likely to be affected by jökulhlaup following subglacial eruption at Bárðarbunga. Published by Morgunblaðið – click image to see original article.

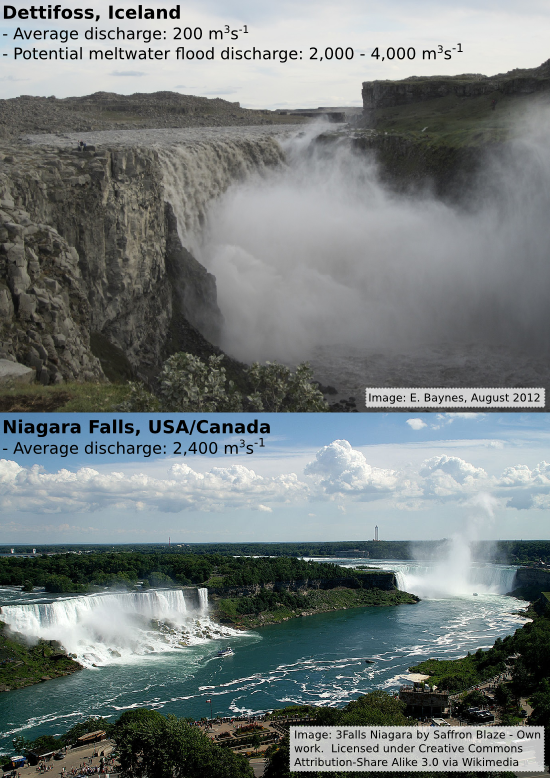
Jökulsá a Fjöllum contains some pretty impressive waterfalls, the most notable of which is Dettifoss. With a vertical drop of around 50 m and a peak summer discharge of 300-400 m3s-1, it is reputed to be ‘Europe’s most powerful waterfall’. Sci-fi fans may recognise it from the start of Prometheus, much of which was filmed in Iceland.

For comparison, the average discharge of the Niagara river is ~2,400 m3s-1 at Niagara Falls. Although Niagara Falls and Dettifoss have similar vertical drops (~50 m), Dettifoss is much narrower (~100 m wide vs ~700 m). A 20 times increase in discharge would mean a significant rise in water level within the channel, increased erosion and a possibly even an upstream retreat of Dettifoss waterfall by a short distance.

    A jökulhlaup down the Jökulsá á Fjöllum river following a subglacial eruption at Bárðarbunga increase the discharge over Dettifoss to levels similar to Niagara Falls.

A jökulhlaup down the Jökulsá á Fjöllum river following a subglacial eruption at Bárðarbunga could increase the discharge over Dettifoss to levels similar to Niagara Falls.

Evidence for past jökulhlaups

Although rare on a human timescale, the Jökulsá á Fjöllum is no stranger to jökulhlaups. There are historic reports of powerful floods in the 17th and 18th centuries that destroyed farmland further downstream from Dettifoss.  There have also been numerous prehistoric jökulhlaups of varying magnitude over the last 10,000 years, since most of the ice retreated from Iceland.  Alho et al. (2005) used computer models to estimate the discharge that would be necessary to produce the water levels indicated by the highest boulder deposits and the highest fluvially-washed surfaces along the channel. Their result was 900,000 m3s-1. This is more than triple the flow of the Amazon and close to rivalling some of the biggest ‘megafloods’ that have ever occurred on Earth.

As expected, such large discharges had a significant impact on the landscape.  The evidence for this erosion by the Jökulsá á Fjöllum river is preserved in the rocks of the Jökulsárgljúfur and Ásbyrgi canyons.

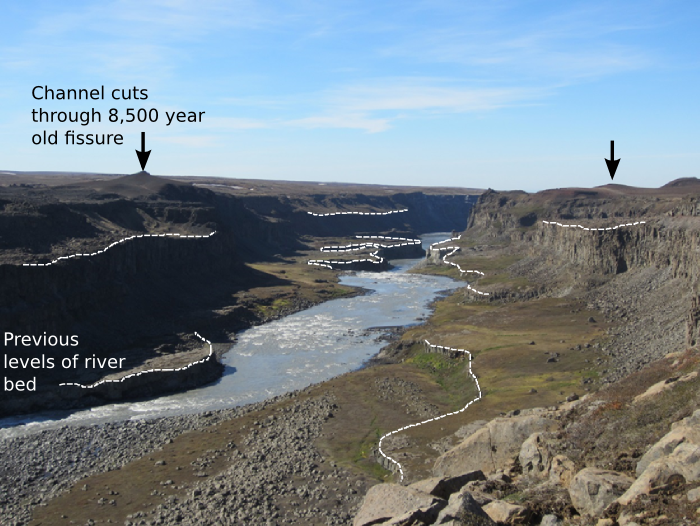
Looking downstream from Dettifoss into the ~500 m wide, 100m deep, Jökulsárgljúfur canyon, carved out by jökulhlaups since the last Ice Age. Photo: E. Baynes, June 2012

Looking downstream from Dettifoss into the ~500 m wide, 100m deep, Jökulsárgljúfur canyon, carved out by jökulhlaups since the last Ice Age. Photo: E. Baynes, June 2012

The canyon is significantly wider than the modern river channel (~100 m wide), indicating that the flow was much greater when the canyon was formed. Within the canyon are strath terraces (white dashed lines) that indicate historical positions of the river bed. The upper terrace is at the same elevation as Dettifoss and has been abandoned due to the retreat of Dettifoss during the largest jökulhlaups. Also shown in the photo is a volcanic fissure that erupted 8500 years ago. The canyon has eroded through one of the volcanic craters, exposing the conduit that brings lava to the surface in the canyon walls. The canyon is therefore younger than the fissure (i.e. <8,500 years).

The product of a catastrophic jökulhlaup

AsbyrgiView

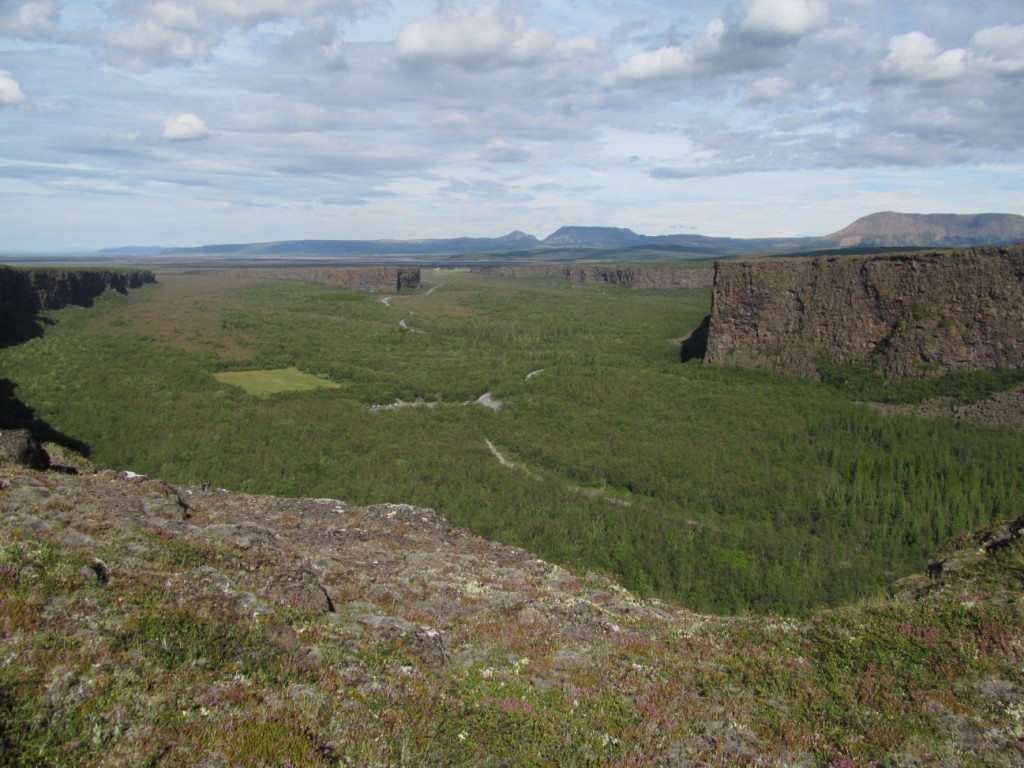
Caption: Looking North into Ásbyrgi canyon. Horseshoe shaped, 3 km long, 1 km wide, up to 100 m deep was carved out during a jökulhlaup that flowed away from where the photo is taken from. The floor of Ásbyrgi is littered with large boulders (some greater than 3 m in diameter) which shows that once there was a high magnitude flow within Ásbyrgi capable of transporting such large blocks. Photo: M. Attal, August 2012

Twenty-five kilometres north of Dettifoss is Ásbyrgi, a vast horseshoe-shaped canyon 3 km long, 1 km wide and up to 100 m deep. According to Norse mythology, Ásbyrgi was formed when Odin’s 8-legged horse, Sleipnir, stumbled and put a hoof down on Earth. However, evidence in the landscape suggests that a more likely hypothesis is that Ásbyrgi was carved during a jökulhlaup along the course of the Jökulsá á Fjöllum.

AsbyrgiRim

The large plunge pool at the base of the headwall at Ásbyrgi. Upstream, the landscape has been heavily scoured and sculpted by the action of water. Photo: M. Attal, August 2012

Large plunge pools are present at the base of the canyon headwall, there is a water-sculpted surface immediately upstream of the canyon and the amphitheatre-shaped canyon head is very similar to features elsewhere such as Box Canyon in Idaho and Dry Falls Lake in Washington. Both of these formed during floods following catastrophic drainage of ice-dammed lakes Bonneville and Missoula, respectively.  Each of these features indicate a jökulhlaup origin for Ásbyrgi and show the potential for catastrophic erosion during jökulhlaups along the Jökulsá á Fjöllum following volcanic eruptions beneath the Vatnajökull ice cap.


Edwin’s PhD project is titled: Constraining bedrock erosion during extreme flood events in Iceland. He researches jökulhlaups in the Jökulsárgljúfur and Ásbyrgi canyons using topographic analysis and surface exposure dating with cosmogenic nuclides. You can find more information on his website at http://www.geos.ed.ac.uk/homes/s1141604/. You can also follow Edwin on Twitter: @EdwinBaynes.

Categories: Uncategorized

Bárðarbunga – waiting and watching

The word on the street in Reykjavík

I’m in the Reykjavík this week on fieldwork. People here have been following developments at Bárðarbunga since the earthquakes began on Saturday. The word on the street is wait and see.

The story is on the radio and in the papers, but it remains the same: lots of earthquakes, some quite large, but no sign of them moving towards the surface.

The Civil Protection Agency have evacuated the highland areas to the north of Bárðarbunga. If an eruption happens beneath the glacier, then it is likely that a flood will travel in this direction and could destroy the roads. In technology-loving Iceland, you can still get mobile phone signal in this remote region, so they identified all the phones in the area and sent them SMS messages to let them know that the region was closed.

This afternoon (Wednesday), the Coastguard plane is flying over the region to map the glacier. This will be a reference to make it easier to see changes. It is using the same radar that brought you the famous ‘Scream’ image of Eyjafjallajökull. If an eruption begins beneath ice, a depression will form on the surface of the glacier as it melts at the base. I expect that they will release results form this later.

What’s going to happen?

The best answer to this is no-one knows.

There is a reasonable chance that the answer will be nothing. The earthquakes continue, and their source seems to be extending towards the NE at a depth of 5-12 km. This is rifting; North America and Europe continuing their continental drift apart. GPS data show that magma is filling the gap. Many rifting events do not produce an eruption and the earthquakes simply settle down.

If the earthquakes move to the surface then the most likely outcome is an eruption of basalt. If the cracks reach the surface under ice, then this can be explosive, if it reaches the surface outside the glacier then we can expect lava. Dave McGarvie has a more detailed discussion of scenarios here. Some news reports focus on some much larger eruptions in Bárðarbunga’s history where rifting extended far in the opposite direction (to the SW) through the Veiðivötn region, but these are worst-case scenarios and are much less likely.

Information sources

There is a lot of information available from official sources in Iceland. The three main ones are below:

  1. Icelandic Met Office
  2. Icelandic Civil Defence
  3. Icelandic National News – English volcano page

There is also many blogs covering the unrest and lots of interesting discussion on Twitter. In particular, the Bardarbunga list list compiled by @gislio has many key contacts and links to interesting articles.

Some background reading

I’ve written lots of posts about Iceland volcanoes and ash clouds. The earthquake swarm could continue for some time. Here are a selection that you can read while we wait and become an instant Iceland expert.

Categories: Uncategorized

(Almost) 3D view of Háifoss waterfall, Iceland

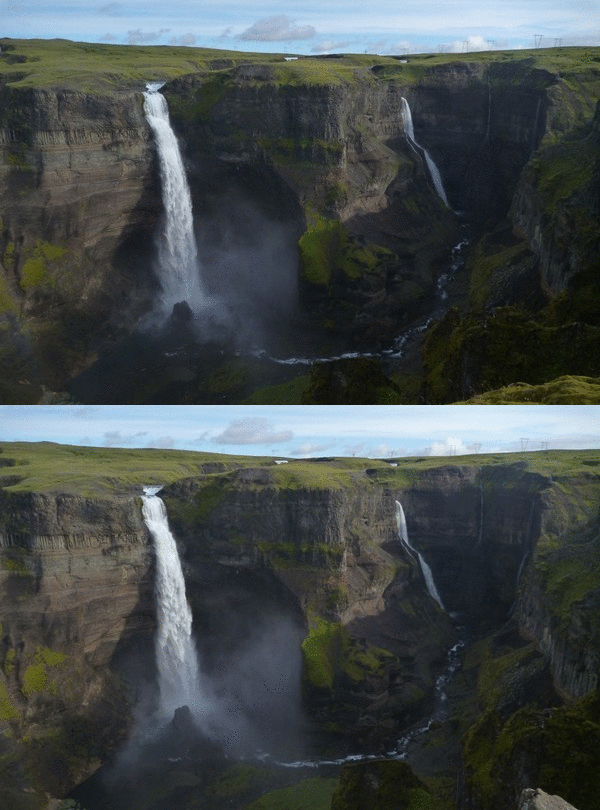
Haífoss, Iceland.  Click image for larger version.

Haífoss, Iceland. Animated gif file may not animate in some browsers / mobile devices.  Click image for larger version.

Háifoss is Iceland’s second highest waterfall, with a drop of 122 metres.  It’s name means ‘Milky elfin vomit spout’ in Icelandic.  Not really; it’s ‘High waterfall’.  People seem to enjoy the myth that Icelanders believe in elves.  It is located inThjorsadalur, about an hour northeast of Selfoss. Hjálparfoss and Gjáin are in the same area. Note: If you are a tourist photographing a waterfall in Iceland, please don’t complain about the rain.

I took this (almost) 3D image of Háifoss by accident. Flicking between two photographs taken at slightly different places along the path gives an impression of depth. According to Wikipedia, this is due to the motion parallax effect.  Objects in the foreground move further than those in the distance.

The animation was created with the ImageMagick software. This is a command line based tool for rotating, cropping and resizing images, and much more. It is Free/Open Source software, so you can download and install it on as many machines as you like.  I previously wrote a post explaining how to annotate and join images e.g. to make multipart figures for scientific papers. The command used to make the Háifoss animation is:

convert -loop 0 -delay 60 Háifoss_1.jpg Háifoss_2.jpg Háifoss3D.gif

Categories: Uncategorized

Volcanic life – the first microbes to colonise the Fímmvörðuháls lava

This is a guest post by Dr Laura Kelly, a Lecturer in Microbiology at Manchester Metropolitan University, UK. It describes her study into the first microbial life to colonise the Fímmvörðuháls lava flow, Eyjafjallajökull, Iceland. Prof Charles Cockell of the UK Centre for Astrobiology in Edinburgh was also involved, and I helped out with a map and some volcanological context.


When the average person thinks of volcanoes, microbiology may be the last thing that springs to mind. However, for the relatively small community of scientists interested in microbes in extreme environments, the connection is obvious.

Microbes such as bacteria and archaea (together termed prokaryotes because their DNA floats freely within the cell instead of in a membrane-bound nucleus), and fungi may not only survive but thrive in environments that appear quite inhospitable. In fact, the earliest forms of life on Earth were prokaryotes adapted to extreme environments approximately 3.5 billion years ago.

Conditions on newly deposited volcanic material are, by comparison, less harsh than early Earth environments. While some present day microorganisms are capable of flourishing in high-temperature environments such as deep-sea hydrothermal vents, temperatures of molten lava are greater than the upper limits permitting microbial survival. Nevertheless, upon cooling lava is rapidly colonised by bacteria and fungi, as recent research by our team of microbiologists has shown.

The Fímmvörðuháls lava is a small basaltic flow that was erupted on the  eastern flank of Eyjafjallajökull volcano from 20 March to 12 April 2014.  Two days after this eruption ended, activity switched to the ice-covered crater at the volcano's summit and began producing the notorious ash cloud.

The Fímmvörðuháls lava is a small basaltic flow that was erupted on the eastern flank of Eyjafjallajökull volcano from 20 March to 12 April 2014. Two days after this eruption ended, activity switched to the ice-covered crater at the volcano’s summit and began producing the notorious ash cloud.

Following the eruption of the Eyjafjallajökull volcano in April 2010, we analysed samples of the resulting freshly formed basaltic Fimmvörðuháls lava flows, collected in July and August 2010, to determine which microbes colonized the lava first. Taking care to avoid contamination, the samples were brought to the UK and crushed to powder to allow the DNA to be extracted.  DNA profiling, using a method known for its ability to discriminate among closely related species (16S ribosomal RNA gene sequencing), generated community profiles for each lava sample. Each profile involved taking all the 16S ribosomal RNA genes from the DNA extracted from the lava sample and determining the sequence of DNA building blocks (called nucleotides) of a random subset of these genes. Comparing these sequences with each other, and with sequences within online databases such as the Ribosomal Database Project, allowed us not only to generate ‘family trees’ for the microbial communities, but also to determine how closely related the Fimmvörðuháls communities were to bacteria found elsewhere.

Ours was the first study of its kind, providing detailed analyses of pioneer volcanic microbial communities. Previous studies of early volcanic communities focused only on microbes which could be cultured in the lab, which is problematic given that most microbes cannot be cultured. Therefore the majority of the inhabitants remained undetected in these previous studies.

The Fimmvörðuháls study revealed some very interesting findings. As fresh volcanic material is nutrient poor, containing little organic carbon and nitrogen, the expectation was that the inhabitants would be largely dependent on community members that could use sunlight for energy and inorganic carbon such as CO2 or CO, much in the same manner as plants. What was in fact discovered was that these communities did not rely on organisms that used sunlight, and that many of the inhabitants were organisms that required organic carbon for growth, although some inhabitants were related to those that could use inorganic sources. The communities were dominated by Betaproteobacteria, which is a diverse class that includes organisms found in glaciers, soils, sediments, water and many other natural environments.  DNA profiles indicated that some of the Fimmvörðuháls colonists are able to use sulphur and/or iron present in the lava flows as energy sources for growth (chemolithotrophs) and others are able to capture nitrogen from the atmosphere (diazotrophs).

Less surprising, however, was that Fimmvörðuháls communities were not as diverse as other communities that we have investigated in older basaltic Icelandic rocks, and that they contained very different bacteria. As lava weathers/erodes over time, the physical and chemical environment changes drastically from a microbial perspective. For example, increased surface area and pore spaces provide refuges and aid water retention, while weathering can also release useful elements from the substrate. This impacts the microbial community as a result. Hopefully, future studies will continue to monitor the progression of microbial colonization of volcanic substrata such as Fimmvörðuháls over extended periods of time to reveal the dynamic nature of volcanic microbial communities.


If you are interested in microbes in volcanic or other geological
environments, please visit Laura’s blog, Geomicrobiology and Microbial Ecology, which has further details about the Fimmvörðuháls project, with additional photos and videos.

* Reference:
Kelly LC, Cockell CS, Thorsteinsson T, Marteinsson V, Stevenson J (2014) Pioneer Microbial Communities of the Fimmvörðuháls Lava Flow, Eyjafjallajökull, Iceland. Microbial Ecology 1-15. doi:
10.1007/s00248-014-0432-3

Categories: Uncategorized