Friday focal mechanisms: Chile’s persistent seismic gap

A post by Chris RowanResearchBlogging.org

The subduction zone off the west coast of Chile, where the Nazca plate is being thrust beneath America, has generated some of the largest earthquakes ever recorded, including a magnitude 9.5 in 1960 that remains the largest earthquake ever recorded on a seismometer.

On February 27th last year, the subduction zone ruptured again, with the epicentre only 115 km northeast of Concepción, Chile’s second largest city. The magnitude 8.8 earthquake that ensued – together with the tsunami generated by movement of the seafloor above the rupture zone – killed more than 500 people and caused billions of dollars’ worth of damage. It also occurred in a section of the plate boundary that had not ruptured for almost 200 years. In 1836, Charles Darwin experienced a large earthquake, with an estimated magnitude of 8.5, that destroyed Concepción. Since then, the plate boundary to the north has ruptured in large earthquakes, in 1928 and 1985, and a 1000 km stretch to the south was involved in the 1960 magnitude 9.5. But until 2010, the portion of the plate boundary that ruptured in 1836 remained stuck, producing a ‘seismic gap’: a portion of the plate boundary where significant strain has been accumulated, but has yet to be released in an earthquake. This particular seismic gap is sometimes referred to as the ‘Darwin gap’, in honour of the scientist who recorded its last significant activity.
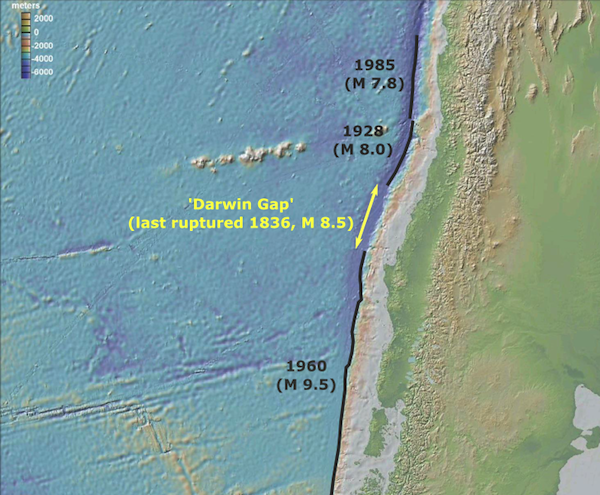
Ruptures on the Chilean subduction zone in the last 100 years. The 'Darwin Gap' is a segment of the plate boundary that has not ruptured since 1836.

The Nazca and South American plates are converging at a rate of almost 7 centimetres a year, or 7 metres a century; this means that by 2010 around 12 metres of slip had accumulated in the Darwin Gap since 1836. The region was primed for a large earthquake, that would release all this strain and fill the gap, and at first glance this is exactly what happened in February 2010. The point of rupture was within the gap, and the focal mechanism shows it occurred on a shallowly dipping thrust fault, as you would expect for a subduction zone earthquake.
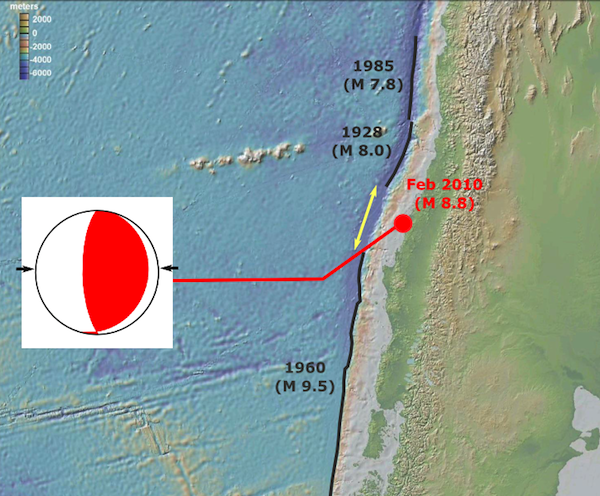
Location and focal mechanism for the M 8.8 earthquake of February 27th 2008. The earthquake was a compressional rupture at a point within the Darwin Gap.

If the Darwin Gap had been filled in, those rebuilding from the devastation caused by the earthquake could at least take comfort from the fact that the strain built up in the crust since 1836 had been released, and the risk of further large shocks in the near future had been reduced as a result. But a new paper by Lorito et al. argues that this was not actually what happened last February. The earthquake deformed the continent and the seafloor around the rupture. Radar and GPS measurements allow precise measurements of the former, and the latter can be calculated using observations of the direction and magnitude of the tsunami that was generated as it moved through the Pacific basin. By combining these datasets, Lorito et al. were able to model exactly how the plate boundary deformed following the initial rupture. What they found was that the subduction zone within the Darwin gap did not actually slip very much at all during last February’s earthquake. Instead, the initial rupture propagated north, with the most slip – 10-20 metres – occurring in the same region as the 1928 earthquake.
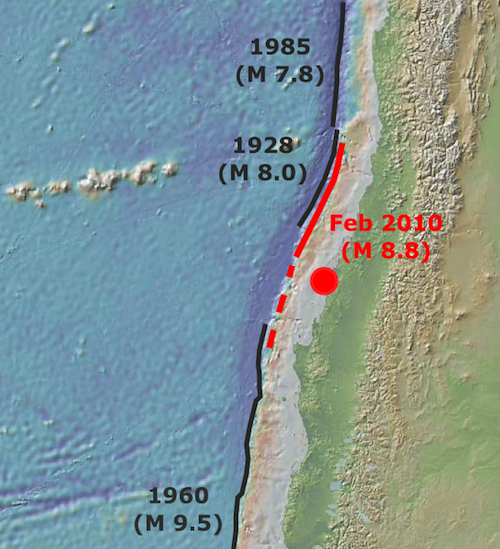
Extent of the February 2010 earthquake, according to the modelling of Lorito et al. Most movement on the subduction thrust (solid line) was north of the initial rupture, with only a small amount of slip in the Darwin Gap (dotted line).

What does this mean? For starters, it means that the Darwin Gap – and the accumulated strain from a couple of centuries of subduction – persists, and represent a significant seismic hazard for Chile. In fact, Lorito et al. calculate that last February’s earthquake increased the stress on the plate boundary in the gap, potentially increasing the risk of another major earthquake in the area. In fact, as I was preparing this post, the USGS has reported a magnitude 6.8 earthquake within the Darwin Gap. The focal mechanism shows it is a compressional earthquake occurring on a fairly shallow (25 km), gently dipping thrust, meaning it is probably on the subduction boundary. Fortunately early reports indicate that the Chileans have escaped further serious damage or casualties; unfortunately, this latest earthquake will, at best, relieve a small portion of the energy stored on the plate boundary. The seismic gap probably endures.
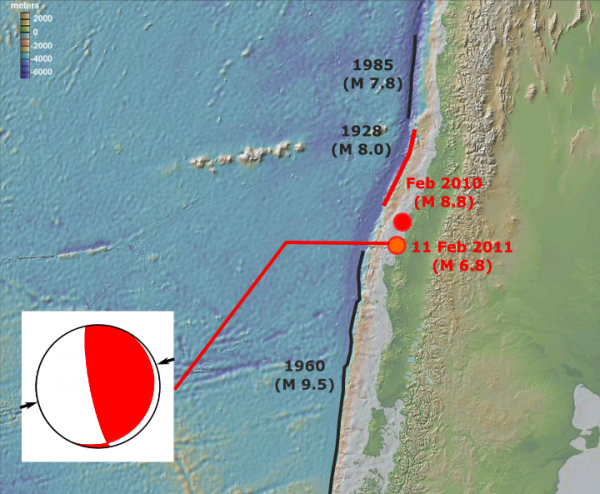
Location and focal mechanism of the M 6.8 earthquake that occurred as I was writing this post on 11th February 2011.

At a broader level, this study highlights how much we still don’t understand about how plate boundaries work. The plate motions that are accommodated at places like the Chilean margin appear smooth and relatively steady over geological timescales, but over shorter timescales they are nothing of the sort. Not only is motion within any particular segment of the boundary very stop and start, with strain accumulated over decades and centuries released by earthquakes in seconds and minutes, but the size of different segments, and the frequency and magnitude of the earthquakes they produce, can also be quite variable. Although it is clear that stress changes due to earthquakes in adjacent segments are important, a simple model of sequential ruptures, where a rupture in one segment puts more stress on adjacent ones and cause them to rupture in turn, is ruled out by the existence – and persistence – of seismic gaps.

Lorito, S., Romano, F., Atzori, S., Tong, X., Avallone, A., McCloskey, J., Cocco, M., Boschi, E., & Piatanesi, A. (2011). Limited overlap between the seismic gap and coseismic slip of the great 2010 Chile earthquake Nature Geoscience DOI: 10.1038/ngeo1073

Categories: earthquakes, focal mechanisms, geohazards

Pakistan floods: Predictable or predicted, but a disaster nonetheless

A post by Anne JeffersonResearchBlogging.org

Unusually heavy monsoon rains in July and August 2010 left large swaths of Pakistan underwater. At least 18 million people were affected by the flood, and it is estimated that, more than six months later, several hundred thousand remain without even temporary shelter. As a result of lost crops and livelihoods from the flood and inadequate relief supplies, malnutrition continues to kill people. Like most floods, the Pakistani poor have suffered far more than those with resources to avoid the flood, or at least its aftermath.

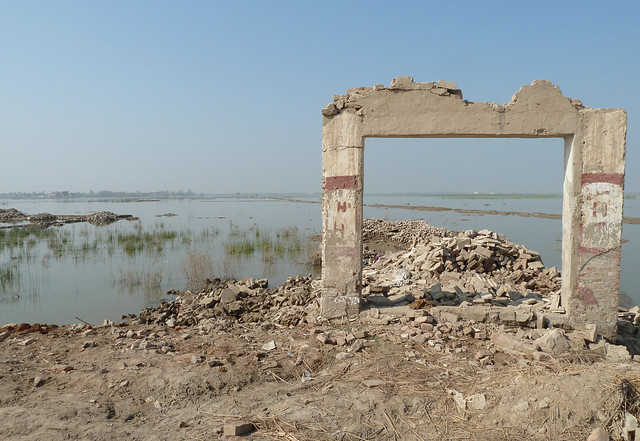
Remains of a school destroyed by flooding, near Jacobabad by DFID - UK Department for International Development, on Flickr

Remains of a school destroyed by flooding, near Jacobabad by UK Department for International Development, on Flickr. Used under a Creative Commons license.

A paper in press in Geophysical Research Letters shows that the 2010 floods were extraordinary. Monsoonal rains tend to occur in pulses, with multi-day wet periods followed by multi-day dry periods, and while the total rainfall over Pakistan during the 2010 monsoon season was not unprecedented, the number and intensity of extremely heavy rains over northern Pakistan was very unusual. The authors are working with very limited historical and satellite data, but they estimate that the number of intense rain bursts that occurred in 2010 had a probability of less than 3% in any given year.

Using data from the European Centre for Medium Range Weather Forecasts collection of meteorological models, the authors of the new paper show that the timing and intensity of northern Pakistan’s monsoon rain bursts are predictable up to 6 to 8 days in advance – including the rains that caused the flooding in 2010.

Lead author, Peter Webster, and his coauthors from the Georgia Institute of Technology, draw the following conclusion from their analysis:

We conclude that if these extended quantitative precipitation forecasts had been available in Pakistan, the high risk of flooding could have been foreseen. If these rainfall forecasts had been coupled to a hydrological model then the high risk of extensive and prolonged flooding could have anticipated and actions taken to mitigate their impact.

The floods really kicked off with a burst of rain on 28-29 July 2010, and according to Webster’s reanalysis, that rainfall was predictable with good skill 7 days in advance (21 July). Webster and colleagues argue that if that forecast was available in Pakistan, lives would have been saved and the immensity of the disaster reduced. But, C. Christine Fair, writing on the Foreign Policy magazine website suggests that the flood was forecast in Pakistan.

In the middle of July, the PMD began tracking a storm brewing in the Bay of Bengal. This eastern weather system developed interactively with a western weather system to produce the massive rains and the subsequent super flood of 2010. On July 24, the PMD issued a flood warning to the provincial government of Khyber-Pakhtunkhwa (KPK). Despite these increasingly severe warnings, KPK’s citizenry did not believe them. … The PMD kept issuing warnings to KPK as the rains began to fall. However, as fate would have it, on July 28, … a passenger jet coming to Islamabad from Karachi crashed …With the media beset upon this tragic spectacle, the PMD’s warnings went unheeded as the rain began to fall.

So the Pakistani government did forecast the flood – at least four days out – in plenty of time to get people in northern Pakistan’s valleys out of the way. The problem was not with the meteorological and hydrologic science either internationally or in Pakistan. Instead, disaster was ensured when flood warnings were not taken sufficiently seriously by regional authorities, media, and residents.

Why wouldn’t flood warnings be heeded? Perhaps more could have been done to communicate to Pakistanis through channels whose authority they respected. Webster cites an example of flood warnings in Bangladesh being disseminated by imams at local mosques. The Foreign Policy article quoted above places some blame on media distractedness.

But there was also a more insidious reason the forecasted flood was ignored. It was a rare event, but it was also part of a new climatic pattern for Pakistan. As the Foreign Policy article describes it:

in recent years there has been a slow but steady change in the location where Pakistan’s major rainfalls concentrate. In the past, monsoon rains fell most intensely over the Punjab. Slowly and steadily, the concentration of rainfall has moved north and west to KPK. This redistribution of concentrated rainfall away from the Punjab and towards KPK explains why no one in KPK had any reason to believe the predicted weather.

Flooding frequency and intensity have increased in Pakistan in the last 30-40 years compared to earlier in the 20th century. Webster and coauthors state, “This recent increase is consistent with the increase in intensity of the global monsoon accompanying the last three decades of general global warming.” The flood warnings were ignored, in part, because the statistics of monsoon rain patterns are changing. Human memory and historical records are not good guidance if the weather system is changing. In situations like this one, the past is not the key to the present.

There are lots of things that should have been improved to lessen the magnitude of the Pakistani flood disaster – reservoir management should have been altered; emergency relief supplies should have been distributed more equitably, broadly, and consistently; international assistance should have been much more generous – but the two big lessons for hazard mitigation coming out of the Pakistan floods seem to be: “find a system for making sure that warnings are issued and that they actually make it to people in harm’s way” and “don’t assume the climate of living memory is a very good indicator of the weather of the present and future.”

Webster, P. J., Toma, V.E., & Kim, H.-M. (2011). Were the 2010 Pakistan floods predictable? Geophysical Research Letters : 10.1029/2010GL046346

Categories: by Anne, climate science, geohazards, hydrology, paper reviews, society

Stuff we linked to on Twitter last week

A post by Chris RowanA post by Anne Jefferson

Blogs in motion

Volcanoes

Earthquakes

Fossils

Planets

(Paleo)climate

Water and Weather

Environmental

General Geology

Interesting Miscellaney

Categories: links

Snow days

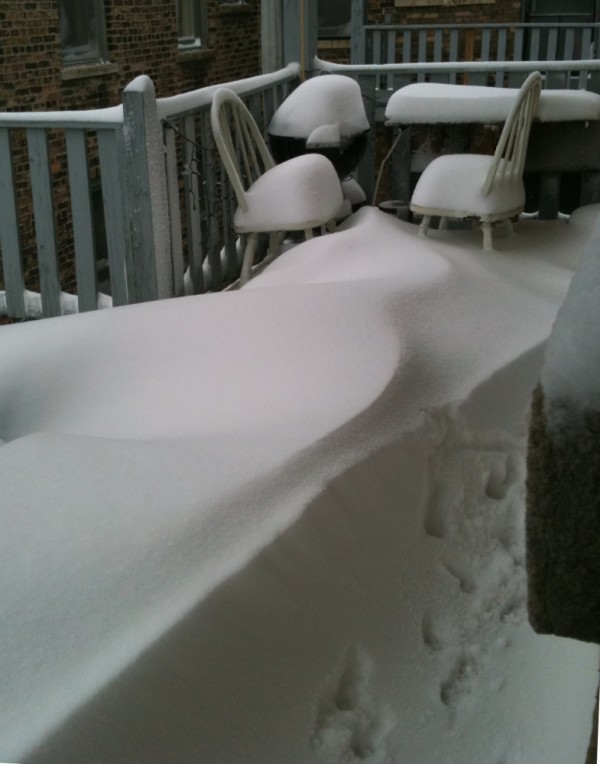
A post by Chris RowanYou might have heard that Chicago (along with much of the east and midwestern US) has had a bit of snow in the past couple of days.

The view from our back door on Wednesday morning. Photo: Chris Rowan, 2011.

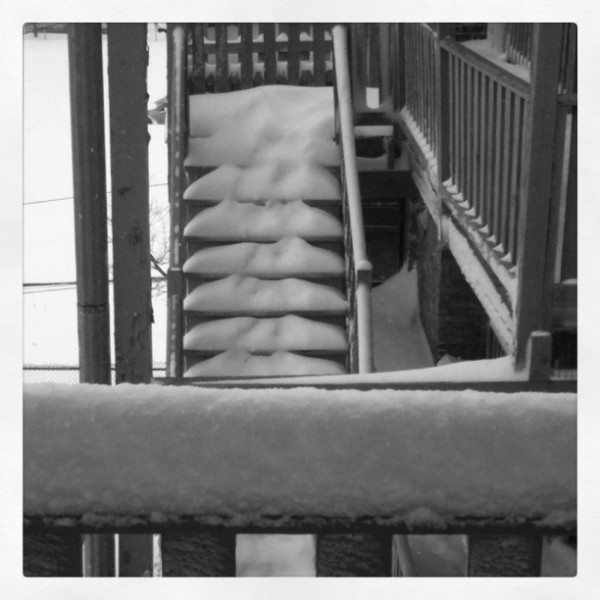
Fortunately, I don't have to shovel that. Photo: Chris Rowan, 2011.

The blizzard that moved in on Tuesday afternoon was pretty intense – the snow was being whipped around so much that visibility was severely reduced, and it felt like sandpaper against when blown against your face. It was quite something to experience this in the middle of a major city – the only comparable experiences I’ve had have been at the top of Scottish or New Zealand mountains. As a measure of how strong the winds were, not only were they finding all of the gaps in the old window frames of my normally quite toasty warm flat, but they were also noticeably forcing moisture inside through them. Fortunately we managed to seal off the biggest gaps before snow started falling inside. Then, to add to the excitement, we got Thunder Snow!

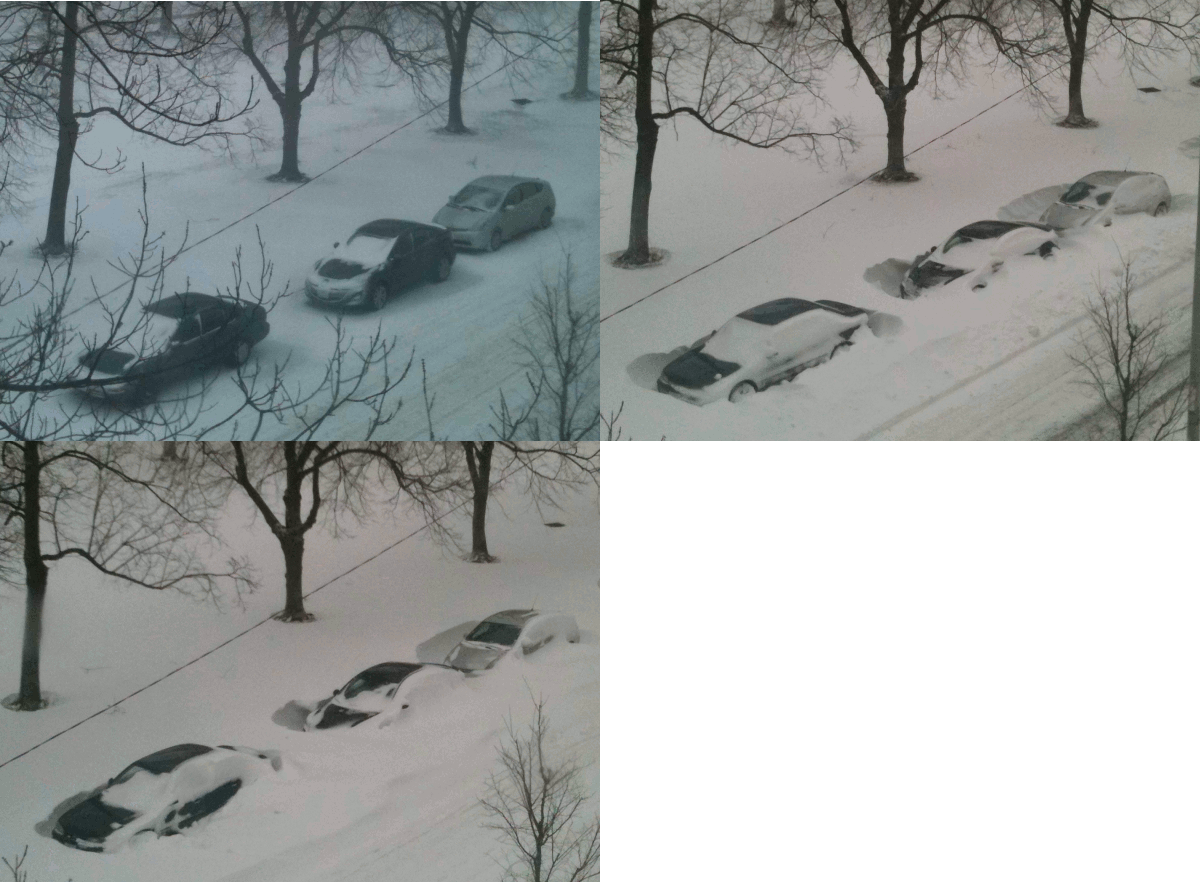
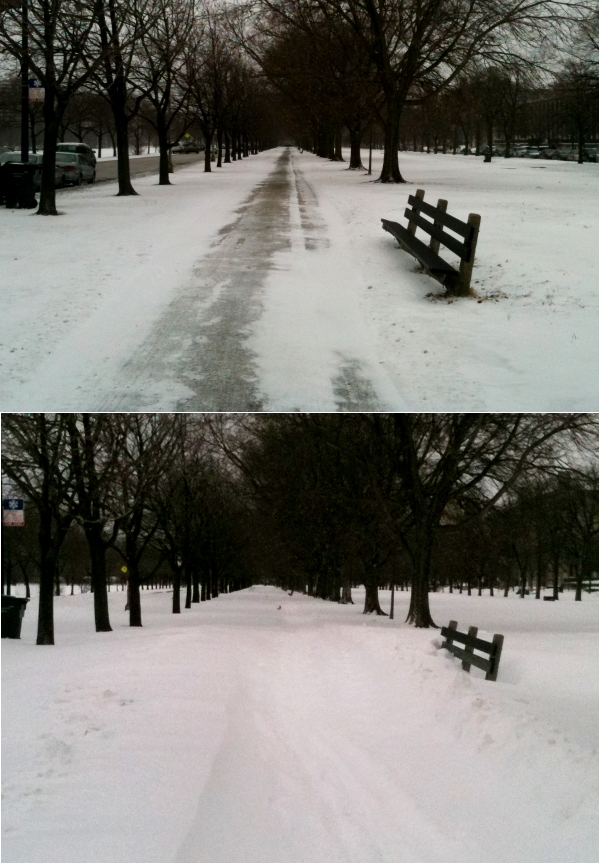
Even after the storm finally moved on yesterday morning, we still got a few more inches of snow added by a burst of lake effect snow. The official grand total was 20.2 inches of snowfall – the third biggest storm in Chicago’s recorded weather history (see the top 10 at the end of this post). Of course, thanks to the wind, the actual distribution on the ground was quite uneven.

Animation of snowfall accumulating during the Groundhog Day blizzard.

The road outside on (i) Tuesday evening, close to the start of the blizzard, (ii) Wednesday morning, (iii) Wednesday lunchtime, with added lake effect snow. Photos: Chris Rowan, 2011

Snow accumulation in the park across the street.

Snow accumulation in the park across the street. Deep and crisp and... uneven? Photos: Chris Rowan, 2011

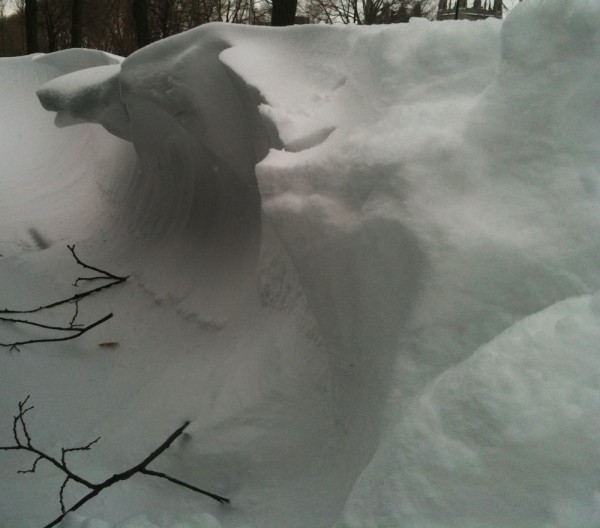
Whilst lots of snow had accumulated on the roadward side of the cars across from the flat, due to wind and snow plough, in the sheltered area on the kerbward side, some rather beautiful snow ventifacts had been carved out. (quite convenient, too, for those of us faced with the task of shovelling the snow away).

Aeolian snow-forms produced In the wind-shadows of the cars across the street. Photo: Chris Rowan, 2011.

More aeolian snow forms. Photo: Chris Rowan, 2011.

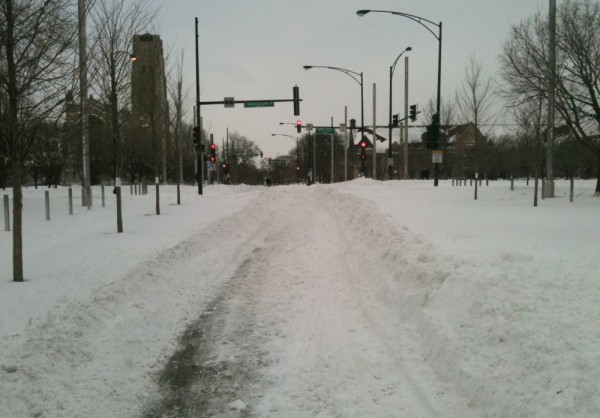
Chicago, despite having much more infrastructure in place to deal with snowstorms, has been completely overwhelmed by this monster snowfall. Schools are shut, and the University of Chicago cancelled classes for the first time in more than 25 years. They’re cancelled today as well – not because of continuing snow fall, but because the snow ploughs have been so occupied trying to clear the main thoroughfares (such as Lake Shore Drive) that they haven’t had time to get to the smaller streets yet.

What amounts to a passable route in Chicago at the moment... Photo: Chris Rowan, 2011

This has me thinking about the limits of resilience to extreme weather events. Chicago is well-prepared for snowy weather – it has to be, because significant winter snowfall is hardly a rare occurrence. For this reason, it chugs along happily in conditions that would make most places in my British homeland grind to a standstill. And yet, despite this, a sufficiently severe winter storm can still shut things down in pretty short order. Even the most forward-thinking of cities don’t tend to prepare for the worst disaster that could possibly hit them – it would cost too much (or, at least, more than the average tax-payer would accept) to prepare for something that happened one in a generation or more. It seems more sensible to accept that a blizzard will shut down your city once every couple of decades, than paying for a fleet of snow ploughs that mostly stands idle for 20 years.

But this calculation is only valid, or even possible, when the long term climate is stable. If the climate changes, as we are changing it now, then the previously rare events, or even never-before-seen ones, become more common; we will be more frequently afflicted by extreme weather that we are not equipped to cope with. It is hard to plan for the future when we are constantly moving the goalposts on ourselves. And if that is true of rich, developed cities like Chicago, then what of cities in the developing world, where the threshold of what they can deal with now, and what they can afford to prepare for in the future, is much lower?

Categories: environment, photos, society

New at Erratics: What’s up with Cu?

Our goal in starting Earth Science Erratics was to promote and encourage new voices to take there first steps into the geoblogosphere. But we also want to make sure that people who have taken those first steps already, but have perhaps flown a little under the internet radar, are given the attention they deserve. Erratics’ newest contributor, Nina Fitzgerald, gave up her previous career to go back to college and study geology, and currently works seasonally as a ranger with the National Park Service. Last year, she began recording her adventures in Utah, and the geological musings that they inspired, at Watch for Rocks. Her latest investigation, which she is cross-posting at Erratics, is into the formation of copper ores.

I had wondered why copper shows up where it does. I had wondered how copper gets to where it gets. I had found that copper could mineralize in rocks in certain areas of what is called skarn.

I pondered the following:

What the heck is skarn?

We think that Nina’s informative and enthusiastic writing deserves a wider audience, so hopefully after you have learnt about about skarns and where they form at Erratics, you’ll check out her own blog as well.

Categories:
geology, links