Stuff we linked to on Twitter last week

A post by Chris RowanA post by Anne Jefferson

Earthquakes

The big earthquake news this week has obviously been the magnitude 6.3 earthquake that hit Christchurch. For those interested, Chris has been adding links to the latest information, images and videos to his initial post on the quake. But he would also like to highlight this BBC article on the aftermath of the magnitude 8.8 earthquake that shook Chile a year ago today, which illustrates how the road to recovery following a major quake – both physical and psychological – is a long and hard one. And, as a former Pacific Northwest resident, Anne was fascinated by the parallels between the Christchurch earthquake and the little appreciated seismic hazards in Portland, Seattle, and Corvallis, which are discussed in this Oregonian article.

Volcanoes

  • Erik Klemetti highlights the latest media volcanic reporting fail: a study on how volcanic tremor may predict eruptions becomes ‘Mt. Baker is overdue!’ Sigh, indeed.
    http://bigthink.com/ideas/31357

Fossils

(Paleo)climate

Water

Environmental

Planets

General Geology

Interesting Miscellaney

Note: Anne is on a mission to finish a manuscript in the next two weeks. Her twitter presence may be light until the paper is off her desk.

Categories: links

Aftershocks, triggered earthquakes, and Christchurch’s seismic future

A post by Chris RowanAs more scientific information becomes available regarding last week’s magnitude 6.3 earthquake in Christchurch, we can look a bit more closely at the nature of this earthquake, how it fits into the overall tectonic picture in New Zealand, and future seismic risks in the region.

Aftershock, or triggered earthquake?

There seems to have been a bit of ambiguity in discussions about the nature of this week’s earthquake: was it an aftershock of September’s earthquake? Was it a separate earthquake that was possibly triggered by September’s earthquake? What’s the difference, anyway?

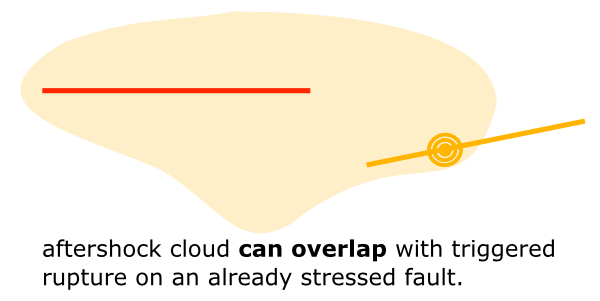
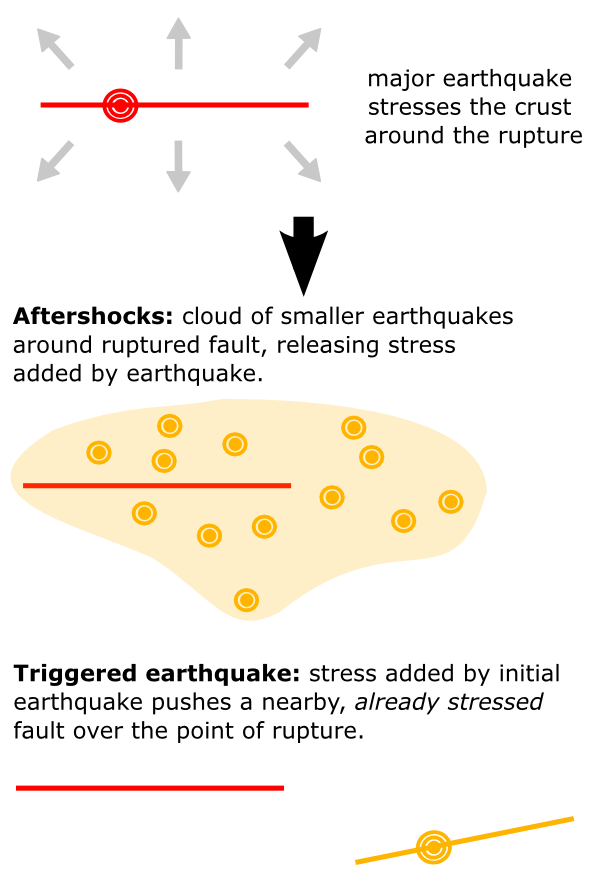
When any fault ruptures in an earthquake, movement along the fault plane itself also stresses and deforms the the surrounding crust. These stress changes can often induce further smaller earthquakes – aftershocks – that take the form of a cloud of tremors that encompasses the initial rupture. In other words, aftershocks are mainly caused by the stress added to the crust by the initial earthquake. However, very few faults are found in glorious isolation within the crust. More often that not, other faults, that may have themselves accumulated a large amount of tectonic stress over the previous decades and centuries, will be found nearby. In such cases, the stress change due to the first rupture may be large enough to push these nearby faults over the edge, resulting in a triggered earthquake. The difference between this and an aftershock is that the stress added by the first earthquake is only a small component of the stress released when the second fault fails – most of it was already present, and the fault would have ruptured at some point in the future anyway.

The difference between aftershocks and triggered earthquakes

The difference between aftershocks and triggered earthquakes.

Where things get complicated is in regions where major faults are quite close to each other – perhaps segments of a large fault boundary fault, or different strands of the same fault system – so that the cloud of aftershocks from a large earthquake on one fault overlaps with the trace of another fault that hasn’t ruptured yet. If that second fault then does rupture, what do we call that? It’s in the same region as all the other aftershocks; but most of the stress being released was not a result of the first earthquake – it was already there on the fault, and the additional loading was just the straw that broke the camel’s back.

When aftershocks and triggered ruptures overlap

When major faults are closely spaced, things can get complicated.

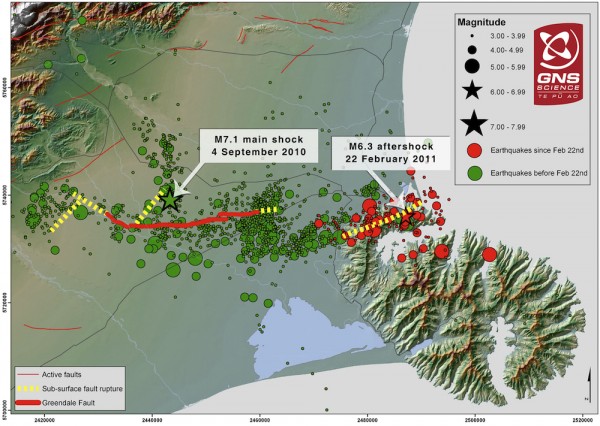
This weeks’ events in New Zealand seem to fall into this ‘it’s complicated’ category. Last September’s Darfield earthquake was centred 40 km to the west of Christchurch, but the epicentres of the aftershocks in the months that followed gradually migrated east towards the city. The map below (courtesy of Geonet) shows that these smaller aftershocks – the green circles – do encompass the area containing the fault which ruptured on Tuesday. So it could – technically – be described as an aftershock. However, for reasons that I discuss below, it seems probable (to me, anyway) that this fault is releasing tectonic stress built up over geological timescales – centuries or more – which would also make this a triggered earthquake. If that is the case, simply referring to it as an aftershock obscures its wider tectonic significance.

Christchurch Earthquake Sequence

All earthquakes in the Christchurch region since September 2010. Earthquakes since 22 Feb 2011 in red. Click to enlarge. Source: Geonet.

The big tectonic picture

And what is that wider tectonic significance? In my discussion of last September’s magnitude 7 earthquake, I wrote the following:

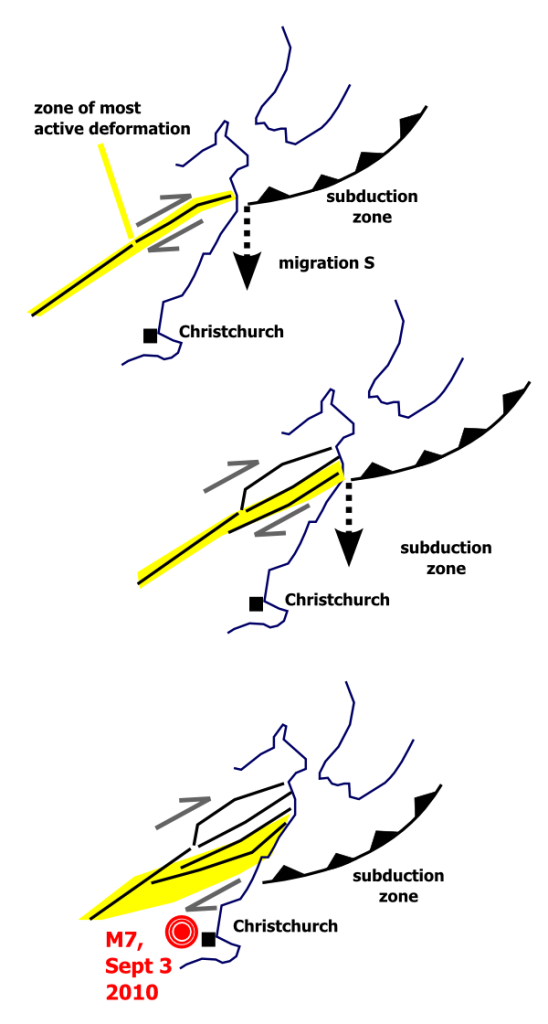
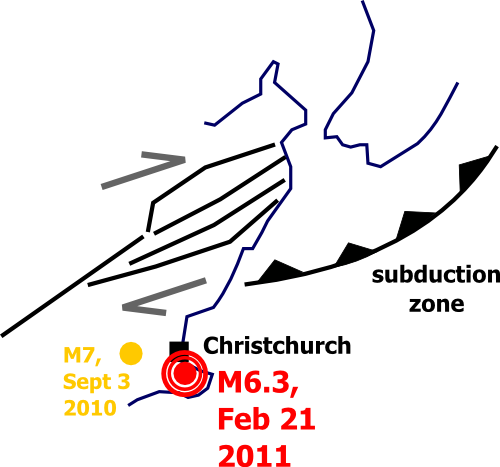
…the occurrence of such earthquakes in this particular region of the South Island is probably also linked to ongoing changes in the nature of the plate boundary at the junction between the subduction zone [off the East Coast of the North Island and the continental transform [The Alpine and Marlborough Faults]. If you look at the displacement history of the individual faults in the Marlborough Fault zone, the northern faults are older, were more active in the geological past, and have quite small recent (in the geological sense of ‘the last few 100,000 years’) displacements; the southern faults are younger, and have much larger recent displacements. The most obvious explanation for these changes is that the most northern of the Marlborough faults was originally directly linked with the end of the subduction zone, but that these two structures moved out of alignment as the subduction zone moved south, causing new strands of the Marlborough Fault system to grow in order to more efficiently accommodate plate motions.

This tectonic evolution is ongoing, and since the end of the subduction zone is now actually to the south of the southernmost and youngest of the Marlborough faults. Some of the plate boundary deformation is probably therefore being shunted into the region around Christchurch, where it needs to be accommodated by dextral strike-slip faulting. Eventually, over geological time, this deformation will lead to the formation of a new, more southerly strand of the Marlborough Fault system.

Growth of new plate boundary faults on the South Island of New Zealand in response to southward propagation of the subduction zone

Looking at the traces of the Darfield Fault, and the fault that ruptured this week, mapped out the Geonet aftershock plot above, it looks to me like two strands of the same, mainly strike-slip, fault system, which is exactly what you would expect for the early stages of a new branch of the Marlborough Fault. Over geological time, then, you would expect to see these faults developing into a much more prominent part of the plate boundary zone. But that’s over the next couple of million years. What about the next few decades?

The future seismic risks for Christchurch

People in Christchurch are unsurprisingly feeling a little overwhelmed by the recent seismic chaos, and fearful for the future. Now that New Zealand geologists have been made aware of the active faults running across the Canterbury Plains, they will be racing to study them and their past behaviour, in order to assess how much risk they pose to Christchurch in the decades and centuries ahead. But the very fact that these faults were unknown actually provides us with some information about them – namely, that although they are active, they have not been particularly active in the recent past. Earthquake-generating faults are identified from the historical record – quite short in the case of New Zealand – and looking for features of the landscape that indicate fault motion, such as scarps and uplifted terraces. The fact that these faults don’t seem to have generated such features, and have instead managed to be totally buried beneath the river-borne debris coming off the uplifted Southern Alps to the west, tells us that these faults do not rupture particularly frequently; if they were, the Canterbury Plains would not be so flat.

The Canterbury Plains

Not a particularly tectonically shaped landscape (mountains not included, obviously)

This makes sense: we know how much motion occurs across the plate boundary that bisects New Zealand, and we know that the motion on the main boundary faults of the South Island – the Alpine and Marlborough Faults – accounts for around 80% of that motion. The remainder is probably distributed across many faults on the South Island, not just the ones near Christchurch, which means that they need much longer to build up enough stress to rupture in an earthquake – probably the high hundreds, or low thousands of years. It would be unwise to relax before some detailed geological work is done, of course, but I suspect that these particular faults have done all the damage that they are going to do to Christchurch for the foreseeable future.

Categories: earthquakes, geohazards, society, tectonics

Shaking in Christchurch boosted by seismic lensing?

A post by Chris RowanEven taking into account how close the rupture point of Tuesday’s earthquake was to Christchurch, the intensity of the shaking – and the amount of damage that the city suffered as a consequence – seems to be very high for a magnitude 6.3 earthquake. The fact that the city is built on soft sediments that amplify shaking is an obvious factor here, but an article in the New Zealand Herald raises the possibility that geological structures in the region may have acted as a ‘seismic lens’, focussing the seismic energy released in the earthquake towards Christchurch.

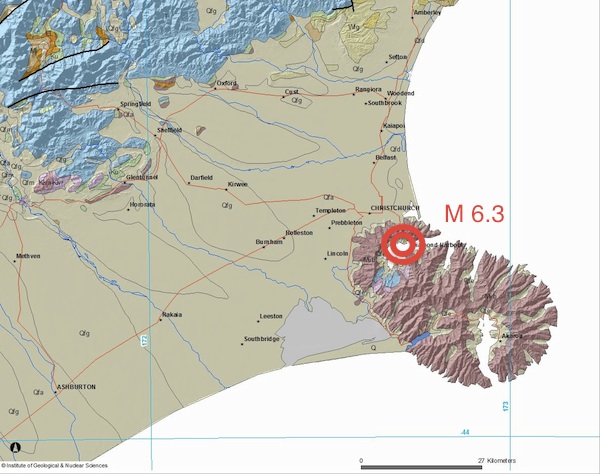
If we plot the earthquake’s epicentre on a geological map of the central South Island of New Zealand (courtesy of this handy interactive map from GNS), we can see it is close to the edge of the Banks Peninsula – the eroded remnants of two basaltic shield volcanoes that were active around 10 million years ago.

Location of Feb 22 earthquake plotted on a geological map of the Christchurch region, showing the Miocene volcanics of the Banks Peninsula (pink) rising above the young clays, silts and gravels of the Canterbury Plains (tan). Source: GNS

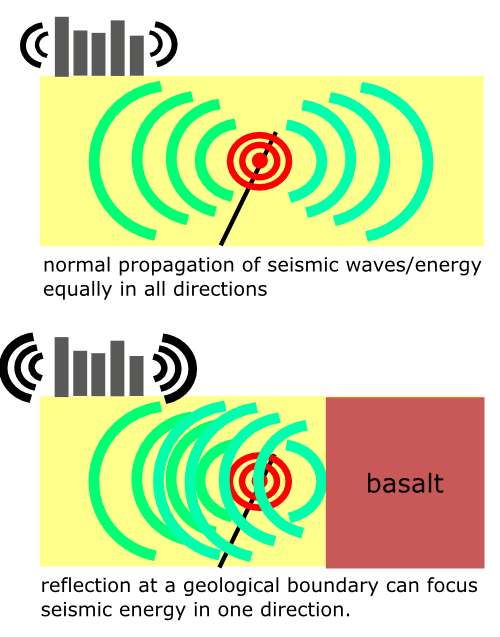
The hard volcanic rocks that make up the Banks Peninsula are very different from the soft sediments that underlie Christchurch. The huge contrast in physical properties across the boundary between these two units means that any seismic waves hitting the boundary would mostly be reflected back the way they came. So, instead of spreading out equally in all directions, a large proportion of the seismic energy released in a nearby earthquake would end up being sent away from the boundary with the basalts – which, unfortunately, is towards Christchurch.

How seismic lensing might concentrate seismic energy and boost shaking intensity.

As it stands, this idea is rather speculative – more work will be required to pin down the location of the fault before it can be proven one way or the other. But if seismic lensing was a factor in the very intense shaking Christchurch endured, the location of this week’s earthquake – in an ideal position to produce this effect – was doubly unfortunate.

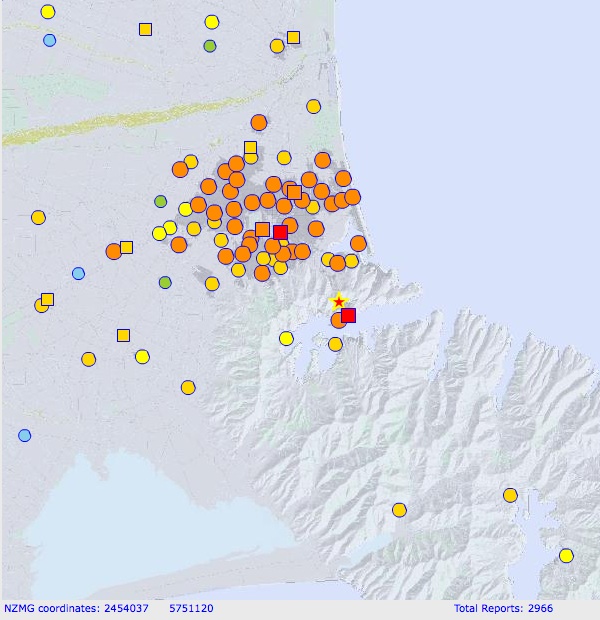
Update Callan requested a shakemap that includes the Banks Peninsula. This is from GNS’ Geonet site, and included felt earthquake reports (circles) and instrumental peak ground accelerations (squares). As you can see, there is not much useful coverage on the Banks Peninsula, and although what is there could be interpreted as showing less shaking at an equivalent distance from the epicentre, this does not account for the effects of being on hard rock (basalt) rather than soft sediment, which will probably amplify the shaking even in the absence of other factors.

Shakemap for the Feb 22 earthquake (star)

Categories: earthquakes, geohazards, geophysics

The scientist-journalist divide: what can we learn from each other?

A post by Anne JeffersonResearchBlogging.orgLast week, the journal Nature published two research papers on the effects of human-caused global warming on extreme precipitation events. I’m working on a post on the papers, and they’ve already received quite a bit of attention in the media.

As glamour mag journals often do when they publish papers that they think are going to catch wide attention, the two articles in Nature were accompanied by feature stories designed to add explanation and context to the necessarily succinct and technical writing of the articles themselves. One of these features fell under the heading “News in Focus”, while the other was in the category “News and Views.” Here are the first lines of each of those features.

The varying distribution of fresh water across the globe, involving complex patterns of rainfall in space and time, crucially affects the ecosystems and infrastructure on which human societies depend.

Climate change may be hitting home.

Which of those stories do you suppose was written by an academic scientist and which was written by a science writer? No bonus points for being correct. I’m not going to call either sentence out as good or bad, because I think they both have strengths and weaknesses. Overall, both were very well written pieces. But their first sentences sure do strikingly exemplify the differences in the culture of written expression between research scientists and journalists.

Scientists can definitely learn a thing or two about communication from science journalists. I don’t want to transform my manuscripts into text that reads like journalism, because the two forms of writing serve very different purposes for very different audiences. But reading good science writing online and practicing my own writing here have immeasurably improved my consideration of word choices, sentence structure, the value of an engaging first paragraph (or lede), and sense of narrative arc. I think these skills are carrying over from blogging into my manuscript and grant writing, my interactions with graduate student writing, and even my teaching. Maybe I’ll start asking my students to read both primary papers and the accompanying feature stories, so that they might absorb some writing skills from their reading assignments. So my unsolicited advice to fellow scientists is: “If you want to write better, start by carefully reading good writing.”

But science journalists can learn some tricks from the scientists too. After I read the first article, I understood why extreme precipitation might increase as a result of a warming climate (warm air holds more moisture; additional moisture in the air makes dry places even drier). When I read the second article, that “why” explanation was completely missing. In both articles, I got an overview of what the studies did and what they found, and in the second article I learned about implications for the insurance industry, adding context. But I lost the “why.” And it’s the why that allows us to translate what we’ve learned in one situation or study into another. Given the physical basis (the why) for a study, an interested reader can conjecture that if extreme precipitation is increasing in the Northern Hemisphere, then it’s likely increasing in the Southern Hemisphere as well, and that droughts may becoming more severe in arid regions. (And eventually scientists can test those conjectures.) Without the why, a reader only knows what that the insurance industry is concerned about climate change. If I may be so bold as to give some advice to science journalists, it is this: Explain not just what the paper of the week found, but why the result was obtained. Use those fantastic writing skills to communicate the science behind the science.

If both scientists and journalists are concerned that Americans are ill-informed and apathetic about science, and climate science in particular, then it behooves both groups to change the way we communicate science. And maybe the place to start is to look to each other for advice.


For those who are interested in reading more about extreme precipitation and less about writing, the sentences above came from these two sources.

Allan RP (2011). Climate change: Human influence on rainfall. Nature, 470 (7334), 344-5 PMID: 21331034

Schiermeier Q (2011). Increased flood risk linked to global warming. Nature, 470 (7334) PMID: 21331014

Categories: by Anne, climate science, public science, ranting

Magnitude 6.3 earthquake rocks Christchurch

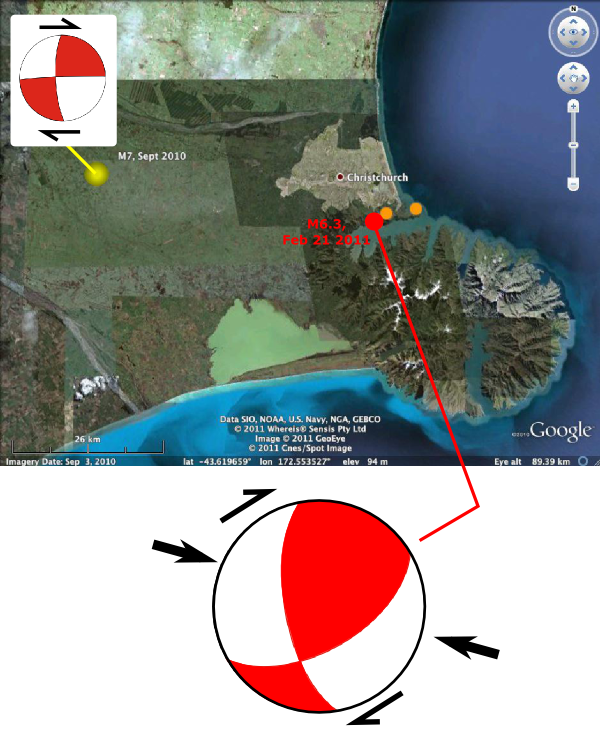
A post by Chris Rowan[Note: see the bottom of this post for the latest updates and links – last update 26th February]. A few hours ago, Christchurch, the largest city on the South Island of New Zealand, was once again shaken by a large earthquake. The USGS page reports it as a magnitude 6.3, with the rupture occurring just 5 km beneath the surface near the port of Lytellton, only a few kilometres south of Christchurch itself. This is significantly closer that September’s magnitude 7.0 earthquake, which was 45 km to the west; because the energy of seismic waves spreads out and dissipates the further away you are from the rupture point, the shaking experienced in Christchurch today was probably just as, if not more severe, than that experienced in September, even though the quake was smaller in magnitude. The proximity of the rupture, combined with the fact that many buildings in Christchurch had unrepaired damage from September’s earthquake, the timing (in the middle of the day rather than the middle of the night) and the ever-looming spectre of liquefaction, which severely magnifies the effects of shaking, have sadly resulted in collapsed buildings, and at least some casualties. When it comes to the impact on people and infrastructure, earthquake magnitude is only part of the story.

The focal mechanism for this earthquake plotted in the figure above, courtesy of the USGS, shows that it is transpressional – a combination of mostly east-west compression, with some right-lateral strike slip motion mixed in – and on a north-south trending fault [update: what I really mean here is more N-S trending than the Darfield fault; as Kim points out in the comments, if my interpretation above is right the actual fault plane is NE-SW oriented]. Superficially, this seems very different from September’s earthquake, which consisted of mainly right lateral motion on an east-west trending fault. However, strike slip on an east-west trending fault and compression on a north-south trending fault are in fact fairly equivalent in tectonic terms – they can be produced by pretty much the same regional tectonic forces. The transpressional deformation in today’s earthquake is fairly consistent with the overall sense of motion across the plate boundary that bisects New Zealand.

Location of Christchurch earthquakes in relation to the plate boundary running through New Zealand.

The other thing worth noting is that today’s rupture occurred in a region of crust that, according to modelling, saw a significant stress change as a result of last September’s earthquake. This seems unlikely to be a coincidence. We’re looking at a grey area between an ‘aftershock’ and a ‘triggered earthquake’, in that the Darfield earthquake probably helped to push the fault that ruptured today over the threshold, but that most of the stress released in this earthquake has been building up since long before six months ago.

Aftershocks and changes in crustal stress due to the Darfield Earthquake in September 2010. Source: Stuff.co.nz

What does this mean for the seismic risks for the residents of Christchurch in the days and months ahead? Well, there are going to be more aftershocks, more than there would have been otherwise. Beyond that, I’m afraid to speculate: I can only hope that there aren’t any more nasty seismic surprises lying in wait beneath the Canterbury Plains, and that Christchurch and New Zealand continue to show their characteristic resilience in the face of this latest disaster. I’ll update this post as necessary, as more concrete information comes in: please feel free to add any relevant links and information in the comments.

Update: 22 Feb 2011

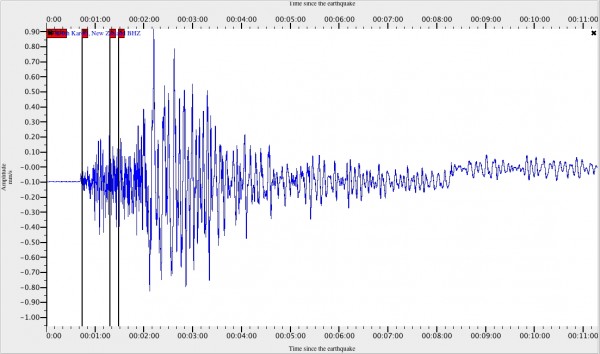
Here’s the shaking recorded by a seismogram close to Wellington, on the Southern North Island, via Shaking Earth:

Click for a larger version. Source: Shaking Earth

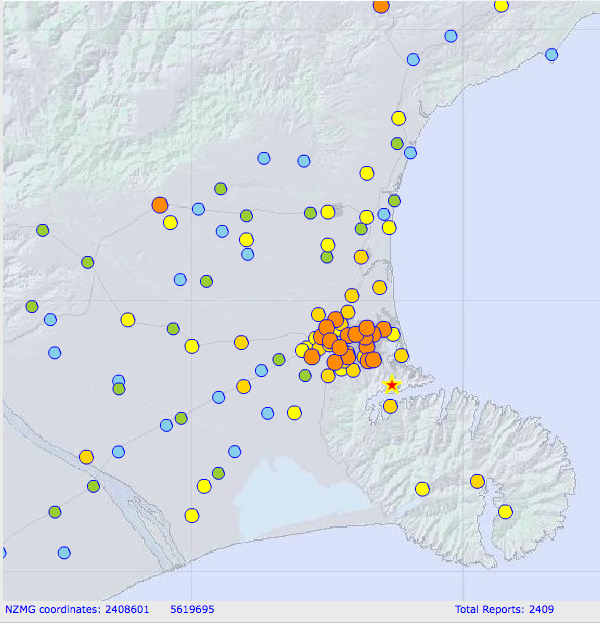
From Geonet, you can view a map of reported shaking intensity, coded according to the Modified Mercalli Scale:

Reported shaking from the 21 February Earthquake, according the Mercalii Intensity Scale: 8 - orange; 7 - light orange; 6 yellow; 5 - green; 4 - blue. Source: Geonet

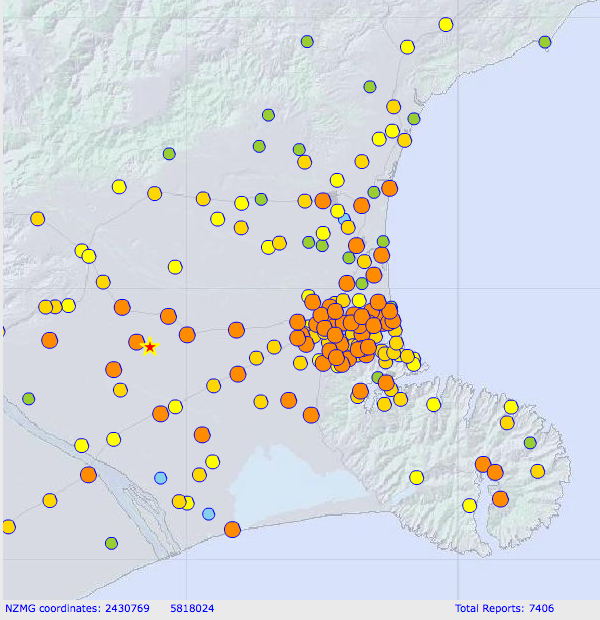
Note how the maximum values are clustered in Christchurch, close to the rupture, and fall away fairly quickly outside it. This contrasts with the shakemap for September, where intense shaking was felt across a much wider region. This shows that yesterday’s magnitude 6.3 quake released much less energy in total than September’s magnitude 7, but due to its location the energy it did release was focussed on a built-up area.

Shakemap for the September 2010 M7 Earthquake. Colours as above. Source: Geonet

There are lots of photos coming out of the damage in Christchurch, but this video shot from a helicopter provides a good overview. Obviously some buildings have collapsed completely, but it should be noted that many more structures have remained standing (although many of those will probably be in need of extensive repairs). It is cold comfort to those who have been trapped or injured, or the friends and families of the several hundred casualties, but New Zealand’s stringent building codes have probably once more saved many lives.

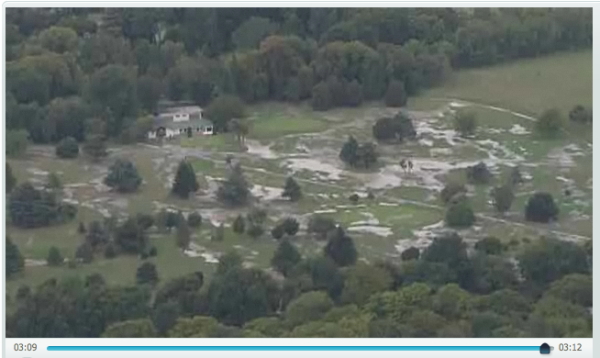
At the end of the video I linked to above, there are also some shots of extensive liquefaction caused by the shaking, which probably had a strong influence in the distribution and magnitude of the damage.

Water forced to the surface by liquefaction. Source: TVNZ

Update: 23 Feb 2011

New Zealand’s geologists have once again been doing an excellent job of explaining this earthquake, and the risks going forward, to the media, and through them, the Kiwi public.

There have also been some compelling, often harrowing eyewitness accounts of the earthquake and it’s aftermath:

  • The racing editor of the NZ Herald took ‘a walk through sorrow’ in the centre of Christchurch the evening after the earthquake hit:

    Everywhere I look buildings I have dined in with friends, bars I have visited, banks and shops I have been to are ruined. Not damaged, ruined.

  • A resident of Lyttelton, which was even closer to the epicentre of the quake than Christchurch, in an interview with the Australian Broadcasting Corporation yesterday:

    really 80 per cent of the township, if you like, the heart of Lyttelton, I would say is lying in little pieces.

    Now you’re not talking everything levelled to the ground, but it’s parts of buildings fallen off into the streets. And it’s not just one, it’s every second or third building, you look at it and go, “Well that’s a write off. No business can operate there.”

  • A journalist for the Christchurch paper the Pres, whose headquarters close to the Cathedral was heavily damaged in the earthquake:

    Outside the inner CBD looked like a war zone. Outside on the street strangers were holding each other and crying and gazing bewildered at the gutted ghetto surrounding us.

    (she also describes how one of the many areas overwhelmed by liquefaction “looks like Rotorua“)

Some more photos and videos:

  • supermarket CCTV footage of the moment the earthquake hit shows how the intensity of shaking ramped up over the space of about 10 seconds or so.
  • A dramatic photo from the hills above Christchurch, showing dust rising from the city centre (click for a larger version).

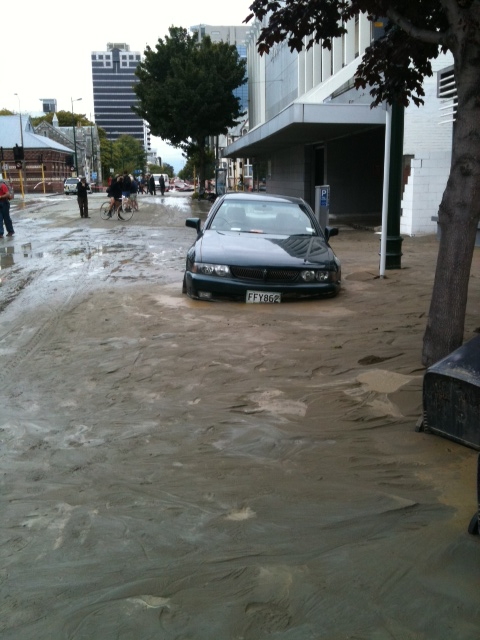
  • Liquefaction on the city streets (see more here):
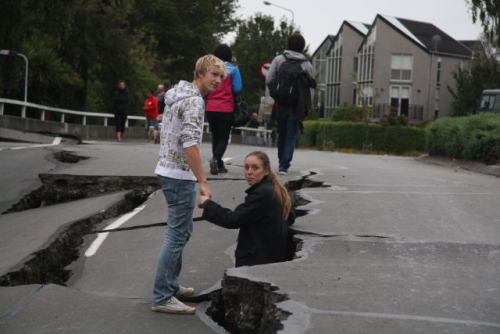
  • Cracks in the road:

Also worth reading is Dave Petley’s analysis of the reasons why the damage to Christchurch was much more severe than that caused by last September’s larger earthquake. Fortunately, it seems that New Zealand’s Earthquake Commission can cover the costs of further rebuilding. In a similar vein, I’m quoted in this story by the Christian Science Monitor.

Update: 24 Feb 2011

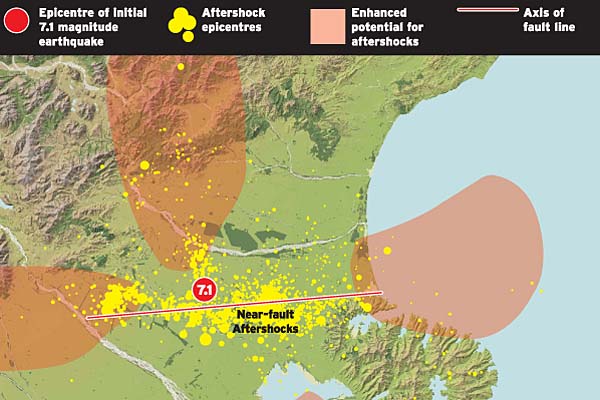
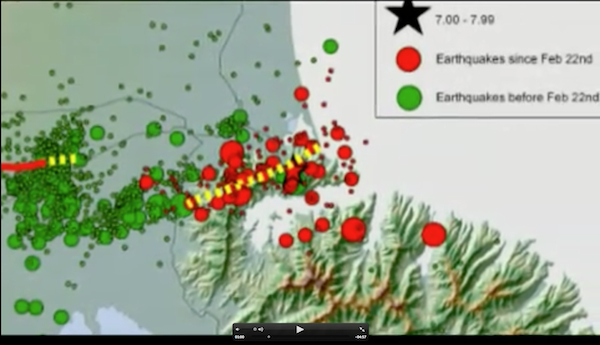
GNS have posted another nice video explaining the different types of seismic waves generated by the earthquake. Part way through, there is a plot of the aftershocks that have continued to rattle Christchurch in the past few days (red dots in the screenshot below – green dots are aftershocks of September’s quake). Most of them are found along a northeast-southwest trending line that probably represents the trace of the fault.

Aftershocks of the magnitude 6.3 earthquake (red) and suggested trace of the rupture (dashed yellow line). Source: GNS

This article in the New Zealand Herald raises the interesting possibility that geological structures in the region may have acted as a ‘seismic lens’, focussing the seismic energy released in the earthquake towards Christchurch. My latest post explains this concept in a bit more detail.

For those involved in the assessment and the communication of seismic hazards, one of the hard lessons coming out of both of the Christchurch earthquakes is that you can’t just focus entirely on the ‘Big Ones’ at large plate boundary faults. Smaller earthquakes on lesser-known or totally unknown faults near a plate boundary zone can be just as dangerous if they run near to, or even underneath a city. The northwest USA is one place where these risks need to be taken seriously: the Cascadia subduction zone poses a major regional seismic (and tsunami) threat, but cities like Portland may also face more local earthquake hazards, as this excellent article points out.

Update: 26 Feb 2011

ABC News in Australia has posted some striking before and after satellite photos of some of the more heavily damaged areas of Christchurch. I’m especially struck by the amount of debris that has been thrown into the streets even from buildings that are not obviously damaged from above (which doesn’t mean that they’re not) – this is probably mainly from collapsed brick facades. Early estimates suggest that up to a third of buildings in central Christchurch may need to be demolished and rebuilt.

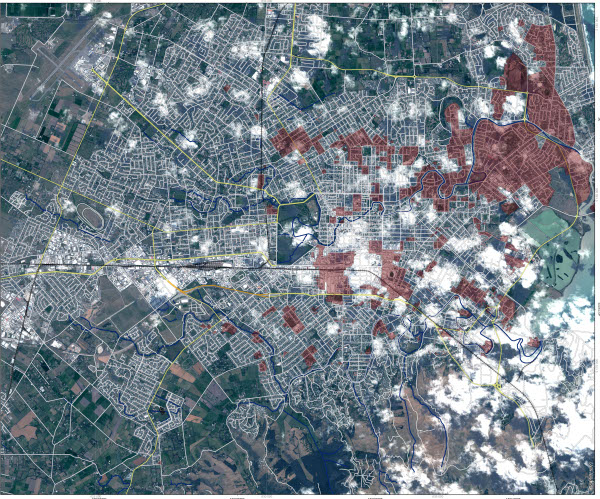
Here’s a map of Christchurch showing the areas that suffered from liquefaction: the northeast of the city seems to have been particularly badly affected.

Liquefaction in Christchurch. Click for enlarged version at source.

On this blog, my latest post addresses the question of whether this earthquake is an aftershock or a triggered earthquake (answer: yes) and takes a very preliminary look at what is in Christchurch’s seismic future.

Categories: earthquakes, focal mechanisms, geohazards, society, tectonics