My AGU Posters: a visual history

A post by Chris RowanIt’s a miracle! In an amazing (and probably entirely serendipitous) feat of organisation, I find myself printing my poster for the AGU 2012 Fall Meeting a whole 3 days before I fly to San Francisco. Since I am generally more of a “expand task to precisely fit the time available” type, it’s rather unusual for me not to experience some degree of last minute panic: I’m so used to it, it’s almost…too calm.

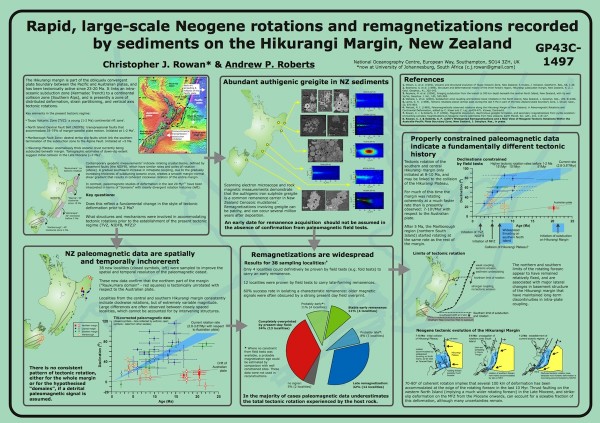
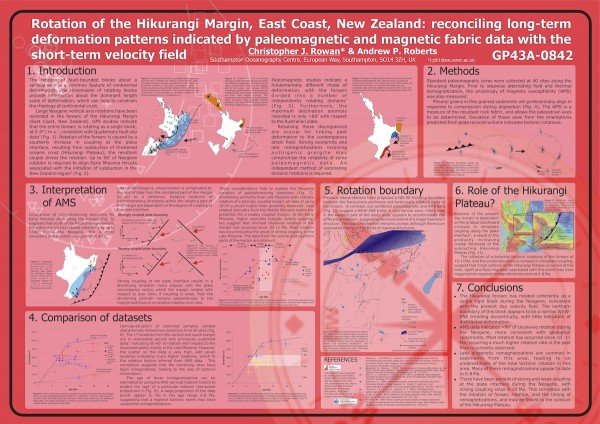
I was doing the final proofing before sending my latest opus to the plotter, and a thought occurred to me that requires me to go back to my very first AGU, and my very first AGU poster, in 2004. The creation story for this one is much more Chris-like: AGU that year was the final leg of a “conference world tour” that saw me fly from the UK to New Zealand to give a conference talk in Taupo, before flying to San Francisco for AGU, and then back to the UK just in time for Christmas. A large amount of the final interpretation for this thing were thrashed out in a jetlag-induced haze over the Pacific ocean; much of the actual creation was done in the lounge of a youth hostel in the Southern Alps; and it was printed in a New Zealand copy shop the morning before I flew out.

AGU 2004. Yes, it is very visually striking, isn’t it?

This poster is…pink. This is partly because the screen on the laptop I had at the time apparently had a bit of trouble accurately reproducing reds, but even then you have to admit it’s a brave visual choice. Perhaps the reason I spent most of my poster session in a very forthright argument with a New Zealand geologist was because the garishness unduly provoked him. Even if the colour scheme was not embarrassing, in hindsight, it’s also clear that this effort suffers from the all-too-common problems of too much text in too small a font: the figures are also too small and often clash with the background.

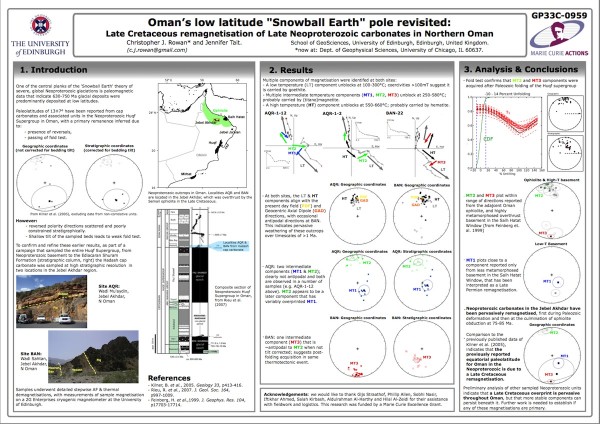
It was 3 years before I got the chance to do better, although this next poster holds the distinction of making it to AGU 2007 even though I personally didn’t. The prohibitive cost of getting from South Africa to San Francisco meant that although I got an abstract accepted, my co-author and PhD supervisor ended up presenting our work. As such, I’ve never actually seen a full-size version of this poster printed out, but I feel it’s a better effort: less text, clearer figures and layout, and most importantly, a somewhat more muted background that the figures actually stand out from.

AGU 2007. Less text, and a colour scheme less likely to induce eye-clawing.

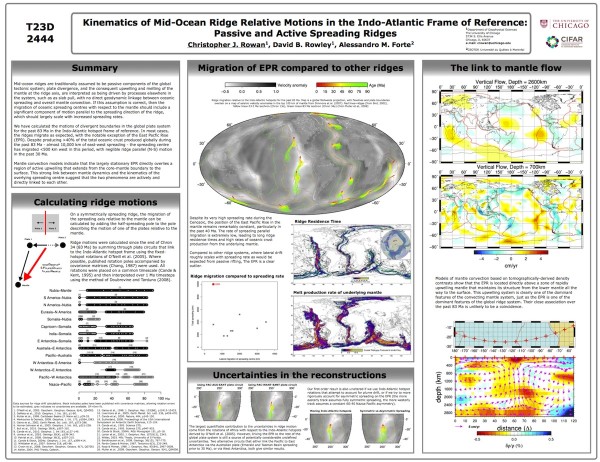
It was three more years before I actually got the chance to attend AGU in person again – since I’d just moved to Chicago, the commute was somewhat more reasonable, even if I was presenting some of the work I’d done in Edinburgh. A further 3 years (and an admonishment from my new IT department to not run through the plotter’s colour ink just for the sake of pretty background) had apparently moderated my more outlandish visual sensibilities, and I quite liked the end result: a simple layout, with the data as the visual focus. Although I’m suspicious of anecdata, I had some very constructive conversations in front of this poster that suggested that I might have been doing something right.

AGU 2010. A much more minimalist poster theme.

Last year, I was presenting some of my Chicago work; but although I was now talking about global plate kinematics rather than remagnetisations, it seems I decided to stick with the same visual style. I think it mostly works, thanks to the fact that the sort of work we’re doing lends itself to pretty figures. However, looking at it again I think that having so much text on the left, and that little squashed box in the centre bottom, makes it feel a little unbalanced. Unfortunately, when you’re printing on the Saturday afternoon before a Sunday morning flight, tweaking layout elements is not exactly a priority.

AGU 2011. Very different content to last year, but not so different in appearance…

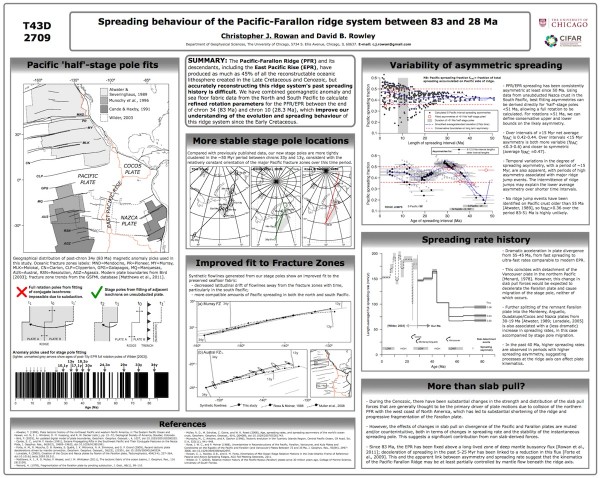
And now we come to this year, and guess what? It all looks a bit familiar:

This year’s poster for AGU 2012 – yet another variation on the same visual theme.

Which is what I was thinking when I was giving this years’ effort one last once-over: that just like this blog has a ‘theme’ which gives all the posts and pages a consistent visual look, I seem to also have established a ‘theme’ for my posters. It’s partly convenience, I think: simply copy and pasting layout elements when creating a new poster certainly saves faffing around with line thicknesses, box corners and font sizes. But I believe that there’s also an element of me evolving towards a style that ensures the form of my poster brings out the substance – my science – rather than distracting from it. I’d be interested to know if anyone else has ended up doing this; or do you start anew every time you have to make a new presentation?

Categories: academic life, conferences

The wrong conditions for a stream tracer injection

A post by Anne JeffersonLeaving behind Ohio and the high waters from Sandy, I ventured south in early November for the Geological Society of America meeting in my former home of Charlotte, North Carolina. The meeting was busy and wonderful, and far too packed for me to hear as much science or talk to as many people as I would have wished. After the meeting was over, I stuck around Charlotte for a few days in order to do some field work with one of my graduate students. Our plan was to do a tracer injection in one of the headwater streams that form her field area. Such tracer injections are a bit finicky to schedule…if it’s raining or has recently rained, you can’t do them because the stream discharge won’t be steady over the several hours of the experiment. But Sandy had not dropped any rain on the Charlotte area and the weather was beautiful all during the conference. Nonetheless, my student assured me that there would be plenty of water in the stream, as it had been running well just two weeks prior. Perfect conditions, we thought.

So the afternoon before the experiment, we headed out to the study site to measure discharge and mark the places where we would be collecting samples. My student advised me to wear my hip waders, not knee boots, as she had over topped her boots last time she was in the field.

But…it turns we didn’t need the boots. At all.

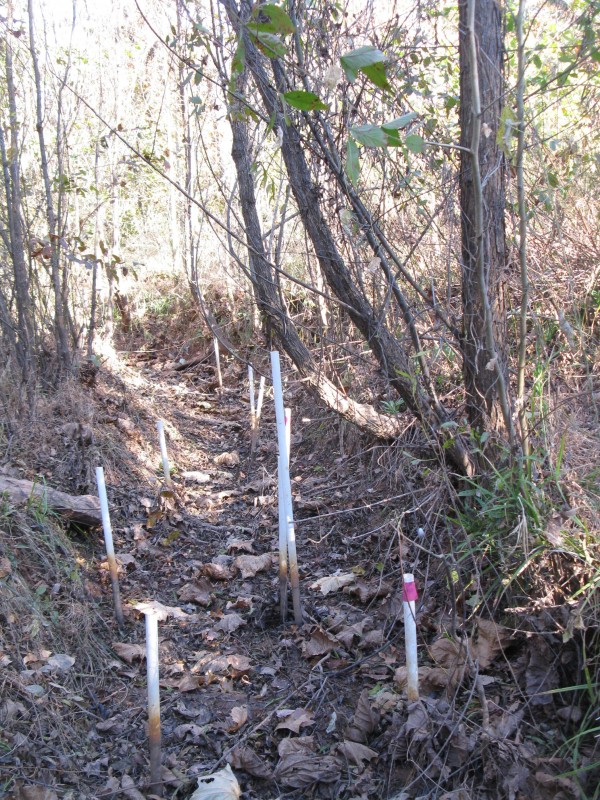
Piezometers rising from a dry stream bed.

The wrong conditions for a stream tracer injection, November 2012, Charlotte, NC.

Clearly, we could not add our tracer to the streamflow the next day. We were missing one crucial ingredient: streamflow.

One upside to the situation is that it was a very easy call to make. No hemming and hawing and making some sort of judgement about whether things were “good enough” to go for it. We simply couldn’t do the experiment.

It was also stunningly good conditions for walking the channel and looking at the location and conditions of the stream restoration structures and wood jams. And we spent the next day with our heads together working on much more solid plans for the eventual experiment. So, not a total loss.

But now we need to wait, for the right hydrological conditions, suitable ecology, and a time that works in our schedules. Field work is incredibly important for learning about the way that real, complex hydrologic systems work. And it can be incredibly fun. But it can also be filled with frustration…and waiting. In this case, for the “right conditions for a stream tracer injection.”

Categories: by Anne, fieldwork

After the storm

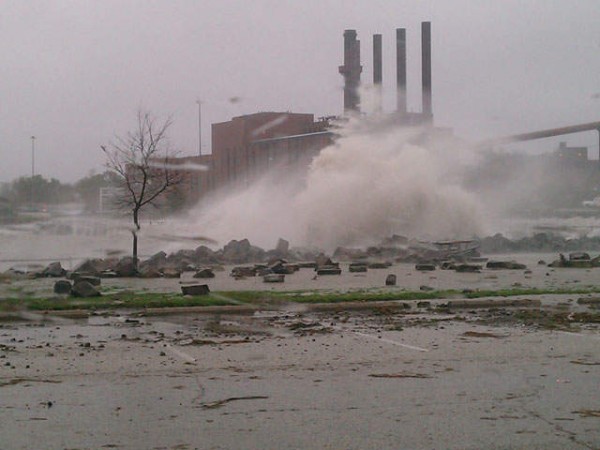
A post by Anne JeffersonIt’s been quite a week. My home in northeastern Ohio got off lightly from “Superstorm” Sandy, compared to places closer to the Atlantic seaboard and in the Caribbean. But still, over 250,000 people lost power due to high wind, especially in Cuyahoga and Lorain counties along the shores of Lake Erie, where huge waves also caused closure of an interstate and damage. Power crews are still working to restore power to tens of out thousands, and most schools and universities were closed for at least one day, if not longer.

NewsChannel5 photo of large waves crashing against shore in foreground, smokestacks in background

Waves from Sandy crashing against the Lake Erie shoreline in Cleveland. Photo from News Channel 5. Click image for link to source.

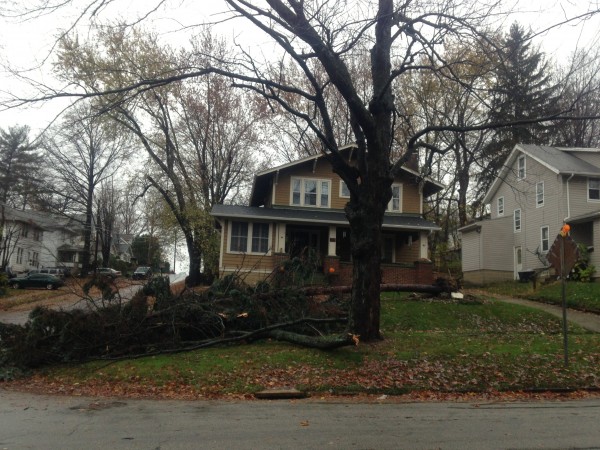
Large tree fallen in front of house.

A tree down in my neighborhood, which took the branch of another one as it went. This same picture was the one featured on the local paper’s website story about storm damage. Does this mean it was the most dramatic tree to fall in Kent? Whether or not it was, these people got lucky the trees fell away from their house.

There was also some rain. At my house, I got 4.25 inches (108 mm), which is almost exactly what the forecasts predicted. It came as both a drizzle and as heavy rains, but since last Friday afternoon we haven’t seen the sun. Now, northeastern Ohio is supposed to be quite cloudy, but given the local grumbling, this might be a bit of an extraordinary gray and damp cold run. It wasn’t warm rain either, with temperatures neither climbing out of the 40s F (8 C) or dipping below freezing. Isotopic results are pending, but my money is on our moisture source being almost entirely that northern airmass that got itself entangled with the tropical cyclone. Again, any whining about the damp is pretty well offset by everyone acknowledging that we are extremely lucky compared to states to our east.

All that cold rain brought the local river levels way up. There was major flooding on the Cuyahoga River at the downstream end by Wednesday, and the river at its upstream-most gage in Hiram crested on Thursday night. Flow at Hiram peaked around 1900 cubic feet per second (53.8 cubic m/s), which as I eyeball it on the USGS annual peakflow graph appears to be about a 2-year flood. This is actually consistent with my eyeballed estimate of the flow frequency produced by Sandy on Passage Creek, near Callan Bentley’s house in Virginia. I wonder whether that will be consistent for other rivers affected by Sandy.

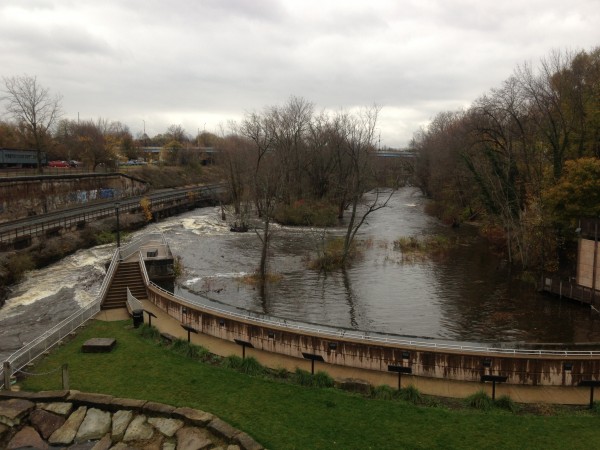
For me, this was the first chance to the Cuyahoga River in action as it flows through Kent. The river sits in a gorge than separates the two halves of town, and that seems to keep the river from endangering much property in the town. But it did make for a pretty impressive roaring site and sound as I crossed the bridges today. Here are two pictures of Heritage Park in Kent on Friday afternoon about 4 pm. Contrast that with the low water pictures from early June.

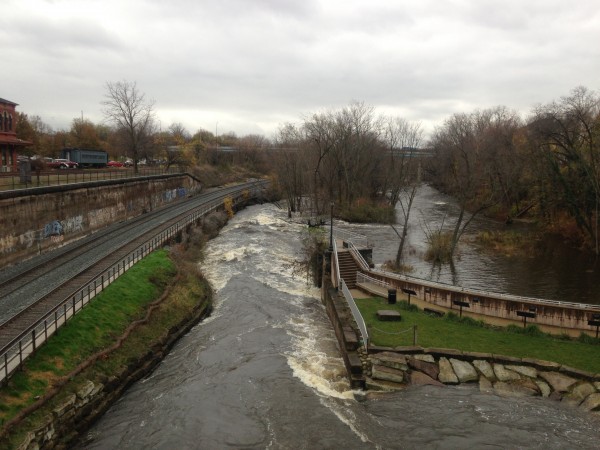
Cuyahoga River in Kent Ohio with impressive whitewater as it passes through an old lock.

Cuyahoga River in Kent Ohio with impressive whitewater as it passes through an old lock. Photo at 4:15 pm November 2nd, 2012 by A. Jefferson.

Flooding downstream of an old dam

Note the water level relative to the trees and those vicious rapids downstream of the lock. The dam in the foreground has been taken off-line and turned into a Heritage Park. Photo by A. Jefferson 4:15 pm 2 November 2012.

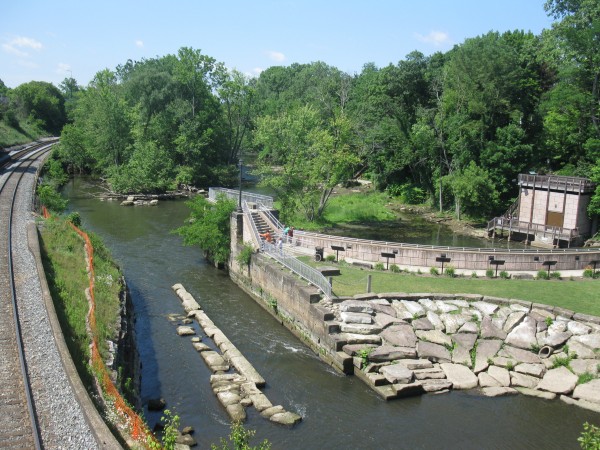
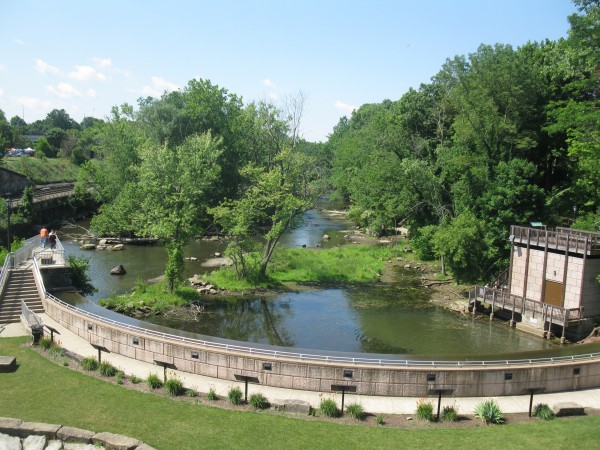
Lock at low water

The same lock structure as above, except at low water levels. June 2012, photo by A. Jefferson. Note complete absence of rapids downstream of the lock.

Similar view looking downstream past the dam as the picture above. Note how much vegetation is above water here.

Categories: by Anne, geohazards, hydrology

DonorsChoose: the final push

A post by Chris RowanA post by Anne JeffersonThanks to the incredible generosity of our geoblogging comrades and readers, our drive to improve earth science education in schools has gone from strength to strength in the past two weeks. Our own challenge, in collaboration with Maitri, has raised almost $1,900, funding 9 projects and bringing geological goodness to more than 900 students.

the Ocean & Geobloggers collective continues to rule the Science Bloggers for Students leaderboard – together with Erik Klemetti’s volcanism-themed drive at Wired, we’ve breached the $5,000 barrier.

The official challenge has 3 days to go, and we’re pleased to inform you that if you donate now, Donorschoose will match the donation to your project. If you give $5, it becomes $10; $10 becomes $20, $25 becomes $50. So there’s never been a better time to make any small contribution you can. All you need to do is type in the match code SCIENCE when you enter your payment details.

Type in the match code SCIENCE, and DonorsChoose will double your donation.

Of the remaining projects we are supporting, some are extremely close to being fully funded:

  • Only $137 is needed for Mrs Braun to buy stream bed trays for her students to model soil erosion. Donate here.
  • Just $195 more to give Ms Sankstone a seismograph and other hands-on equipment for her students to learn inquiry-based science. Donate here.
  • Only $204 to go before Ms. Healey can fund ‘Geology Rocks; lessons that teach students howto read stories hidden in stone. Donate here.

Let’s see if we can push our challenge toward $2,500 before the weekend is out!

Categories: public science, teaching

Stuff we linked to on Twitter last week

A post by Chris RowanA post by Anne JeffersonA rather eventful week in Earth Science this week, so lots of links for you all to enjoy.

Earthquakes

Volcanoes

(Paleo)climate

Water

Environmental

Planets

Fossils

General Geology

Interesting Miscellaney

Categories: links