“If you’re not on a fault zone, a volcanically active zone, or a tsunami zone, you’re probably in a valley that’s prone to flooding or having things tumble down the hills towards you.”
 So opines risk consultant Tony Taig in this excellent article on how the approach to managing seismic risk in New Zealand is changing in the aftermath of the earthquakes that caused so much damage in Christchurch in 2009 and 2010. Of particular note is New Zealanders’ growing realisation that where they build things is just as, if not more, important as how strongly they build them; and that in New Zealand, there is very little ‘where’ that qualifies as truly safe. The article uses the example of Christchurch’s Port Hills region, where the impact of the strong shaking from the magnitude 6.3 earthquake in February 2011 was multiplied by many buildings on top of, and below, steep cliffs that collapsed and loosed heavy boulders during the quake.
This brings up an important facet of how we need to think about the risks posed by earthquakes and other natural hazards to peoples’ lives and livelihoods: assessing the potential impact of these events solely in terms of their size and recurrence interval is only part of the story. Not all severe events are created equal: a magnitude 7 earthquake in the wilds of Siberia is a very different proposition from a magnitude 7 earthquake close to a large city. Or, in a more topical example, the likely destruction wrought by a magnitude 7.8 earthquake is much greater when the rupture occurs 15 km below the surface, as was initially reported for the recent earthquake in southeast Iran, than the 50–80 km depth that it actually seems to have occurred at. It’s all about location, location, location: the worst disasters occur where big natural hazards intersect with places where a lot of us live.
I’ve been toying with how to represent this graphically, by defining events both in terms of their intrinsic severity (with a shallow magnitude 8 earthquake and a 100-year flood being more severe than a shallow magnitude 7 earthquake and a 50-year flood, respectively) and the exposure of human populations and infrastructure (such as cities, roads, and nuclear power stations). In other words, how many of us, and how much of our stuff, are found within the zone impacted? Plotting these two values on separate, orthogonal axes produces a square or rectangle whose area represents the total human impact of an event. A big square means a large impact, of course, but a nice feature of this representation is that it clearly illustrates how if the exposure is large enough, the overall impact of a moderately severe natural event can be just as significant as a more intense event that occurs in an area with less exposure. Conversely, two events of equal magnitude can end up having very different overall impacts, simply by virtue of their different locations.
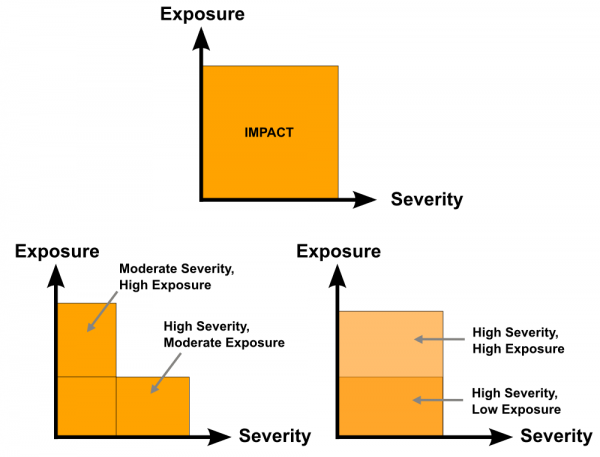
The total human impact of a natural disaster is controlled both by the severity of the event, and how much of our stuff is in the way (exposure). In an area with high exposure, even a moderate severity event can have a large impact.
But this representation ignores another factor that affects the overall impact of a natural disaster. Compare a magnitude 7 earthquake near a large city with strong building codes and high public awareness (say, Christchurch), and a magnitude 7 earthquake beneath a city with many poorly constructed buildings and limited public awareness (say, Port-au-Prince). The different resilience of the two populations and infrastructures will greatly boost the impact of the latter event compared to the former, even if the exposure of these events is roughly the same. To show this we need another axis: one that represents the variable resilience of different parts of the world to their particular brands of geological destruction. To really work with the other two axes, it actually needs to be the inverse of resilience – ‘antiresilience’ (or the much more elegant ‘vulnerability’, as suggested in the comments below); – so that a small value corresponds to a robust, well prepared area where the impact is lessened. With these 3 axes in play, instead of a square that increases in area with increasing impact, we get a cube that increases in volume.
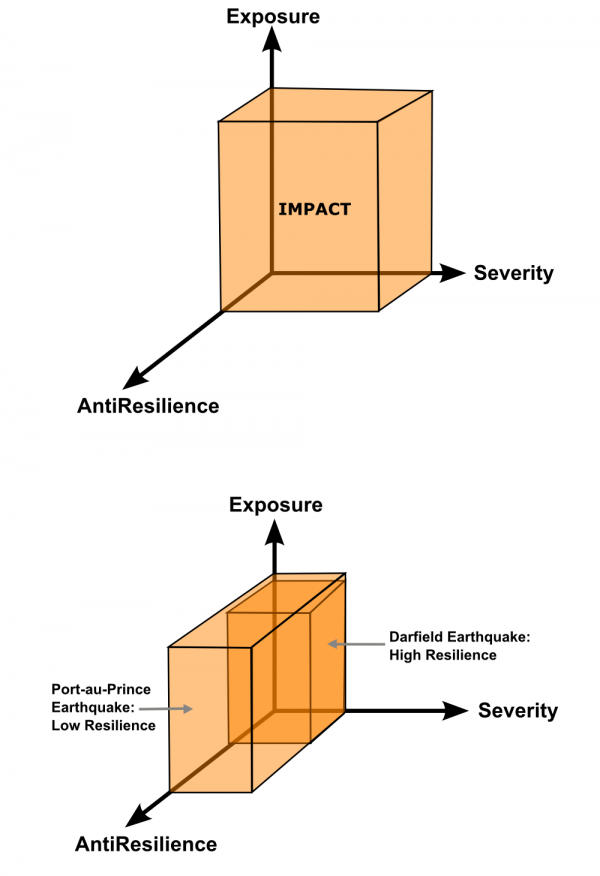
The resilience of an area to a hazard is also an important control, meaning that events of the same severity can have very different impacts.
Resilience is going to be at least partially controlled by event severity; for example, any building will be less resilient to stronger shaking in a large earthquake than it will be to weaker shaking by small tremors. But the key point is that for events of similar severity, there will be stark differences in the average resilience of buildings in Christchurch compared to Port-au-Prince. Leading to the greatly different impacts we have seen in these cities as a result of magnitude 7 earthquakes. Another way of thinking about this is that there is probably a threshold beyond which any defences or preparations for a natural disaster are totally overwhelmed and antiresilience gets very large, but this threshold will probably tend to be higher in well protected and prepared places.
Let’s consider last month’s seismic events in Iran and China. The magnitude 6.3 Zagros earthquake on 9th April was shallow enough to cause strong shaking in the area close the epicentre. it occurred in an area of fairly low population density, which reduced exposure, but what buildings were there had extremely low resilience to shaking (or high antiresilience). Result: At least 37 dead and almost 1000 injured. The magnitude 7.8 earthquake that struck the other side of the country a week later was more powerful, but also deeper; this reduced the shaking intensity above the epicentre, even though the earthquake was felt over a much wider area. This is also a fairly sparsely populated region with non-earthquake resilient buildings, and reports indicate at least 36 dead and 150 injured, mostly in Pakistan. It seems the impact of the 2 Iranian quakes was roughly equivalent, despite the higher magnitude of the second event – and arguably the stronger earthquake had less impact than the smaller one. Then we have the magnitude 6.6 in China on 20 April. It was shallow, so there was strong shaking, and resilience was again fairly low, but when you factor in the much greater population density in Sichuan Province, it becomes much clearer why the impact of this event – 200 dead, and 11,000 injured – was so much higher.
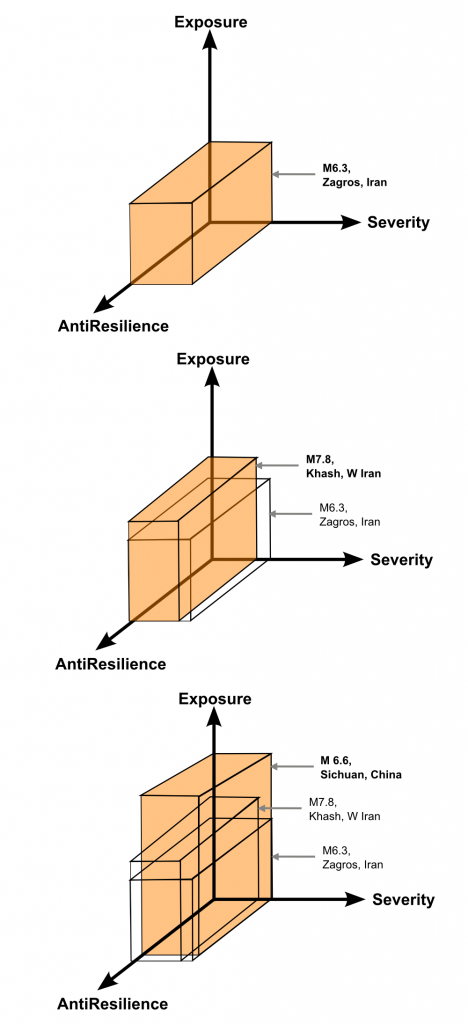
The earthquake in China was not the biggest in terms of magnitude, but as a shallow event in an area with high population density and relatively low resilience, it was the most significant in terms of human casualties and damage.
So thinking in these terms helps us to understand why it is not always the most powerful events that are the most destructive, if a more moderate event occurs in the wrong location. It can also help us look forward: we can identify the places most at risk from high impact events, by combining our (imprecise) knowledge of the occurrence and likely severity of natural hazards in an area, the exposure to such events, and an assessment of how we and our infrastructure will stand up to them. Obviously I’ve mainly been talking about earthquakes, but I think it will work for other hazards as well.

 Anyway, whilst I bask in the kudos and the shiny glory of my pretty winning badge (and some prize money to help keep my web host hosting), my thanks to ScienceSeeker for organising the awards (and letting geosciences take over the physics and astronomy category after some vigorous feedback on Twitter), the judges for reading and liking, and fellow All-geo blogger Simon Wellings for putting my name forward.