We’re just back from a couple of weeks in the UK, which included a week exploring the scenic Peak District in northern England. Interesting geological features abounded from day one, when we took a hike along part of the very well-named River Manifold.
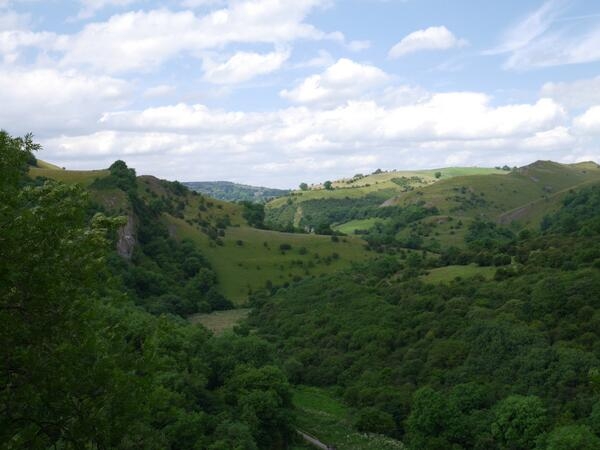
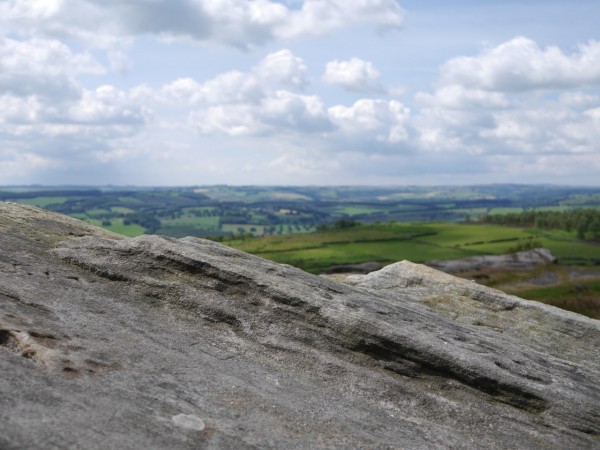
The winding valley of the River Manifold, looking North from Thor’s Cave. Photo: Chris Rowan, 2014.
At least, the ‘Manifold’ bit seems apt: the channel is indeed very windy. Where we first started off, though, the ‘River’ bit seemed a bit shaky, since the channel was completely dry. It rather reminded Chris of the dry-except-in-a-once-in-a-blue-moon-flash-flood channels he saw in Namibia. But this is Britain, which has a reputation for being a little more soggy, shall we say (and indeed, the day before it had been raining rather heavily). So where was all the water?
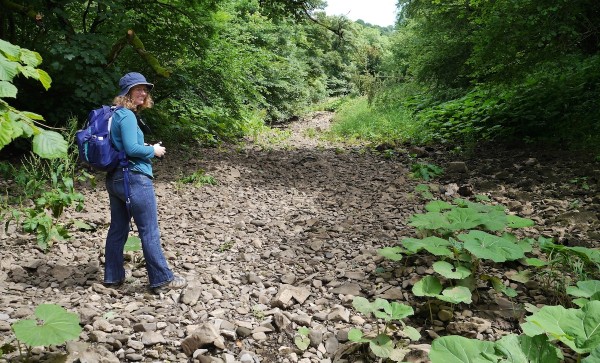
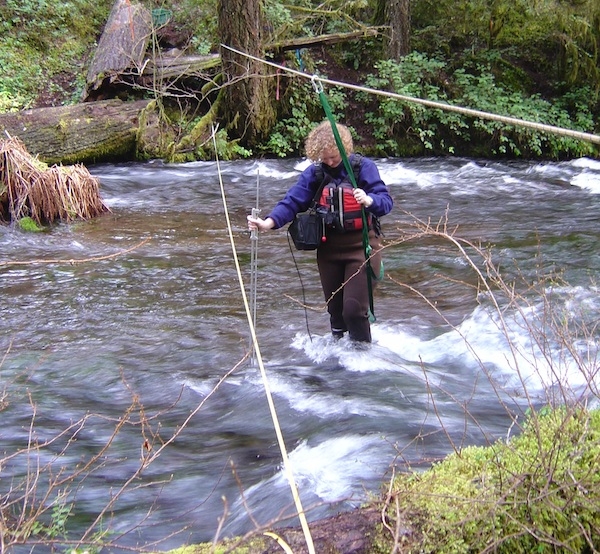
Anne standing in the channel of the River Manifold. No waders required. Photo: Chris Rowan, 2014.
A bit more hiking upstream, and we heard the sound of running water; a bit of clambering back into the river bed, and we saw the rather interesting sight of a fairly full channel of water suddenly disappearing into the ground through a number of sinkholes.
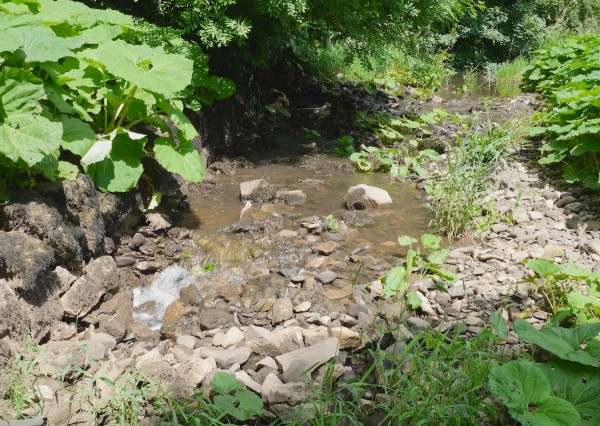
The river caught in the act of disappearing underground into a sinkhole. Photo: Chris Rowan, 2014.

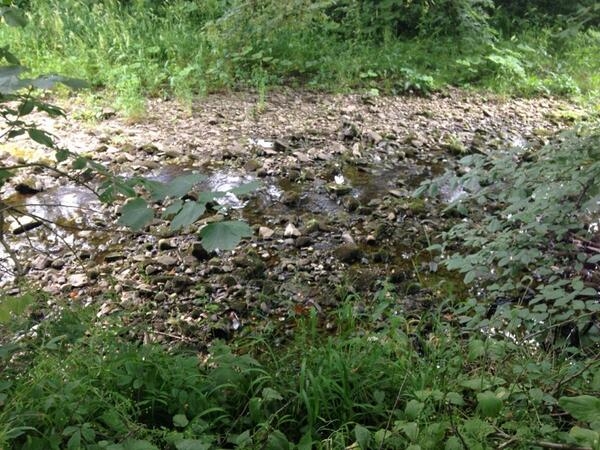
Anne poses next to a sinkhole. Photo: Chris Rowan, 2014.
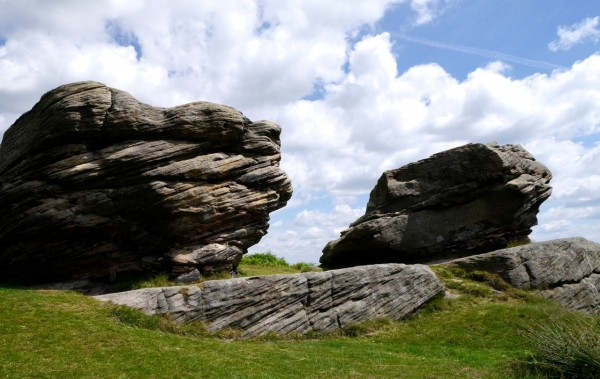
There is a geological reason for this vanishing act, which you may have already guessed from all of the light-coloured debris in the channel bed: the bedrock here is made of early Carboniferous (around 325-360 million years old) limestone. Limestone is prone to dissolving when it comes into contact with slightly acidic rain water, creating of fissures, sinkholes, and underground channels and caves that surface water can escape into (regions where the landscape is dissolving and collapsing in on itself like this are known as karst. Also important in this are is the fact that soon after being deposited, the limestone was deformed in the continental collision that formed Pangaea, opening up lots of tectonic joints and fractures that water can also flow into (and probably enhancing the rate of karst formation).
The interesting thing about the River Manifold is that a clear, continuous channel does exist, indicating that at times of very high rainfall water is being fed into the channel at a higher rate than it can drain underground. Not a hard thing to imagine in this part of the world, and recent heavy rainfall might explain why we found the river disappearing some way downstream of some of the sinkholes (also called swallets) referred to in many guidebooks, and this handy Geotrail Guide.
Of course, having discovered where the river disappeared, our resident water nerd was very keen to find where it came back to the surface again. It is commonly stated that it reappears a few miles downstream in the grounds of Ilam Hall, and when we visited it was easy to find a lot of water being added to the channel at an obvious spring (or ‘boil hole’).
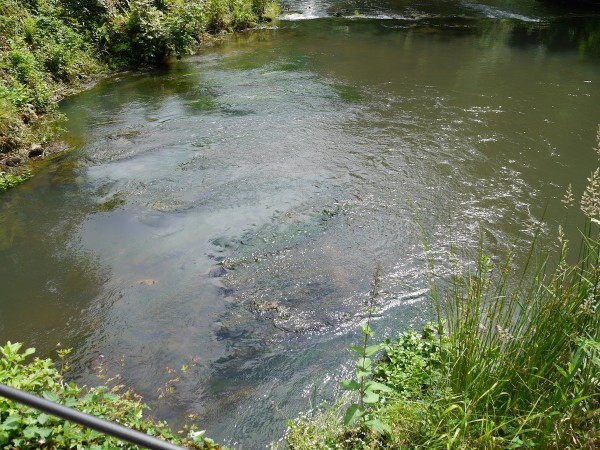
Water refilling the surface channel of the Manifold River from a backside spring in the grounds of Ilam Hall. Photo: Chris Rowan, 2014.
The view from the opposite bank. Photo: Chris Rowan, 2014.
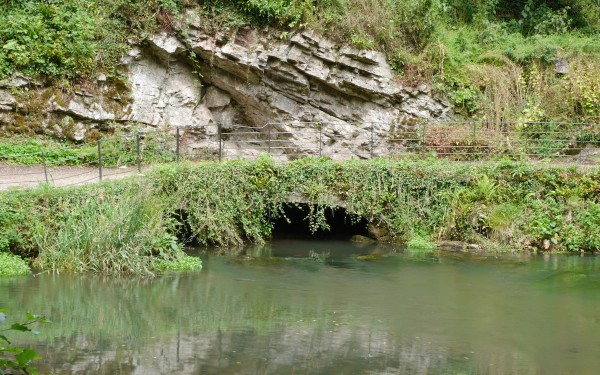
However, although the surface flow was very clearly a lot more anaemic upstream of the spring than it was downstream, there was still some water in the channel for at least a mile – perhaps also a sign of recent heavy rains, or more minor springs. Still, despite shifting about a bit, the dry section of the Manifold, particularly where it remerges, seems fairly constant, suggesting that the well-formed channel at the surface is matched by a fairly clear ‘Subriver Manifold’ running through the limestone around here as well.
Upstream from the Ilam Boil Hole: not completely dry, but much less water in the channel. Photo: Anne Jefferson, 2014.
Both the disappearance and reappearance of water in the channel show up clearly in the current Google Maps satellite imagery, when you zoom in: explore for yourself downstream of one of the major apparent sinkholes near Wetton Mill, and near where it starts to reappear near Ilam.