From composting to ways the Earth can kill you. We’ve got a bit of everything in this week’s roundup.
https://storify.com/highlyanne/environmental-earth-science-roundup-3

From composting to ways the Earth can kill you. We’ve got a bit of everything in this week’s roundup.
https://storify.com/highlyanne/environmental-earth-science-roundup-3
![]() More linky goodness from Anne’s Environmental Earth Science class at Kent State University.
More linky goodness from Anne’s Environmental Earth Science class at Kent State University.
https://storify.com/highlyanne/environmental-earth-science-in-the-news-roundup-2
![]() Anne is teaching Environmental Earth Science this fall. Because environmental earth science is pervasive in our lives, it’s also a frequent topic of news coverage. In order to encourage students to pay attention to where environmental earth science pops up in the news, they are responsible for finding and sharing at least five links over the course of the semester.
Anne is teaching Environmental Earth Science this fall. Because environmental earth science is pervasive in our lives, it’s also a frequent topic of news coverage. In order to encourage students to pay attention to where environmental earth science pops up in the news, they are responsible for finding and sharing at least five links over the course of the semester.
https://storify.com/highlyanne/kent-state-environmental-earth-science-news-roundu
![]() This semester I’m teaching Environmental Earth Science to a fantastic group of students at Kent State. In tomorrow’s class about fossil fuels, we’ll be talking about coal formation, use, and environmental consequences. A big one I think they should be aware of is the practice of mountaintop removal mining in West Virginia. We’ve already talked about it a bit, but I think this video gives some nice visuals, even if the narration veers a bit from overly dramatic to “boys with toys”.
This semester I’m teaching Environmental Earth Science to a fantastic group of students at Kent State. In tomorrow’s class about fossil fuels, we’ll be talking about coal formation, use, and environmental consequences. A big one I think they should be aware of is the practice of mountaintop removal mining in West Virginia. We’ve already talked about it a bit, but I think this video gives some nice visuals, even if the narration veers a bit from overly dramatic to “boys with toys”.
From the Smithsonian:
Several well-respected scientists are working to figure out the impact of mountaintop removal mining on stream ecosystems. The coal companies haven’t exactly lined up to fund their work and provide access to the sites. So what *do* we know about the impacts of mountaintop mining on Appalachian streams and rivers? Here’s just one example, from the abstract of Bernhardt and Palmer (2011):
Southern Appalachian forests are recognized as a biodiversity hot spot of global significance, particularly for endemic aquatic salamanders and mussels. The dominant driver of land-cover and land-use change in this region is surface mining, with an ever-increasing proportion occurring as mountaintop mining with valley fill operations (MTVF). In MTVF, seams of coal are exposed using explosives, and the resulting noncoal overburden is pushed into adjacent valleys to facilitate coal extraction. To date, MTVF throughout the Appalachians have converted 1.1 million hectares of forest to surfacemines and buried more than 2,000 km of stream channel beneath mining overburden. The impacts of these lost forests and buried streams are propagated throughout the river networks of the region as the resulting sediment and chemical pollutants are transmitted downstream. There is, to date, no evidence to suggest that the extensive chemical and hydrologic alterations of streams by MTVF can be offset or reversed by currently required reclamation and mitigation practices.
Here’s an overview of the consequences and some suggested policy recommendations, presented in Science in 2010.
Among the scientists working on the environmental consequences of mountaintop removal, Margaret Palmer has become perhaps the most visible. Here she is on the Colbert Report:
(Note: the content appears to be unavailable tonight. Hopefully it will be made available again soon.)
Finally, here’s an profile of Margaret Palmer and her work on mountaintop removal mining, published earlier this year in Science magazine.
For more information:
![]() In the early hours of Sunday morning, the Napa Valley region north of San Francisco was shaken by a magnitude 6 earthquake, the largest to hit this region since the magnitude 6.9 Loma Prieta earthquake in 1989. An earthquake in wine country produces dramatic visuals of wine bottles thrown from the shelves and leaking into the street, and there was strong shaking and significant damage in the region close the the epicentre. But in the grand scheme of things, a magnitude 6 earthquake is not particularly large: it may have been strong enough to wake people up in San Francisco (as data from fitness trackers has rather cleverly been used to illustrate), but it didn’t pack enough of a punch to do any real damage there.
In the early hours of Sunday morning, the Napa Valley region north of San Francisco was shaken by a magnitude 6 earthquake, the largest to hit this region since the magnitude 6.9 Loma Prieta earthquake in 1989. An earthquake in wine country produces dramatic visuals of wine bottles thrown from the shelves and leaking into the street, and there was strong shaking and significant damage in the region close the the epicentre. But in the grand scheme of things, a magnitude 6 earthquake is not particularly large: it may have been strong enough to wake people up in San Francisco (as data from fitness trackers has rather cleverly been used to illustrate), but it didn’t pack enough of a punch to do any real damage there.
There have already been some excellent write-ups of the geology of the earthquake by Mika Mckinnon, Dana Hunter and Garry Hayes: in brief, the root cause of all earthquakes in California is its location on the boundary between two rigid but independently mobile bits of the Earth’s crust: the Pacific and North American plates. The Pacific plate is moving northwest relative to the North American plate at around 4 centimetres a year, and the focal mechanism for Sunday’s quake is consistent with right lateral strike slip on a northwest-southeast oriented fault, which is what we’d predict for a fault at this plate boundary. But interestingly, we are clearly some way (about 50 kilometres) to the east of the San Andreas Fault, which is popularly considered to be ‘the’ plate boundary in California.
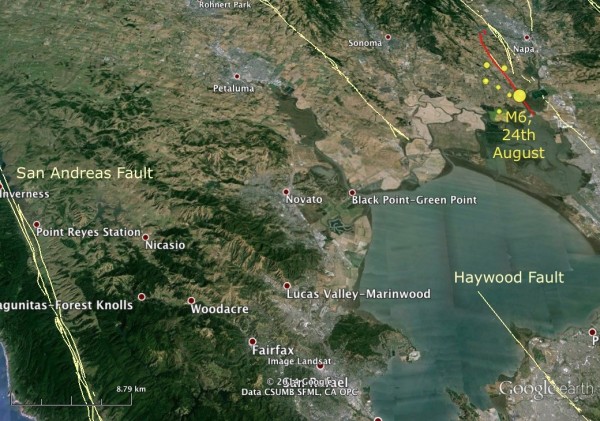
Location of Sunday’s earthquake relative to the San Andreas Fault. Yellow lines mark faults thought to have been active in the last 130,000 years, according to USGS mapping. The red line is the rough surface trace of Sunday’s rupture, as mapped by Mike Oskin’s speedy students, which appears to be associated with a previously unmapped strand of the West Napa Fault Zone.
This event actually nicely illustrates the nature of the plate boundary in California: we are not looking at a single line in the crust, where you can step directly from one plate to another, but a broad deforming zone. Nowadays, we have some lovely data that shows this directly, courtesy of the abundance of GPS stations deployed all through the western US. The red arrows in the figure below show contemporary motion of the crust relative to North America measured at seven stations, the most westerly of which is on the seaward side of the San Andreas Fault, and can therefore be considered to represent the Pacific plate. Although there is a significant drop in the rate at which crust is being dragged to the northwest after crossing the San Andreas, the crust in this region is still moving relative to the stable interior of the North American plate at some fraction of the Pacific plate’s velocity. As you move inland, each time you cross one of the mapped fault systems – which are themselves complicated amalgamations of anastomosing fault segments – the measured GPS velocity drops further, indicating that these systems are all actively involved in accommodating plate motions.
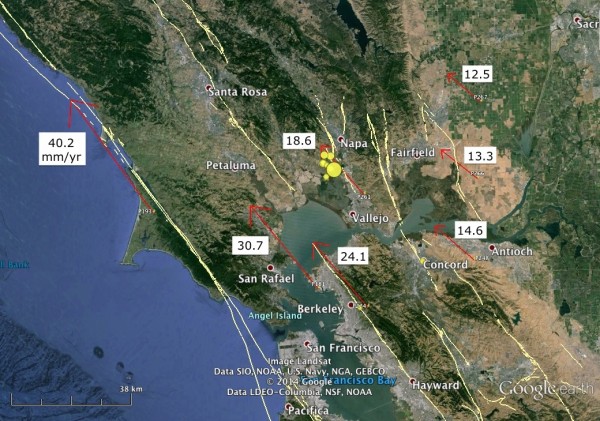
GPS velocities (in mm/yr) for selected UNAVCO Plate boundary observatory stations in Northern California.
The astute amongst you will note that even as the GPS velocity seems to stabilise 60-80 km inland from the San Andreas, it is still not zero; even here, the crust is not fully attached to North America. To get to the stable, non deforming bit, we still have to get across the Basin and Range, and before we get to that we have to cross the apparently more rigid Sierra Nevada mountains. The plate boundary in the western US is far from a well-defined line. On the plus side, this makes it much more interesting geologically; on the negative side, a broad zone of many faults makes estimating the seismic risk much more ‘interesting’, too.