Anne’s picks of the June literature: Fluvial Geomorphology and Landscape Evolution

ResearchBlogging.orgA post by Anne JeffersonHow do rivers erode bedrock streams, during big floods, and in the presence of groundwater? Laboratory and accidental experiments are providing some cool new insights.

Johnson, J., & Whipple, K. (2010). Evaluating the controls of shear stress, sediment supply, alluvial cover, and channel morphology on experimental bedrock incision rate Journal of Geophysical Research, 115 (F2) DOI: 10.1029/2009JF001335

Take a moment to contemplate the title of this paper…experimental bedrock incision rate….how do you measure something like bedrock incision in an experimental setting? how do you measure it in time scales than can be accomplished in the laboratory? Johnson and Whipple figured out how to do it – building a weak concrete streambed in a flume at the National Center for Earth-surface Dynamics and then conducting a series of experiments to isolate each of the variables. Their study is related to question of the role of loose sediment in controlling the rates of bedrock river erosion. When does sediment act as a “tool” for erosion by banging into the river bed and abrading it, and when does sediment act as a “cover” for the river bed, protecting it from just such abrasion? Do these two effects create a trade-off suggesting that at some optimal level of sediment abundance, erosion rates are maximized? Johnson and Whipple’s experiments showed that erosion rates increased linearly with sediment flux , but decreased linearly with the extent of sediment cover. They also demonstrated that the extent of sediment cover was function of the ratio of sediment flux to sediment transport capacity, although it was sensitive to local topographic roughness. Their experiments also showed some interesting patterns of how bed roughness develops from focused erosion in interconnected topographically low areas (e.g., @colo_kea’s great video of the Skagway River), but that this development was muted by variations in discharge and sediment flux.* Also note that Johnson, Whipple, and L. Sklar have another new paper out, contrasting rates of bedrock incision from snowmelt and flash floods in Utah’s Henry Mountains. That paper is in GSA Bulletin.

Lamb, M., & Fonstad, M. (2010). Rapid formation of a modern bedrock canyon by a single flood event Nature Geoscience, 3 (7), 477-481 DOI: 10.1038/ngeo894

In 2002, a dam overspill in Texas created a 7 m deep, 1 km long gorge in jointed bedrock and this article by Lamb and Fonstad examines the mechanics of gorge formation and the importance of plucking as erosional mechanism. Brian Romans (Clastic Detritus) has written a nice post on this article and how it links to ideas of uniformitarianism and Kyle House posted before and after photos at Pathological Geomorphology.

Pornprommin, A., & Izumi, N. (2010). Inception of stream incision by seepage erosion Journal of Geophysical Research, 115 (F2) DOI: 10.1029/2009JF001369

An experimental study in layered sediment showed that seepage-drive scarp retreat was a function of the discharge per unit area and “a diffusion-like function that describes the incision edge shapes.” That diffusion-like function was then related to the weight of the failure block and hydraulic pressure. This paper potentially has some insights for thinking about landscape evolution in groundwater-rich areas (like I tend to do) and for those interested in slope stability analyses.*

* Please note that I can’t read the full article of AGU publications (including WRR, JGR, and GRL) until July 2011 or the print issue arrives in my institution’s library. Summaries of those articles are generally based on the abstract only.

Categories: by Anne, geomorphology, paper reviews

Anne’s picks of the June literature: Watershed Hydrology

ResearchBlogging.orgA post by Anne JeffersonIt starts when when a water molecule in precipitation lands on the ground, and it ends when that same water molecule leaves the watershed as streamflow. In between, that molecule may move over the land surface, through the soil in big holes (macropores) or in tiny spaces between grains in the soil, through the bedrock as groundwater, or any combination of those pathways. How long it takes for the water molecule to make its journey, what hydrologists call the transit time, depends on the flow paths that it takes. And that transit time, in turn, affects biogeochemical processing and contaminant persistence. Inversely, if hydrologists can measure the distribution of transit times for a particular watershed, they can infer things about the storage, flowpaths, and sources of water in the watershed. Thus, transit time distributions help us peek into the hidden inner workings of the watershed….if we understand what we are really measuring and what those measurements are really telling us. And that topic is one of lots of active research in the community of watershed hydrologists, and its the subject of a number of recently published papers.

In what seems to be an annual tradition, Hydrological Processes has devoted their June issue to topics relating to catchment hydrology and flowpath tracers. This year, the focus is Preferential Flowpaths and Residence Time Distributions and it’s edited by Keith Beven. It’s the sort of issue that makes me want to go over to the library stacks and spend the day in a comfy chair reading and enjoying the journal from cover to cover. While all of the articles in this special issue make my pulse race a little, here are a couple that really strike my fancy:

McDonnell, J., McGuire, K., Aggarwal, P., Beven, K., Biondi, D., Destouni, G., Dunn, S., James, A., Kirchner, J., Kraft, P., Lyon, S., Maloszewski, P., Newman, B., Pfister, L., Rinaldo, A., Rodhe, A., Sayama, T., Seibert, J., Solomon, K., Soulsby, C., Stewart, M., Tetzlaff, D., Tobin, C., Troch, P., Weiler, M., Western, A., Wörman, A., & Wrede, S. (2010). How old is streamwater? Open questions in catchment transit time conceptualization, modelling and analysis Hydrological Processes, 24 (12), 1745-1754 DOI: 10.1002/hyp.7796

In this invited commentary, McDonnell and 28 colleagues lay out the definition of transit time and the current limits of our understanding on its controls in watersheds and its relationship to hydrograph characteristics, groundwater, and biogeochemical processing. They then provide their research vision for pushing past these limits, through a combination of field research and advances in modeling.

Kirchner, J., Tetzlaff, D., & Soulsby, C. (2010). Comparing chloride and water isotopes as hydrological tracers in two Scottish catchments Hydrological Processes, 24 (12), 1631-1645 DOI: 10.1002/hyp.7676

Oxygen isotopes of water and chloride concentrations have been widely used to estimate watershed travel times. They are generally regarded as conservative tracers, but they are not perfect. Here Kirchner et al. compare the time series of the two tracers for a pair of Scottish catchments and show that while both tracers exhibit strongly damped signals relative to precipitation, the travel times calculated using oxygen isotopes were 2-3 times longer than for chloride. So it seems that both tracers are telling us similar things about the ways that catchments move and store water, but that quantitative estimates of travel time are going to be tricky to compare across tracers.

Stewart, M., Morgenstern, U., & McDonnell, J. (2010). Truncation of stream residence time: how the use of stable isotopes has skewed our concept of streamwater age and origin Hydrological Processes, 24 (12), 1646-1659 DOI: 10.1002/hyp.7576

The stable isotopes of water have a shelf life of about 5 years or less. It’s not that they break down (they are stable isotopes, after all); it’s that seasonal input signals get damped over time, so that ages greater than 5 years can’t be resolved. In contrast, tritium (the unstable isotope of hydrogen) has a half life of ~12.4 years. A few decades ago, water ages were estimated using tritium, which conveniently had a bomb peak that made a handy marker of recharge in the early 1960s. These days, water ages are usually estimated by the stable isotopes alone. In this paper, Stewart et al suggest that we are missing part of the story when we use just stable isotopes, because we effectively discount any contributions from water >5 years since it feel from the sky. Incidentally, those contributions that we have been neglecting? That’s the bedrock groundwater and it might be quite important to explaining the behavior of streams. Stewart et al. suggest that we return to embracing tritium as part of a “dual isotope framework” so that we can more accurately quantify groundwater contributions to streamflow. The issue of the shape of travel time distributions (are they exponential or fractal?) is explored in more detail in a paper by Godsey et al. in the same issue and Soulsby et al. explore how relationships between transit times and hydrograph and watershed characteristics might be used to estimate streamflows in data-sparse mountain watersheds.

Categories: by Anne, hydrology, paper reviews

The Gulf of Mexico spill is bad enough without turning it into a disaster movie

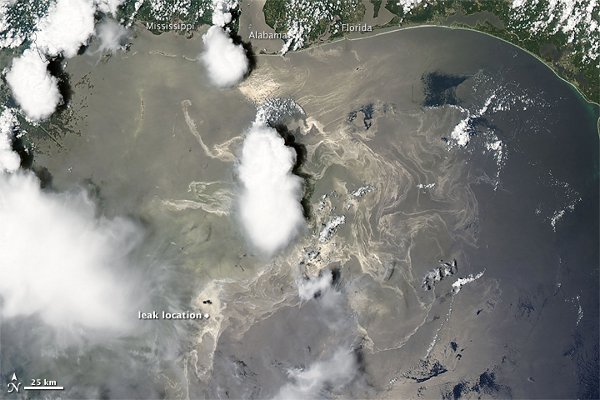
A post by Chris Rowan It seems that pictures like this are not enough for some people:

Source: NASA Earth Observatory

The millions of barrels of oil that have leaked from the blown out Macando well in the wake of the Deepwater Horizon disaster are going to disrupt the ecology and economy of the entire Gulf of Mexico for months and years to come. But it seems that we shouldn’t be worrying about that. No, what we should be worrying about is the eruption of a giant, 20-mile wide methane bubble from the seabed, generating a megatsunami that would wipe out most people in the Gulf region and poisoning any survivors, before going on to poison the rest of the planet, too.

If anyone is wondering whether this is a credible threat, the only polite answer is an emphatic ‘no’. The facts being warped beyond breaking point to generate this ludicrous scenario are as follows:

  • There is probably a lot of methane gas stored in the deepwater sediments of the Gulf of Mexico. But it is not free gas. It is in the form of clathrates, or gas hydrates, which are a form of ice that traps a lot of gases like methane into a solid lattice. Hydrates generally occur in small patches that are widely spread throughout the sediment, rather than in one huge blob. The large volumes that are talked about are due to the large areas of the continental slope where the temperature is low enough, and the pressure high enough, to allow clathrates to form. The idea that there is a huge, continuous, high pressure reservoir of gas beneath the sea floor, just waiting to explode, is fundamentally mistaken. If there was, do you think BP would drill through a vast, easily obtainable hydrocarbon resource to get to a more technically challenging reserve?
  • It is also true that gas hydrates are not particularly stable. A small decrease in pressure or increase in temperature can cause them to break down and release the gas that they are storing. Indeed, it has been theorised that destabilisation of the clathrates around the well, due to heat released by the curing of the cement seal, is what caused the well to blow out in the first place. Could continuing clathrate breakdown in the region around the well account for the high amounts of methane coming from the leaking well? It’s possible, but as far as I know still unproven. More importantly, only a vanishingly small percentage of the clathrates, the ones immediately surrounding the borehole, are going to be at all affected by its presence. To release the catastrophic amounts being proposed requires a basin-wide change due to warming of the bottom waters or a drop in sea level. Even BP haven’t screwed things up that much.
  • Even if a large volume of clathrates was somehow destabilised (which, as I’ve just pointed out, is not going to happen in this case), you still wouldn’t get a single, apocalyptic, megatsunami-generating explosion.That would require large amounts of gas being produced in a small volume much faster than it can escape, so very high pressures can build up in the surrounding rock and blow it apart from within (this is what happens in an explosive volcanic eruption). In this case, the gas hydrates are in sediments that are just beneath the sea floor, which aren’t even truly rock yet – more like a thick and soupy mud. Because of this, they are fairly permeable to fluids and gas migrating through them, so any gas that is being produced can mostly escape up through the sea bed before dangerous pressures can build up. And because the clathrates are distributed over a large area rather than all being in one place, there will be many, many vent sites, not just one big one.

This doesn’t mean the methane being released from the leaking well isn’t worrying: in fact, it’s potentially a huge ecological problem for the Gulf of Mexico. Bacteria in the water column will happily respire it and use up all the oxygen, creating the ‘dead zones’ we’re hearing so much about. Seriously, isn’t reality bad enough? Do we really need to pretend we’re in a Michael Bay movie?

Click through for the xckd's eerily prophetic punchline

Categories: environment, geohazards

Anne’s picks of the June literature: Humans as Agents of Hydrologic Change

ResearchBlogging.orgA post by Anne JeffersonJune saw the publication of a number of excellent articles about the consequences of human activities on rivers and sea level and how those consequences aren’t always as straightforward as they might first appear.

Immerzeel, W., van Beek, L., & Bierkens, M. (2010). Climate Change Will Affect the Asian Water Towers Science, 328 (5984), 1382-1385 DOI: 10.1126/science.1183188

Where do 1 in 4 people live? Where do those people get their water? 1.4 billion people live in five river basins (Indus, Ganges, Brahmaputra, Yangtze, and Yellow) and those mighty rivers source some of their water in the Himalayas, where on-going climate change will have a big impact on glacier melt and seasonal precipitation. In this paper, Immerzeel and colleagues used the SRM hydrologic model and GCM outputs to simulate the years 2046-2065 under two different glacier extent scenarios, a “best-guess” and an extreme case where all glacier cover had disappeared. The five basins all behaved quite differently from each other, because each basin has a different topographic distribution. The Brahmaputra and Indus have the highest percent of glacier-covered area, and these two rivers will be the most severely impacted by projected climate change via decreases in late spring and summer streamflow, as reduced glacier melt is only partially offset by increased spring rains. Between these two basins, the authors estimate that the hydrologic changes will reduce the number of people who can be fed by 60 million people! On the other hand, basins with less reliance on meltwater will not be as bad off – in fact, the Yellow River is likely to experience an increase in spring streamflow and may be able to feed 3 million more people. To me this paper emphasizes the fact that the consequences of climate change are not going to be evenly dispensed across the world’s population and that we’ve really got an urgent task of figuring out how regional climate changes will cascade through hydrology, ecology, food security, disease, and almost every other aspect of the world on which we depend.

Fiedler, J., & Conrad, C. (2010). Spatial variability of sea level rise due to water impoundment behind dams Geophysical Research Letters, 37 (12) DOI: 10.1029/2010GL043462

Global reservoirs trap ~10,800 cubic kilometers of water – enough volume to reduce sea level by ~30 mm. But when large reservoirs are filled, the water weight locally depresses the Earth’s surface and increases local relative sea level. Thus, tide gages that are close to large reservoirs don’t record the true sea level effects of water impoundment – instead recording only about 60% of the true drop. This creates an added wrinkle in the estimation of global sea level rise over the last century, and Fiedler and Conrad compute that these reservoir effects on the geoid have caused an ~10% over-estimation in rates of sea level rise. The largest effects on sea level rise records are places where tide gages are near big reservoirs – like the east coast of North America. *

* Please note that I can’t read the full article of AGU publications (including WRR, JGR, and GRL) until July 2011 or the print issue arrives in my institution’s library. Summaries of those articles are generally based on the abstract only.

Categories: by Anne, climate science, hydrology, paper reviews

Welcome to the Tertiary

A post by Chris RowanA post by Anne JeffersonWelcome to the new home of Highly Allochthonous, and thank you for joining us. We realise this change is rather unexpected; believe us, we share your surprise. But these things do happen in geology: just when the planet seems to have settled down into some sort of equilibrium, a mountain range shoots up, an ocean opens, or a big asteroid streaks in from the outer reaches of the solar system to shake things up a little, and suddenly the world is a very different place. This pattern of events has shaped the construction of the geological timescale, so it seems only appropriate to borrow the name of a geological period for the title of our opening post. As this is the third incarnation of the blog, the Tertiary is the obvious choice; and it’s actually looking for something to do anyway, having been cast out of the official timescale by some overly pedantic geochronologists.

Anyway, we’re keen to get back to our usual blogging schedule, and we’re excited about the new possibilities opened up by the move to our own digs. But first, a couple of housekeeping notes:

  • We are now the proud owners of the domain all-geo.org. We have some ideas for the front page, but for now, as it links though to the blog, you can simply rejoice that you can now get to Highly Allochthonous without having to remember how to spell ‘allochthonous’.
  • It turns out that transferring all of our posts, comments and images over from Moveable Type into WordPress is non-trivial*, and while we’ve done our best to get everything straight, there is likely to be the odd broken link here and there. If you should happen to find one, please let us know.
  • The look and feel of the blog may be subject to slight tweaks as the whim takes us. We didn’t get much time to pick out the curtains, after all.
  • Finally, we would really appreciate it if those of you with blogs and Twitter accounts would help us to spread the word about our new address.

*translating from scientese: really _____ing hard.

Categories: bloggery