The power of plate tectonics lies in its simplicity: the Earth’s surface is a planetary jigsaw puzzle made up of a couple of dozen rigid, interlocking pieces, and most geological activity on the planet, past and present, is a result of the interactions between these pieces as they either move apart, or bump and grind together. However, understanding that the plates move, and being able to measure their past and present motions, doesn’t mean that we completely understand why they move the way that they do. For example, most plates drift across the face of the planet at roughly the same speed that your fingernails grow: perhaps five centimetres a year. But sometimes they can move much faster, as palaeomagnetic results from India demonstrate [1]. 80 million years ago, as India rifted away from Madagascar during the break-up of Pangaea, it was located about 40 degrees south; 50-55 million years ago – barely a geological eye-blink later – it was almost at the equator, crashing headlong into Asia to create the Himalayas.
This corresponds to a total drift of about 4500 kilometres in only 15-20 million years, or almost 20 centimetres a year; in contrast, during the same time interval Africa, Antarctica and Australia, India’s Pangaean neighbours, were drifting around at less than 5 cm/yr. Why the large disparity? New geophysical data, published last week in Nature [2], suggest that the explanation for the Indian plate’s unseemly haste may lie in its surprisingly streamlined underbelly.
‘Plate’ is not a synonym for ‘crust’; the upper part of the mantle, known as the lithosphere, is also cold and strong enough to act rigidly over geological timescales. Thus, the base of a plate is not defined by a change in composition, but by a change in mechanical properties: it is the point at which mantle rocks become warm and weak enough to deform plastically, which marks the transition into the convecting asthenosphere. Think of ice covering a pond in winter – it’s still water, but its reduced temperature has made it strong enough to support your weight, unlike the stuff it covers (don’t think that this means that the asthenosphere is fluid in the ‘molten lava’ sense, though – it is still many orders of magnitude more viscous than the stickiest treacle).
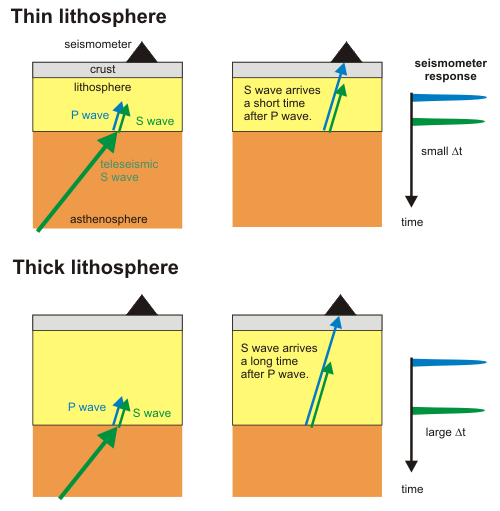
Because the boundary between lithosphere and asthenosphere is controlled by temperature, and because older usually corresponds to colder, plate thickness generally increases with age, with the thickest lithosphere of all found beneath the ancient centres of the continents. Here, the upper mantle has had billions of years to cool down, so the lithosphere can extend 250 km or more below the surface. But it doesn’t always, and this is what Prakash Kumar of the Indian National Geophysical Research Institute and his colleagues were investigating using some rather clever seismological trickery. For reasons that are still not completely understood, the boundary between the lithosphere and asthenosphere (LAB) is fairly abrupt, so has strong effects on seismic waves passing through it. One such effect is the creation of converted phases; some of the energy in a transverse S-wave can be converted to compressional P-waves as it passes across the boundary, or vice-versa. In the figure below, an S-wave generated by a distant earthquake encounters the base of the lithosphere, and is split in two, with a secondary P-wave being generated alongside the original S-wave. Both of these waves leave the boundary at precisely the same time, but in any given medium, a P-wave will move faster than an S-wave. Therefore, if the lithosphere is thin, the converted P-wave will arrive at the surface only a little before its parent S-wave does; but if the lithosphere is thick, then the P-wave has more time to pull ahead and the time difference will be much larger.

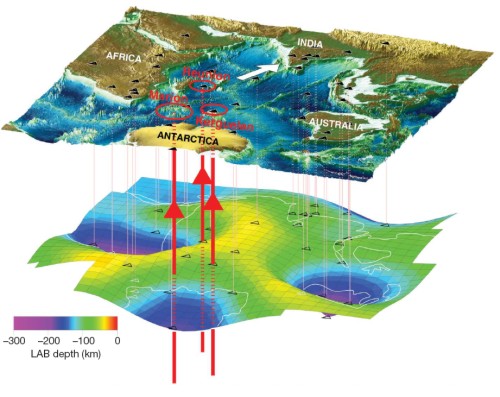
What Kumar and his colleagues have found that the difference in arrival times for converted and parent waves generated beneath Southern Africa, Antarctica, and Australia is usually between 20 and 30 seconds, which is consistent with very thick lithosphere – almost 300 km in the case of South Africa. However, the time differences recorded by stations in India are only about 10 seconds; this suggests that the lithosphere beneath the subcontinent is a mere 100 km thick, much thinner than you might expect for such old crust. The authors suggest that it was not always thus: diamond-bearing kimberlites found on the Indian craton are strong evidence that the lithosphere beneath was once comparable in thickness to that found beneath the other cratons surveyed (kimberlites are only formed by the melting of continental lithosphere at depths of more than 150 km), and that it has actually got thinner with age. The break-up of southern Pangea appears to have coincided with the impact of several mantle plumes between 180 and million years, and it is possible that the upwelling plumes provided a pulse of heat which ‘reset’ the lower parts of the Indian lithosphere back to asthenosphere, creating a much thinner tectonic plate after rifting was complete.

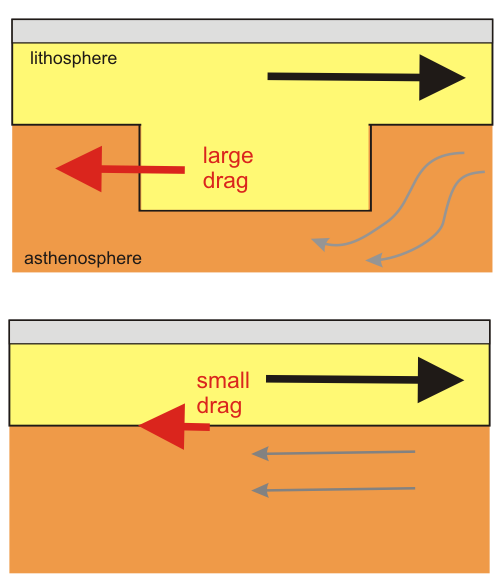
Here, then, is a possible explanation for India’s speedy geological past. Most plates incorporate a chunk of old continent with a thick lithospheric root projecting down into the asthenosphere, generating drag and slowing plate motions. The apparent removal of India’s lithospheric root would have considerably reduced the drag on the bottom of the plate, potentially allowing much faster movement.

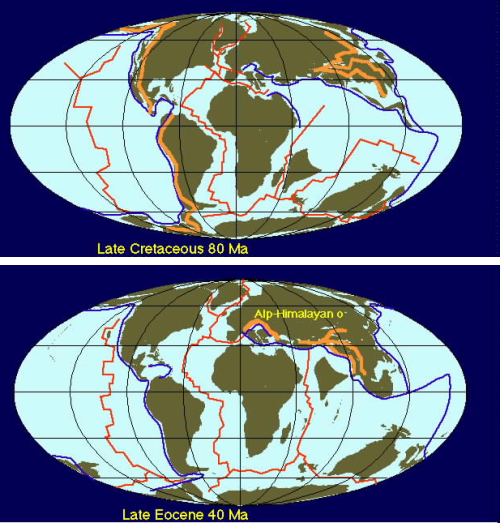
It’s an interesting idea, but I’m not sure that it’s the whole story. Of all the forces driving plate motion, the drag exerted by subducting slabs as they descend back into the lower mantle is thought to be particularly important. The maps at the top of this post indicate that in the Late Cretaceous, the closure of the Tethys Sea was accomplished by subduction along the entire northern edge of the Indian plate; in contrast, the Africa and Antarctic plates were mainly rimmed by spreading ridges. Plume-induced streamlining may have helped the Indian plate to leave its tectonic rivals in the dust, but a subduction-induced turbo-boost probably didn’t hurt, either.
[1] Klootwijk, CT et al. (1992). Geology 20, p395-98.
[2] Kumar, P et al. (2007). Nature 449, p894-97.


Comments (7)