![]() It’s hardly surprising that my browsing this week has been focussed largely on the aftermath of the earthquake and tsunami in Japan (which is now officially being referred to as the Tohuku earthquake, rather than the Sendai earthquake; I’d complain this was harder to pronounce but I’m hardly in a position to on this blog). Given this, in place of our normal Twitter links round up, we have an earthquake link-fest instead.
It’s hardly surprising that my browsing this week has been focussed largely on the aftermath of the earthquake and tsunami in Japan (which is now officially being referred to as the Tohuku earthquake, rather than the Sendai earthquake; I’d complain this was harder to pronounce but I’m hardly in a position to on this blog). Given this, in place of our normal Twitter links round up, we have an earthquake link-fest instead.
General
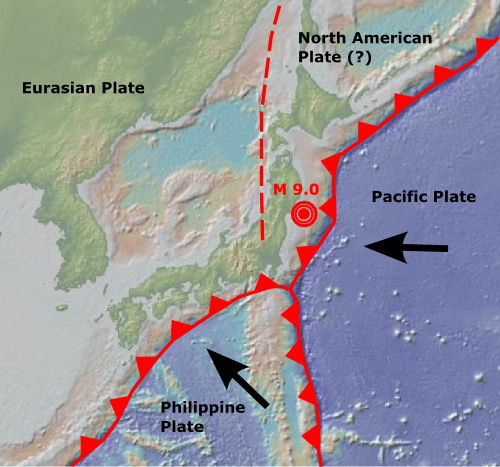
- For those who are still trying to understand exactly how the plate boundaries that intersect near Japan are structured, this figure, which I put together for my post on the Scientific American guest blog, may be helpful.

The location of Friday's earthquake, with respect to the numerous plate boundaries that intersect near Japan. Base map generated by GeoMapApp (http://www.geomapapp.org/)
- What are the forces at work at subduction zones that turn constant and relatively smooth plate motions into the jerky stick-and-slip behaviour of earthquake-generating faults? It’s all about friction, as Matt Kuchta demonstrates with an ‘Earthquake Machine’ constructed from a brick, spring and sandpaper.
- As Dave Petley argues at The Landslide Blog, the Tohuku earthquake is entirely consistent with our understanding of how subduction zones work. However, the size of this particular earthquake does seem to have been a little beyond what was expected from this particular subduction zone. Old, cold oceanic crust, such as the Pacific plate being subducted beneath north Honshu, was thought to lead to smaller megathrust earthquakes than younger, more buoyant oceanic crust (such as what is being thrust beneath Cascadia, for example) because the lower buoyancy would lead to reduced friction at the plate boundary. Clearly, this is not the case, and may lead to us having to rethink the seismic hazards at “safer” subduction zones.
- Sumatra, Chile, and now Japan, all in less than a decade: could there be a causal link between large megathrust events around the world? New Scientist explores the idea that great earthquakes could beget more great earthquakes. Sadly, it is very hard to do meaningful statistics on the small numbers and timescales represented by our instrumental records. Perhaps paleotsunami research can eventually provide some insight into this question.
- We can’t predict earthquakes: any claims to the contrary either involve “precursors” that throw up more false positives than hits, or predictions so general that they can hardly fail to be “fulfilled”. Progress, however, is being made in earthquake forecasting – identifying areas that are particularly at risk from damaging earthquakes, even if one can’t say exactly when.
Deformation
- Modelling based on the data received by the global seismograph network indicates some parts of subduction thrust may have slipped up to 55 m. GPS stations on the east coast of Honsu also moved up to 4.4 metres east and 0.75 m down as the elastic strain built up there in the time since the last major rupture was released. The video below (from the University of Alaska Fairbanks Geophysical Institute) animates the motion of the
- In the longer term, the deformation from this earthquake has changed the stress conditions on other faults in the nearby area, including adjacent segments of the Japan Trench and the other subduction zones near Japan. Any stress increases on segments that haven’t ruptured recently might significantly increase the risk of earthquakes in the not-to-distant future. Andrew Alden has had a look at the preliminary stress analysis, which indicates that the loading on the subduction zone to the south – where the Pacific plate is being subducted beneath the Philippine Plate – may have been slightly increased.
- One thing you don’t need to worry about is this earthquake triggering an eruption of Mt. Fuji. Erik Klemetti explains why you shouldn’t panic.
Aftershocks
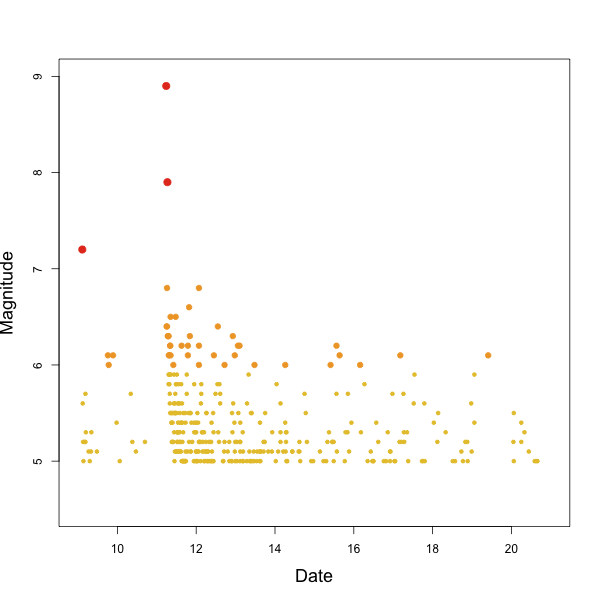
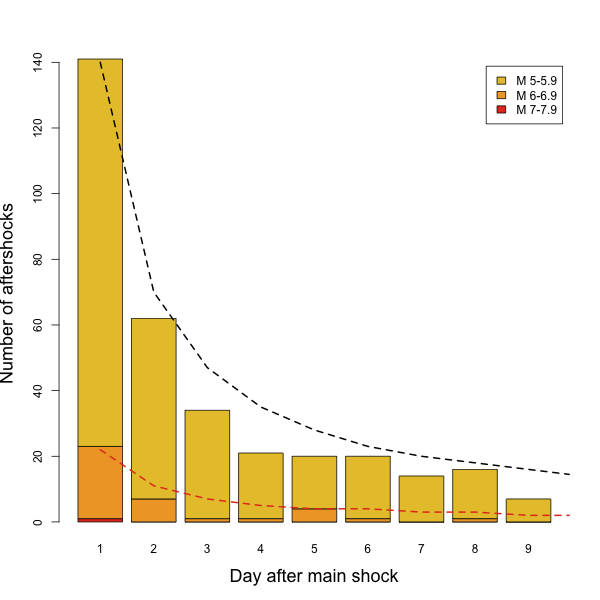
- Below are updates of the earthquake plots that I produced for my original post, and my discussion of the aftershocks. So far there have been 336 earthquakes of greater than magnitude 5 following the main shock.
- The number of aftershocks continues to decline approximately according to the inverse of the time since the earthquake, as expected.
- Jascha Polet has also produced some really nice visualisations showing the distribution of the aftershocks in space and time. Contrary to some reports, the aftershocks are not currently showing any migratory trend, seemingly being randomly distributed along the length of the rupture.
- For an animation of the earthquake sequence, Paul Nicholl’s Japan Quake Map is the place to go.

Magnitude of earthquakes (M5-6=small yellow circles, M6-7 orange circles, M7+ large red circles) off the coast of Honshu, 9-20 March.

Tsunami
- For a detailed analysis of the tsunami (and links to other resources), check out Anne’s great post from Friday. However, I would like to highlight a video from the BBC that shows the tsunami hitting Miyako City (non-embeddable, unfortunately) which, more than any over video I’ve seen, demonstrates the overwhelming power of a tsunami: the water just keeps coming, sweeping everything before it. These before and after pictures from Australian ABC News are also starkly illuminating.
- Satellite pictures show that the tsunami flooded areas several kilometres inland. It seems there is evidence for earlier such events beneath the Sendai Plain. Sand layers in the subsurface include one apparently deposited by a tsunami in 869 AD.
- Across the Pacific ocean, Crescent City in northern California saw the highest tsunami waves: this speeded up video shows the water level receding and rising a number of times as the wave train reached the coast – it’s easy to underestimate the magnitude of these changes until a boat set loose by the tsunami drifts past at around the 2:50 mark (the audio is also speeded up, so you might want to turn off your speakers before playing).
- Curious about those whirlpools in the tsunami pics? Fluid dynamicist Sue Kieffer explains them and their geologic record.


Comments (7)