1. Introduction
As a scientist, one of my big challenges is to keep on top of the vast and ever-growing body of scientific knowledge about my research and teaching subjects. I’m not the only one who apparently struggles with this task, or wishes she could do more. on January 1st, 2015, Jacquelyn Gill proposed the #365papers idea, which challenged us up the ante on our reading habits. I choose to interpret the 365 part not as a mandate to read a paper every day, or 365 papers in a year, but simply to record what I’ve read over the course of a year. I tweeted each paper I read, faithfully using the #365papers hashtag, and at the end of 2015, I looked back on what I’d read and did some fairly simple analyses. However, 2015 was an exceptional year for me personally because of the birth of my son, and I wasn’t sure how my results would look in a more “normal” year. Hence, like a good scientist, I decided to collect some more data. I hypothesized that I would read and review more papers when back at work full-time, but I thought that there was some potential that my 2 courses per semester teaching load would decrease my reading during the climax of each term.
2. Methods
Based on what a pain-in-the-neck it was to compile all of the metrics that I wanted to analyze at the end of 2015, I decided to alter my methods from the previous experiment. I created a Google spreadsheet to track my reading, including date read, journal, open access, gender and nationality of first author, and more. I began the year by tweeting and storifying the papers I read, as in 2015, but I abandoned the storify mid-year and ended up being a bit haphazard with the tweeting. I only counted papers that I read fully through the results and discussion sections, so there are quite a few papers that I read large chunks of but didn’t make the list because I didn’t finish. I also counted textbook chapters, government publications, and defense-ready dissertation chapters that I read fully, as well as papers and proposals that I reviewed. I didn’t count the many many pages of student writing for class or thesis proposals or the hundreds of great articles I read from Internet publications, magazines or newspapers. I also didn’t count “popular science” or other fiction and non-fiction books I read.
3. Results and Discussion
The data from 2016 support my hypothesis that having an infant depresses my reading rate, but the effects of my teaching load are the most unexpected result of this year’s analysis. In 2016, my list contained 132 items, which is a 70% increase over the 78 items I read in 2015.
3.1 What types of things did I read?
- 95 journal articles, including 3 that I co-authored that appeared in press in 2016
- 16 grant proposals as a reviewer
- 9 manuscripts as a reviewer
- 4 academic book chapters
- 4 dissertation chapters
- 2 government publications
- 2 GSA special publications
In every category, I read more than in 2015. I read 169% of the number of journal articles I read the previous year. I more than tripled the number of manuscript reviews I did, but this gibes pretty well with my long-term rate of reviewing. In 2015, I had liberally turned down review requests while on maternity leave. Even though I reviewed more in 2016, the ratio of published articles to reviews increased from 3.3 to 3.8 articles per review. This is good, because one of the things I had worried about in 2015 was that my reviewer service (particularly for proposals) was taking away from keeping up with the published literature.
3.2 When did i read?
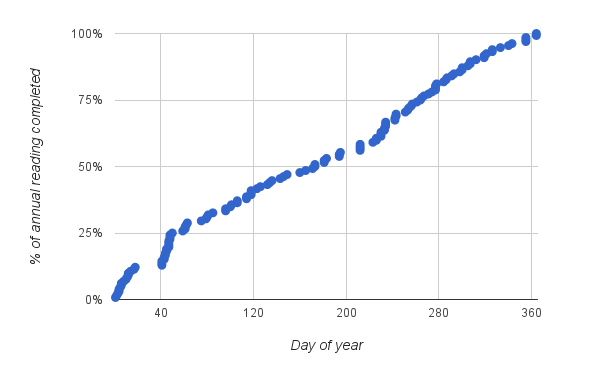
Figure 1. Cumulative distribution function of my reading in 2016. Spring semester ended around day 135, and fall semester began around day 240. (This graph may be the nerdiest thing I have ever done. I am so proud of myself.)
I passed my 50% mark on June 21st, so I read at a ever so slightly greater rate in the first half of the year than the second. But my biggest reading gap also occurred early in the year, after which I made up for it in a hurry. I honestly can’t quite remember what was going on there.
I had hypothesized that teaching would depress my reading rate, but in fact the opposite phenomenon is observed, as my least literary months were during the summer. I think part of the explanation is that I was teaching a graduate level class each semester, and in these classes I like to focus a lot on getting the students engaged with the primary literature. The end result of that is that I read a lot too. More on that effect in a bit.
Comparison of 2016 to 2015 is provocative. As in 2015, I traveled a lot in June, so that was a good reason for my reading rate to be low. In 2015, I’d suggested that my reading rate went down in the summer because of a more mobile baby, but it appears to be a broader pattern. Maybe something about working for 3 months for free was a disincentive to doubling-down on the reading?
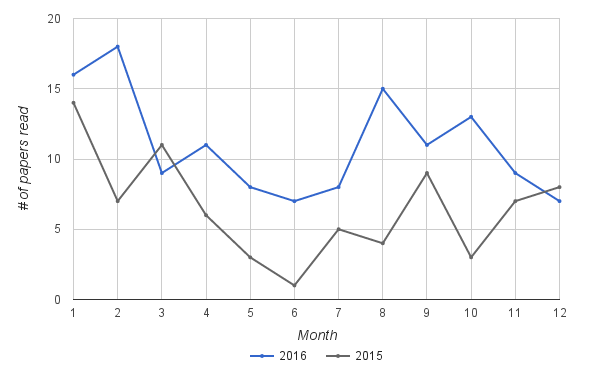
Figure 2. In order to compare 2016 data to 2015, I aggregated my reading into monthly bins.
3.3 Why did I read what I did?
New for 2016, I kept track of why I read each paper. Things tagged “general” are those that I read to keep up with a field, while things tagged “research” were those I read in pursuit of a particular paper or proposal. (Or at least that was the intent, I’m not 100% sure I remembered that distinction each and every time.)
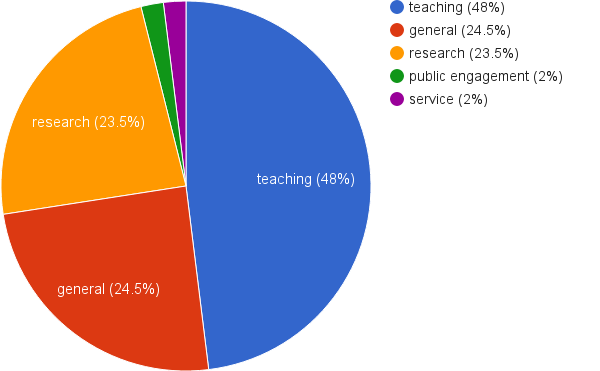
Figure 3. The primary reason I read each paper in 2016. Yes, I know pie graphs are bad, but I like how colorful it is.
I’m really surprised by what a big chunk of my reading budget was occupied by papers read for teaching in 2016. I knew this fall that the only way I was reliably getting reading done was for class, but I didn’t expect it to be nearly half of my total reading this year.
This may go a long way to explaining why my reading rates were higher during the academic year when I was teaching than not. Maybe I’m actually a slacker about reading for research? But it is also important to note that this excludes all forms of reviews and dissertation chapters, which were 22% of my total reading load this year. So maybe I just need a different pie graph next year that factors those reviews and chapters in.
3.4 Who wrote the things I read?
I read 31 articles with women first authors in 2016, and 71 articles with men first authors. (This count excludes the reviews, dissertation chapters and an unsigned editorial.) That gives me a rate of 30%, which is almost identical to what I reported in 2015. As I said then, this rate “is actually better than the 20% of US earth science faculty positions filled by women, though lower than the 40+% of geoscience PhDs awarded to women.” Of the 102 items where I can reveal authorship, 93 unique author names appeared, so I didn’t tend to read the oeuvre of any particular scientist this year. (Or if I did, that scientist doesn’t always publish as first author.) My rate of unique first authors was similar for women and men.
I also analyzed the country of affiliation for the first authors I read, and the results surprised me. 79% of the articles I read had a US first author, and the only other countries from which I read more than a couple of first-authored papers were Canada, the UK, and Australia. In some ways, I can see, given my area of research, why there would be a US bias in my reading habits, as I need to particularly pay attention to things that inform my understanding of my field research areas, but I didn’t expect the bias to be that substantial. I might make more of a concerted effort this next year to read papers coming out of Europe and non-Western countries, because there’s a lot to be learned outside of the US bubble. (I didn’t record nationality in 2015.)
3.5 How did I get access to the things I read?
18% of the published articles I read were open access (available through the publisher website). That’s lower than what I reported at the end of 2015, but I also discussed how holding a baby and reading on an iPad made me favor open access articles that year. In general, I think open access publishing is clearly the dominant direction that scientific publishing is moving over the next decade, so I’d be surprised if 18% weren’t a decadal minimum for me. I suspect that the number of articles I read in one particular paywalled journal is what is depressing my rate for 2016.
While officially open access articles are still very much a minority of my reading diet, 45% of the articles I read were freely available on the web in some form, either via the publisher, or on an author website, ResearchGate, or “in the wild” via someone’s existing upload (not counting SciHub), often as part of a course webpage. Of those routes to access, those “in the wild” uploads were the ones I most commonly found, though my sense is that ResearchGate is becoming a major player in the sharing of scientific papers.
I’m also happy that one of the three papers I coauthored this year is available from the open access journal that published it. Want to know what homeowners thought about a project to install rain gardens and bioretention cells into their neighborhood? You can read about what we found in Cities and the Environment with no paywall to stand in your way. I’d like to move to a far higher percentage of open access publishing over the next few years.
3.6 When were the papers written?
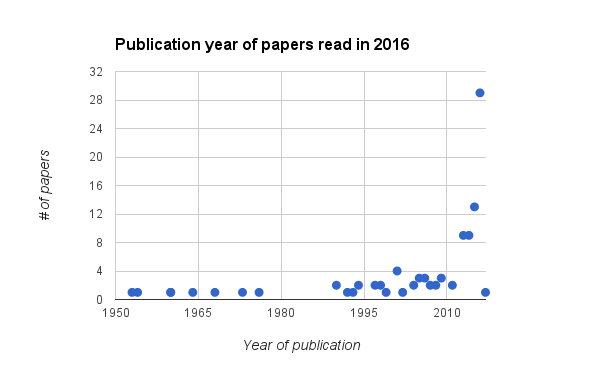
Figure 4. Date of publication of papers read in 2016. Note that the very last paper I read in 2016 had a 2017 publication date to it. The oldest paper I read was published in 1953.
The results for 2016 are pretty consistent with 2015, and as I said at the time, they are about what I expect to see for someone “keeping up with the field.” I read the most papers that were published in 2016, and the half life of my reading habits is 2 years (so 50% of the publications I read were published in 2014 or thereafter). That’s the same median publication date I reported for 2015, but, interestingly the weighted average of my reading actually moved backwards in time. In 2016, the weighted average publication date was 2006, which is 4 years older than it was in 2015. This is a function of the heavier tale on my distribution as I revisited classic papers for teaching purposes.
3.7 What were the top 5 journals I read?
- Science (19 articles)
- Geomorphology (7 articles)
- Nature (6 articles)
- Water Resources Research (5 articles)
- (tie) Freshwater Science and GSA Bulletin (4 articles)
As the year progressed, I had the sneaking suspicion that I was reading a lot more Science than usual, but the results blow me away. (Science didn’t even make my top 5 list in 2015.) There are a few factors at work here. First, I joined AAAS, so I could go straight from the e-Table of Contents to a digital version of the journal without the hassle of logging in through my university. Thus, there was a lower barrier to reading articles than in the past. Second, I worked on a proposal focused on science education and discovered that Science has published some pretty heavy hitting articles in that field. Third, since I was teaching Fluvial Geomorphology fall semester and we were reading and discussing multiple articles every week, I was revisiting some heavy hitting papers that had been published in the journal over the last few decades. The elevation of Geomorphology and Nature in the standings this year also is an effect of teaching Fluvial Geomorphology I think. Freshwater Science got a boost from a really nice special issue focused on urban ecosystems early in 2016. Water Resources Research is the only hold-over from 2015 to 2016 on my list. I can’t wait to see what 2017 brings.
3.8 How many journals did I read from in 2016?
49.
Boom.
49. If you were giving me the side-eye for reading only 5 articles from Water Resources Research last year (and fewer than that from other major hydrology journals), please pause and reflect that the number of journals that I read from is more than 50% of the number of papers I read. Working on urban aquatic systems and fluvial geomorphology forces me to read broadly, because I am staying abreast of new knowledge hydrology, engineering, ecology, planning, geography and more. Also, this total doesn’t count the manuscript reviews I did, which were for journals much more in line with my hydrological and geomorphological expertise.
3.9 Where did I find all those articles?
New for 2016, I also kept track of where the articles I read first attracted my gaze. 19% of them were tagged “already known”, which are mostly things I was revisiting for teaching purposes and sometimes for research. 17% came to my attention via e-tables of contents, and 9% were identified as part of my backlog from 2015 and prior. In terms of search, my most common search tool was Google Scholar, generating 17% of my reads, and I really didn’t read much I found on Web of Science or other search tools. My preference for Google Scholar has a lot to do with how easy it is to use without having to log in through our library website, even though I really like some of the snazzy tools that Web of Science provides. Other ways I found papers included Twitter (4), colleagues, students, author websites, other people’s syllabi (teaching papers!), and conference talks. And of course a reviewer suggested a paper that my previous reading had missed. Thanks, reviewer!
3.10 What did I read about?
Every article I read I tagged with a primary topic and an optional secondary topic. The topics were chosen from a semi-controlled vocabulary (i.e., I tried to be consistent but wasn’t always). Once again, the data show the clear influence of my Fluvial Geomorphology teaching on my reading in 2016, with a probable secondary effect of my Urban Hydrology teaching, although that’s more difficult to disentangle from my research reading.
Based on primary topic alone, I read:
- geomorphology (45)
- urban hydrology (30)
- science education (7)
- hydrology (other than urban) (6)
- diversity/women in science (5)
- climate science and climate change (3)
- public engagement and science communication (3)
- water quality (2)
- geology/tectonics (1)
- social science (1)
If you add in the secondary topics (where only about half of papers had were tagged as having one), climate science and climate change jumps into the 3rd position, which makes a lot of sense as I’d be inclined to read articles that talked about the effects of climate on urban aquatic systems and geomorphic processes. Water quality jumps up to tied with science education, and ecology enters the rankings at that same spot as well. Here again, I think we’re seeing a synergy of hydrology and geomorphology and their interactions with other fields of research. In addition to ecology, a few other topics showed up only as a secondary topic. These included policy, land use, archaeology, modeling, and human impacts, and all of these are certainly cognate topics to my research.
4. Conclusions
The most surprising conclusion of this year’s study was the dramatic effect of teaching on my reading. I am teaching much less in 2017 than I did in 2016 (and I don’t expect an infant to be the reason), so I am profoundly curious what my reading rates, reasons, and patterns will look like over the next year. If I ever finish this blog post, I’ve already got two papers queued up to read (thanks, Twitter!).
I’d like to do a better job in the next year of paying attention to multiple dimensions of diversity in my reading, at least in a qualitative sense. I don’t know what percent of women first-authored papers exist in the geosciences, though a cross-disciplinary analysis found 0.42 papers by women authors for every 1 paper by men for US-based authors, suggesting my 30% is pretty much what you’d expect. There’s also some fascinating work on gender bias in the publication process at AGU journals, in terms of submission, acceptance, and reviewing, that was presented at GSA in 2016 and should be out in article form this year. But gender is the easy diversity axis to pick at, along with nationality of author affiliation (which I noted above that I’m not doing well at), and there are also issues of race, ethnicity, sexuality, affiliation type, professional rank and more that may be subtly affecting what I and others read. Collecting data on these intersecting axes is difficult, and I try to read the science I do because of the subject matter not the author, but I need to be aware of how subconscious bias may be leading me to favor some papers over others.
Finally, a much less surprising conclusion is that given a data set, even of dubious scientific value, the scientific mind will not be able to resist the temptation to dive in, analyze the heck out of it, and then share the results with the world. While my data over 2 or 3 or 10 years will never rise above the level of anecdata, imagine if many scientists started carefully tracking their reading habits. What a valuable dataset that would be, adding an incredible richness to our understanding of how scientific knowledge propagates. If you saw the #365papers hashtag pop up on Twitter or elsewhere on January 1 and thought that you couldn’t possibly reach that goal, so why try, I encourage you to take a different tack and use the concept as a vehicle for reflection through an academic version of life-logging. Or maybe we could even call it research.
5. Acknowledgements
Thanks as ever to Jacquelyn Gill for getting this whole thing started and for being a role model for an engaged academic in so many ways. Thanks to Meghan Duffy and Josh Drew for nerding out about your own stats, and much gratitude to all the #365papers participants in 2015-2017 for solidarity, tweeting your reading to keep me inspired, and for important conversations about work life balance. Finally, a special debt of gratitude to my family for putting up with me and all my nerdery.


Nice plan for content warnings on Mastodon and the Fediverse. Now you need a Mastodon/Fediverse button on this blog.