![]() The past few weeks have brought two tropical cyclones* to the eastern seaboard of the United States. They serve nicely to illustrate the topographic controls on flood generation that we were been talking about in my Fluvial Processes class recently.
The past few weeks have brought two tropical cyclones* to the eastern seaboard of the United States. They serve nicely to illustrate the topographic controls on flood generation that we were been talking about in my Fluvial Processes class recently.
Irene
From 26-29 August, Hurricane Irene cruised right along the east coast from North Carolina’s Outer Banks to New York City. As it continued northward, its center moved inland, running up through Vermont and into Canada. The highest rainfall recorded during the storm was at Bayboro, North Carolina, where rainfall totals equaled 40 cm (15.74″). That huge amount of rain caused some flooding in the flat and low Coastal Plain, though media attention focused on multiple new inlets carved through the road linking Hatteras Island to the mainland.
![CropperCapture[2] Pedestrian bridge with bank failure (photo by Sarah Lewis and used with permission)](https://all-geo.org/highlyallochthonous/wp-content/uploads/2011/09/CropperCapture2.jpg)
Destruction from Irene, near Randolph, Vermont. Note that debris hung up on the bridge railings, indicating how high the waters were. Also, the bridge has been severed from the right bank by erosion outside the bridge abutment. (photo by Sarah Lewis and used with permission)
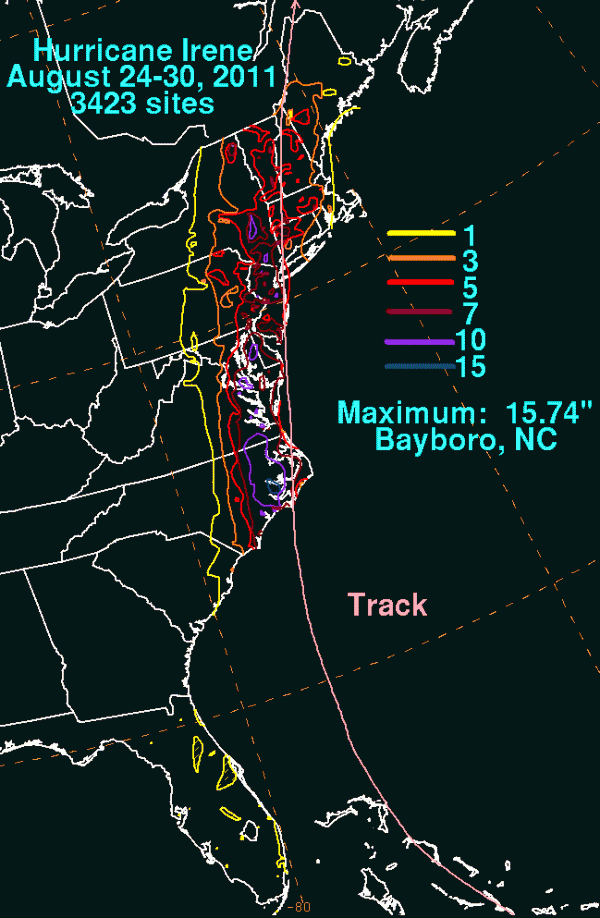
Farther north, Irene caused heart-wrenching disaster in the upstate New York and Vermont. As rain from Irene dumped onto the steeper hillsides of the Catskills and Green Mountains, small streams turned into torrents, washing away roads, bridges, and buildings. The flooding in Vermont is likely to be its worst disaster since another late-season tropical storm flooded the state – in 1927. But, as the map below shows, Irene dumped only 12 to 18 cm (5-7 inches) of precipitation on Vermont, which is less than half the amount that drenched North Carolina.

Precipitation totals from Hurricane Irene, compiled by the National Weather Service Hydrometeorological Prediction Service
There are couple of key differences between the two locations that explain why Vermont suffered more dramatic flooding than North Carolina.
First, eastern North Carolina was in a pretty bad drought prior to Irene, so there was plenty of unsaturated soil for the water to infiltrate into. In contrast, the first 7 months of 2011 in Vermont were the 6th wettest on record, with precipitation 131% of average. Soils were already very wet and had little capacity to store or detain precipitation produced by Irene.
Second, eastern North Carolina is FLAT, while Vermont is rather more steep. When the intense rains hit the land surface in Vermont, gravity acted to pull the water downslope into streams (and then down the streams) much more efficiently than in North Carolina. Given the same amount of rain over the same area and soils, a steeper landscape is going to produce a larger flood than a flatter landscape. Peak flows were higher in Vermont, and the water had greater stream power to move sediment and wash away roads, culverts, and bridges.
![CropperCapture[4] (photo by Sarah Lewis and used with permission) Train tracks suspended in midair](https://all-geo.org/highlyallochthonous/wp-content/uploads/2011/09/CropperCapture4.jpg)
Train tracks hang in mid-air where a culvert blew out from under them, during flooding generated by Irene. Photo near Randolph, Vermont. (photo by Sarah Lewis and used with permission)
Lee
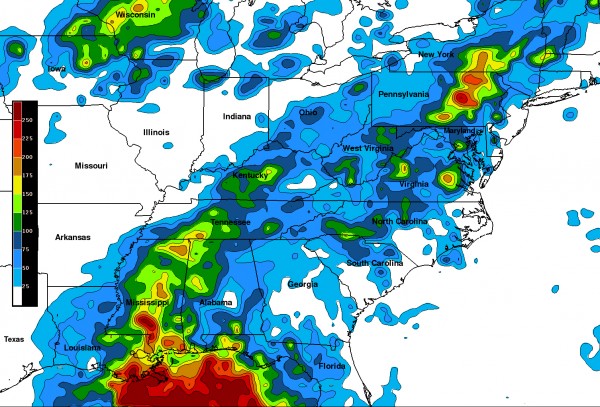
Tropical storm Lee made landfall in Louisiana on September 4th, and almost immediately weakened into a tropical depression and then a post-tropical low. But those classifications are based on wind speed, and not water content. In the last week, as Lee has moved northward across the Gulf Coast states and then up and across the Appalachians, it has dumped a huge volume of water across at least 10 states. In this storm, the precipitation bulls-eyes center on Louisiana and Mississippi (where Lee first made landfall) and the Susquehanna River watershed in New York and Pennsylvania. In those areas precipitation totals exceeded 38 cm (15 in).

NASA satellite TRMM data showing rainfall totals for 31 August to 8 September (via Dave Petley of the The Landslide Blog)
Lee did generate flooding in Mississippi and Louisiana, and caused four deaths. On the Pearl River at Jackson, Mississippi, where the USGS reported more than 8 inches of precipitation on 4-5 September, the flooding was above flood stage but only on the order of floods seen, on average, once every 2 years.
Along the Susquehanna River, over 100,000 people were ordered to evacuate low-lying neighborhoods in cities like Binghampton (NY), Wilkes-Barre (PA), Harrisburg (PA), and Havre de Grace (MD) as the river was predicted to crest at the second-story level of houses in some neighborhoods. While the flooding appears to have been less bad than predicted in some places, the Susquehanna at Wilkes-Barre set a new record – 6.3 m (20.6 ft) above flood stage. The previous record had been set by Hurricane Agnes in 1972. Wet soils from the rainfall dumped by Irene probably exacerbated the flooding in Pennsylvania.
While both the Gulf Coast and Susquehanna River watershed experienced human-affecting flooding from Lee, a quick comparison of the peak discharge per unit area reveals how much more impressive the flooding on the Susquehanna is from a hydrologic perspective. The Pearl River at Jackson (MS) crested at 929 cubic meters per second, from a drainage area of 8213 square kilometers. The Susquehanna River at Wilkes-Barre (PA) crested above 9799 cubic meters per second, and the discharge estimates at the very highest water levels haven’t been reported yet. At Wilkes-Barre, the Susquehanna has a drainage area of 25,796 square kilometers. Dividing peak discharge by watershed area, we get a peak unit discharge for the Pearl River of 0.11 m3 s-1 km-2. On the Susquehanna, the value is more than 3 times higher – 0.38 m3 s-1 km-2.
General Principle
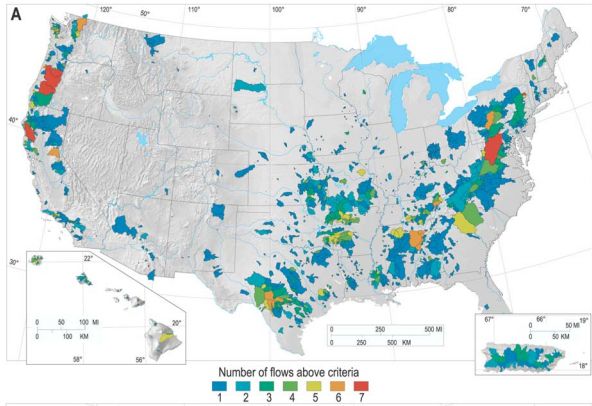
In a paper using USGS annual peak streamflow records to look at the geography of big floods in the United States, O’Connor and Costa (2004) describe the phenomenon of tropical storms + topography being the vital constituents of really big floods in the eastern US. They wrote:
“The importance of orographic effects and topographic concentration of streamflow for generating high unit discharges along the Atlantic coast is illustrated by the rarity of high unit discharges in Florida and along the Coastal Plain of the southern and eastern tier States. Despite being closest to the moisture sources and subject to frequent landings of major hurricanes and intense rainfall [Konrad, 2001], these comparatively flat and permeable areas do not produce large unit discharges.”

Watersheds with the top ~1% of annual peakflows in 100 years of USGS stream gaging records. (Figure 4a from O'Connor and Costa, 2004, Spatial distribution of the largest rainfall-runoff floods from basins between 2.6 and 26,000 km 2 in the United States and Puerto Rico, Water Resources Research, 40: W01107, doi:10.1029/2003WR002247) (paper not subject to copyright)
While none of the flooding generated by Irene and Lee may break into the ranks of the top 1% of floods shown on the figure above, they conform to the expectation that bigger peak flows occur where there is steep topography rather than where the land is flat. They are also a sobering reminder that the news story is far from over when a tropical storm moves inland from the beach. Inland flooding, like we have been witnessing, is responsible for more than half of the fatalities from tropical storms in the US. I’d be a bit morbidly curious to see a map of those fatalities and see whether they occur along the coasts or up in the hills. Whatever the statistics, this hurricane season has been an impressive reminder that those of us far from the beach need to pay attention to tropical storm forecasts and be prepared for intense rain and flooding.
*Tropical cyclone is the general term for tropical storms and hurricanes. In other oceans, hurricanes are also called typhoons and cyclones. Tropical cyclone encompasses them all.


Links (1)-
Pingback: How I use “new media” « Watershed Hydrogeology Blog