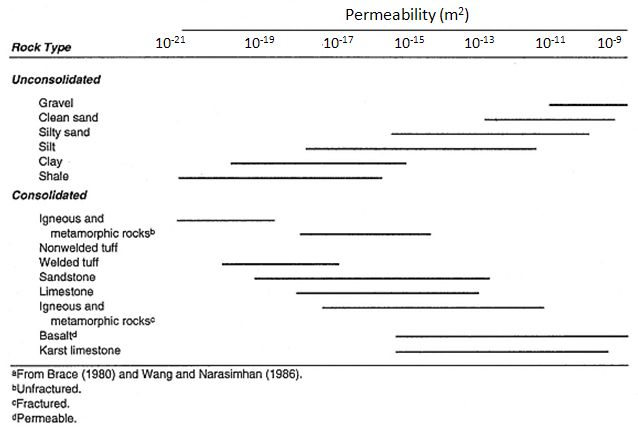
Permeability (the ease with which a fluid moves through a material) is the ultimate goal of many hydrogeologic investigations, because without that information it is impossible to quantify subsurface water and heat flow rates or understand contaminant transport. Yet permeability is notoriously difficult to quantify, both at the local-scale and the landscape-scale. Permeability varies over 13 orders of magnitude across rock and sediment types, because of differences in pore sizes, geometry, and connectedness. Loose gravel could have permeability as high as 10-7 m2, but unfractured igenous and metamorphic rocks could be as low as 10-20 m2. The diagram below is an example of the sort of relationship between rock type and permeability shown near the beginning of every major hydrogeology textbook.

Typical ranges of permeability for different rock types, usually based on hydraulic measurements made at wells.
Most of the time, hydrogeologists are happy to just to get permeability to within an order of magnitude or two. Knowing permeability is not just useful for those interested in in water supply problems and transport of contaminants. For scientists who model watersheds or land-atmosphere interactions in climate models, being able to easily estimate landscape-scale permeability would be incredibly helpful.
In a new paper in Geophysical Research Letters, scientists from Canada, Germany, the Netherlands, and the US have just done a big favor for those scientists. Gleeson et al. (2010) compiled the first regional-scale maps of permeability for the North American continent and the terrestrial globe. They are interested in permeability in the uppermost 100 m of the subsurface, but below the water table, where all pore spaces are saturated with water. They defined regional-scale as greater than 5 km, because they wanted to avoid influences by things like individual fractures. Using previously published hydrogeologic models, in which permeability was calibrated against groundwater flow, tracers, or heat fluxes, Gleeson and colleagues identified permeability values for 230 hydrogeologic units, grouping them into seven “hydrolithologic” categories, by rock type.
The scientists compared the permeability values from the models to the expected permeabilities for each rock type based on smaller-scale measurements (like those used to make the graph above), and they found reasonably good correspondence. They also examined whether permeability values within each hydrolithologic category were correlated with the scale of the model used to generate them. They found that permeability was scale-independent above 5 km, except in carbonates, where large karst features may result in changing permeability with increasing area.
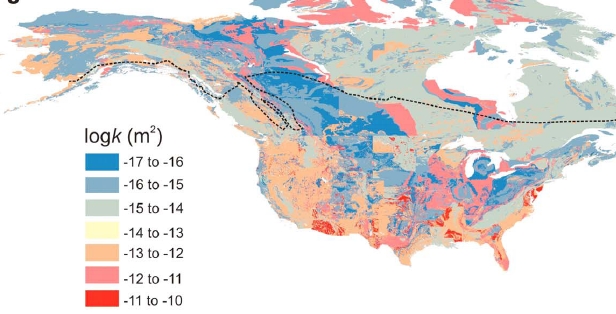
Using pre-existing geologic maps for North America and the world, Gleeson and colleagues divided the Earth into their hydrolithologic categories. For each category, they calculated the geometric mean of the modeled permeability values, and applied that mean permeability to all of the map units in that category. The resultant maps show the distribution of permeability across the land surface.

Portion of Figure 3c from Gleeson et al. (2010, Geophysical Research Letters) showing the permeability distribution across North America. North of the dashed line is continuous permafrost and in that region, the map likely significantly over-estimates permeability.
The global map uses a single geology dataset, so there are no weird boundaries in the data, but it is of coarse resolution. The North American map (shown above) is at much finer resolution (75 km2 mean polygon area, with 262,111 polygons), but it has a few odd edges that correspond to state and national borders. The authors point to these boundary problems in their discussion of caveats, along with the problems associated with permafrost, deep unsaturated zones in arid areas, and deep weathering in the tropics. In addition, the use of a single permeability value for each category will necessarily lump together some terrains with similar rock types but differing geologic histories and resultant permeabilities (e.g., the High and Western Cascades in Oregon).
The work of Gleeson and colleagues represents an important first step in translating regional-scale geologic data into permeability fields. These maps will be useful for continental-scale and larger earth system models and for data sparse regions. Their methodology also raises some interesting possibilities for subdividing the hydrolithologic categories in areas where there are more hydrogeologic model data available, but where there hasn’t been comprehensive hydrogeologic modeling. Finally, their finding that regional-scale model values are in accord with the ranges reported in every hydrogeology textbook is a significant confirmation of the fall-back position of many students of hydrogeology: “If you have no data from wells in your field area, use a textbook to estimate permeability from the rock type.”
Gleeson, T., Smith, L., Moosdorf, N., Hartmann, J., Dürr, H., Manning, A., van Beek, L., & Jellinek, A. (2011). Mapping permeability over the surface of the Earth Geophysical Research Letters, 38 (2) DOI: 10.1029/2010GL045565


Comments (4)
Links (1)-
Pingback: Geology is destiny: globally mapping permeability by rock type « Watershed Hydrogeology Blog