![]()
![]() The Yellowstone caldera is located over a ‘hotspot’, where volcanism – and in the case of Yellowstone, hydrothermal activity – is occurring far away from the plate boundaries where such things are normally found.
The Yellowstone caldera is located over a ‘hotspot’, where volcanism – and in the case of Yellowstone, hydrothermal activity – is occurring far away from the plate boundaries where such things are normally found.
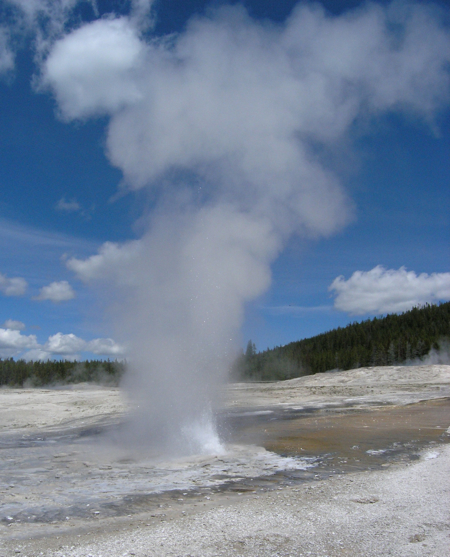
Plume above....plume below? Plume geyser in Yellowstone's Upper Geyser Basin. Photo: Chris Rowan 2010.
Hotspots are often linked to mantle plumes: if this is the case, the anomalous volcanism is the result of hot, buoyant rock from deep in the Earth rising up through the mantle to the base of the crust, and melting as it enters regions of (relatively) low pressure. As you may or may not be aware, there is a vigorous and long-running debate over whether this link is justified in all cases, with some arguing that mantle plumes may not exist at all (those interested in the gory details should check out mantleplumes.org). In the case of the Yellowstone hotspot, the linear hotspot track marked out by the chain of calderas along the Snake River Plain suggests that the hotspot remains stationary with respect to the North American plate moving over it, as you would expect if it was coming from deeper in the mantle. The oldest caldera on the track was active 16-17 million years ago, and is located in the same region as the Columbia River flood basalts, which also first started erupting about 17 million years ago; several other hotspots are also associated with flood basalts in this way, and they are interpreted as recording the moment when the voluminous head of an upwelling plume first reaches the base of the crust, triggering a large amount of melting and sending huge volumes of magma to the surface. It is possible that the Yellowstone hotspot is similarly connected to the Columbia River Basalts.
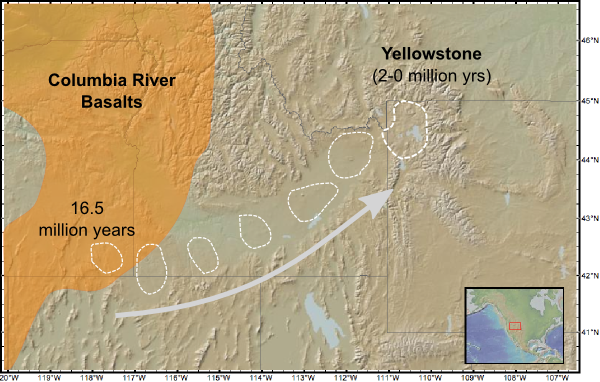
Geographical association between the earliest part of the Yellowstone hotspot path, and the Columbia River Basalts.
These features are suggestive of a possible plume origin for the Yellowstone hotspot but are far from definitive. In the latest attempt to settle the question, Obrebski et al. exploit the fact that there are more seismometers deployed across North America than ever before to produce the most detailed picture yet of the structure of the mantle beneath western North America. This picture is constructed using seismic tomography: an analysis of how the time that seismic waves from distant earthquakes arrive at a detector is changed by local variations in the temperature or composition of the material it is passing through. For example, if there is a region of hotter than normal material beneath a particular seismometer, the earthquake waves will travel more slowly and be detected later than expected; if it is colder than normal, the waves will move faster and arrive earlier than expected. By combining the signals from a large number of earthquakes, all of which take different routes through the mantle, and the records from a distributed grid of seismometers, you can produce a three dimensional picture of the structure of the mantle.
Obrebski et al.‘s latest model clearly images the ‘hot’ part of the hotspot, in the shape of a large, low velocity zone directly beneath the Yellowstone caldera. What is more, you can follow the low velocity zone downwards into the mantle, along a somewhat corkscrew path: it first descends to the northwest, before abruptly reversing its direction and descending to the southeast, and then changing direction again at about 800 km depth. This trail extends right to the base of the area modelled, 1200 km beneath the surface, almost half way to the core-mantle boundary, and much further than any potential plume has been traced beneath Yellowstone before.
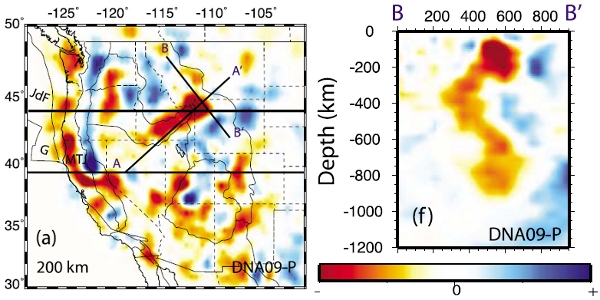
Horizontal slice through the tomographic model at 200 km depth (left); the low velocity zone beneath the Yellowstone caldera follows a corkscrew path into the lower mantle (right). Source: Obrebski et al. (2010), Fig. 2.
But perhaps the most exciting thing about these new images is not what is there, but what isn’t. There has been a plate subducting eastwards beneath the Pacific Northwest since at least the Cretaceous period, and we would expect the tomographic model to pick up the cold subducted slab as a region of faster than average seismic velocities dipping to the east, and extending some way into the mantle. At shallow depths, the slab is easy to spot: in the horizontal slice through the model above, it is the the blue linear feature just inbound from the west coast. But as we look deeper in the mantle, we see something unexpected. A cross-section running E-W beneath Oregon (the top image in the figure below) reveals that there is no fast anomaly below about 300 km depth, even though there should be a slab there based on our understanding of the tectonic history of the subduction zone. A similarly oriented cross-section further to the south shows the slab extends much deeper beneath California and Nevada, to depths of at least 600 km. Curiously, however, further to the east there is another eastward dipping zone of fast (and presumably, cold) mantle, which looks a bit like a subducting slab but appears to be disconnected from any surface tectonics.
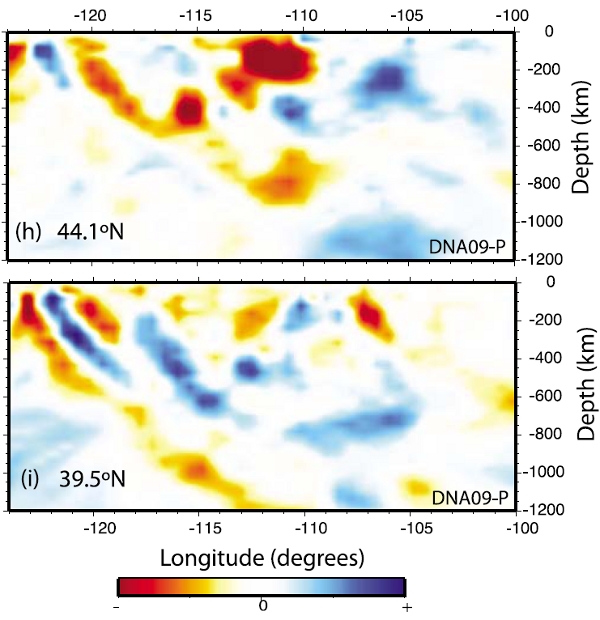
Vertical E-W cross sections showing the velocity structure of the mantle beneath (top) Oregon and (bottom) California and Nevada. Source: Obrebski et al. (2010)
Obrebski et al. argue that if the Yellowstone hotspot is indeed fed by a plume from the deep mantle, as these results seem to indicate, when it first ascended towards the surface it would have intersected with the subducting slab, and what we are seeing in the tomography is the aftermath of that interaction. Effectively, the upwelling plume burnt through the subducted plate beneath Oregon on its way to the surface, heating it up enough that it lost its rigidity and was assimilated into the asthenosphere, leaving isolated fragments further down dip that were no longer connected to the plate at the surface. Tectonic changes at the Cascadia subduction boundary around 19 million years ago, notably a large reduction in the rate of plate convergence, could be linked to this splintering of the subducted plate, and the reduction in slab pull that would have resulted. After overcoming this barrier to its upward passage, the plume head then reached the surface 2 million years later, causing the eruption of the Columbia River Basalts.
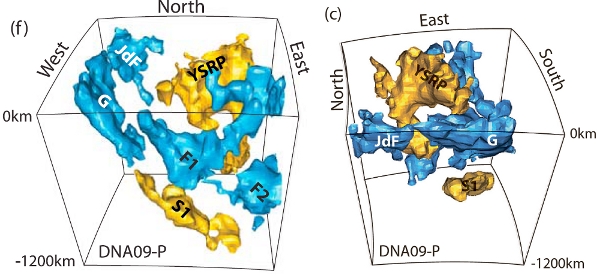
3-D plot showing the interaction between the subducting slab (blue) and the upwelling Yellowstone plume (yellow). Source: Obrebski et al. (2010)
This is all extremely cool in its own right, but I also find this quite interesting in the context of the whole mantle plume debate. This is hardly the first time that seismic tomography has been used to attempt to image mantle plumes beneath hotspots, and although they do occasionally seem to image conduits of hot material coming up from deep in the mantle, the dimensions of these features generally push at the limits of what is resolvable with tomography, raising the possibility that they could simply be artefacts of processing. But in this case, the tomography has also revealed that at some point in the past, material rising from the deep mantle completely disrupted the subduction system beneath the Pacific Northwest, and the debris of this past interaction is clearly associated with the current velocity anomaly beneath Yellowstone. This gives us more confidence that the ‘plume’ being imaged in this study is actually real.
Obrebski, M., Allen, R., Xue, M., & Hung, S. (2010). Slab-plume interaction beneath the Pacific Northwest Geophysical Research Letters, 37 (14) DOI: 10.1029/2010GL043489


Comments (11)
Links (6)-
-
-
-
-
-
Pingback: Geology Links for August 31st, 2010 | The Geology News Blog
Pingback: Open Laboratory 2010 – only eight days till the deadline! | A Blog Around The Clock
Pingback: Only three days to go – Open Laboratory final stretch for submissions! | A Blog Around The Clock
Pingback: It’s getting hot – submissions for Open Laboratory 2011 are flying in by the dozens per hour… how about you? | A Blog Around The Clock
Pingback: Open Laboratory 2010 – the final stretch! | A Blog Around The Clock
Pingback: Open Laboratory 2010 – submissions now closed – see all the entries | A Blog Around The Clock