I’m currently back reading “Earth’s Deep History” by Martin Rudwick, and once again I am being annoyed by what seems to me to be a pretty fundamental misunderstanding of what is meant by “steady state” in the context of Earth history.
It’s certainly possible that in a contest between me and one of the pre-eminent historians of geology, I’m missing something, but here’s my problem: he argues that a “steady state” Earth is by definition ahistorical: it has “no real history”. I think this is incorrect.
Here’s what Rudwick says about the theory of the Earth proposed by Georges Leclerc, Comte de Buffon, who anticipated James Hutton in arguing that Earth’s past history can be explained by processes we can observe acting in the present, such as the erosion and deposition of sediment.
“He portrayed the Earth as a scene of unceasing gradual change, but change without overall direction…a ”steady state” of dynamic equilibrium. It was therefore an Earth without any real history” [p. 63]
For Hutton, he says:
“Hutton’s steady-state Earth… [with] successive “worlds” formed an endless sequence in time, but not a real history of the Earth, any more than the repeated orbits of the planets consisted of a real history of the Solar System.” [p. 72]
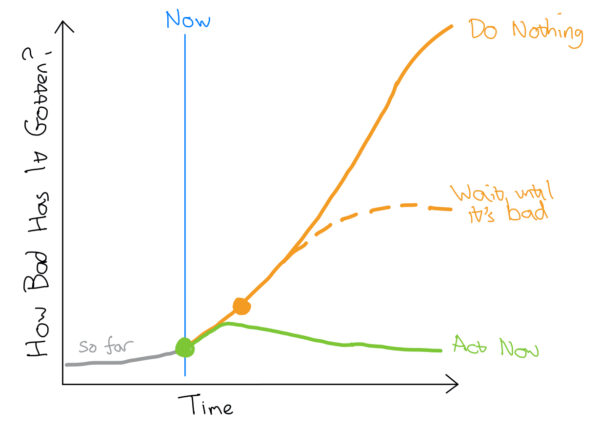
So what is meant by “dynamic equilibrium”, or “steady state”? It describes a system that is doing work – using energy, moving stuff around, forming new substances in chemical reactions – but when aggregated over the whole system, the effects of all these processes balance out. I liked to use this cartoon in my lectures to illustrate this point.

So, in Buffon and Hutton’s conception, over long stretches of time the processes that destroy and create elevated land surfaces balance out, such that the relative proportions of land and ocean on the whole Earth stay constant over time. If you were given two pictures of the Huttonian Earth from space, you would be hard-pressed to identify their sequence or temporal spacing.
But if you are embedded within that system, things do change nonetheless! The geography of the Huttonian Earth – where exactly the land and ocean is actually distributed – changes over time. So even in an eternal steady state, any particular point on the Earth does have a real and unique history. Sometimes that point is elevated and being eroded; sometimes it is submerged and accumulating eroded debris; sometimes it is being deformed and uplifted. And we can read this history – at places like Hutton’s unconformity!
Perhaps this is a little pedantic – I’m not arguing with what seems to be Rudwick’s broader contrast of early narratives of Earth history that viewed the planet as an eternal, self-regulating machine, and those where there is a clear narrative progression of states from the planet’s creation to the present day. In fact, there’s an interesting discussion to be had here about how it’s impossible to reconcile these two narratives when your systems metaphors are relatively simple machines like a steam engine. A much deeper understanding of complex systems needed to be developed before we could see that the Earth can be a largely self-governing system that can, nonetheless, change over time (a more modern picture of Earth history is as a series of successive “steady states” that get periodically disrupted and reshaped by internal and external prods).
It’s also possible that there is some technical meaning of “history” here that I am missing. But rightly or wrongly, it is creating a bit of mental friction between me and this book.