All the software a geoscientist needs. For free!

[Updated 09 July 2014: Previous (2012) version for reference here.  Script updated for Ubuntu 14.04 based systems.]

All of my research for the past 5 years was done with free software. In this post I describe the free programs that I use every day, and what I use them for. I do not use them simply to conform to stereotypes about cheap Scotsmen. As you will see, I use them because they are portable and very powerful.

Free/Libre Open Source Software (FLOSS) allows you to make as many copies the programs as you need and distribute them as you please. This makes it portable. Any workflows or methods can be taken to different computers, different institutions or sent to friends in different countries without worries about expensive licences. For example, I use GRASS GIS instead of ArcMap, Python instead of Matlab, Zotero instead of Endnote. I also use some free (gratis) proprietary software such as Google Earth. While philosophically different to FLOSS software, for practical purposes the advantages are the same.

In this post, I have divided the programs into different categories: Operating system; Maps and Geographic Information Systems; Data Processing and Plotting; Writing Journal Articles; Conference Presentations; Programming Tools; Images, Graphics and Photos; Videos and Media; Computer Administration Tools and Miscellaneous.

I have also posted a short script that to automatically install most of this software onto a Linux machine, and I invite you to suggest any software that I may have missed in the comments.

Operating System

My current system runs a FLOSS operating system, GNU/Linux (shortened to Linux here). There are many websites about the advantages of switching to Linux and the high-profile organisations that have already done so. You definitely don’t need to be a geek to run it, but it can help to have one around to set it up in the first place.

My main reason to run Linux is the command line interface (CLI), which can be used to carry out tasks very quickly and precisely. It has the HUGE advantage that once you know the commands to do what you need, you can write them in a script and repeat the task 1000 times with very little extra effort. This makes it very powerful. It feels like your computer is working for you and most of my workflows now take advantage of this.

Of all the different Linux flavours, I chose Linux Mint 14 XFCE.  It is based on the popular Ubuntu distribution so it has a wide range of software available in easily-installed packages and there are lots of helpful tutorials for it online. The latest versions of Ubuntu have a tablet-style interface; I prefer the way that Mint sets things up for the desktop.  You could also try Xubuntu or Linux Mint Cinnamon  instead as both are the same under the hood. Each comes as a LiveCD, so you try them out without altering your system.

The names of the Ubuntu software packages for each program are given below so that you can install them easily from the Software Centre or via the command line. Windows and Mac versions exist for most and can be found with a quick Google search.

Maps and Geographic Information Systems

  • GRASS (grass): Fully-featured and extremely-powerful GIS package with both GUI and command line interfaces. It handles raster and vector data in all formats and is easily scriptable to automate workflows. I use it to create new GIS datasets from raw data e.g. by processing LiDAR point clouds, digitising field maps, image analysis of multispectral remote-sensing data.
  • Quantum GIS (qgis, qgis-plugin-grass): Easy-to-use GUI-based GIS package. It is ideal for making and printing maps from pre-existing datasets. It also has a nice georeferencing tool and can be used as an interface to GRASS GIS.
  • GDAL (gdal-bin): A command-line swiss-army-knife for GIS files allowing you to convert formats, change projection, join, crop and alter the resolution of raster files and much more. Includes OGR, which does the same with vector files (e.g. shape files). This is what actually does a lot of work behind-the-scenes in GRASS and QGIS.
  • Proj4 (proj-bin, proj-data): Command line tools for reprojecting data points in different map projections (cs2cs). This works behind-the-scenes of GDAL.
  • Generic Mapping Tools (gmt, gmt-coast-low, gmt-doc): These command-line tools for plotting publication-quality maps of geophysical data are very popular among oceanographers and seismologists. You won’t see an issue of Journal of Geophysical Research that doesn’t contain at least one figure made in GMT.
  • Google Earth (instructions here): A 3D globe in your computer showing everything from the submarine mountains of the Mid-Atlantic ridge to the car parked in your street. Not FLOSS.
  • GPS Babel (gpsbabel): Communicate with any handheld GPS unit, and convert formats between gpx, kml, garmin and anything else that you can think of. The Windows version has a graphical user interface.
  • GPS Prune (gpsprune): GUI-based tool for editing GPS point and track data. The best feature is the ability to geotag photos then view them in Google Earth (see video here).

Data Processing and Plotting

  • Python (python): An open source, cross-platform programming language. It is widely-used by scientists and is extremely versatile because it can be easily extended using addon modules such as these below. Some of the other advantages are described here.  Everything that I used to do in Matlab, I now do in Python, safe in the knowledge I can take the scripts with me wherever I go.  The easiest way to get Python and most of the following packages onto a Windows machine is by installing Python(x,y).
  • IPython (ipython): Excellent interactive interface for Python.  In particular, the IPython Notebook lets you write Python in your web browser, combining it with text, LaTeX, images, hyperlinks and videos.  There are great examples the people have shared on the nbviewer website.  It is going to revolutionise teaching students how to code.
  • Spyder (spyder): A development environment for Python, giving it a Matlab-like appearance and with features such as code-checking, command completion and automatic display of documentation for the current command / object.
  • Numpy and SciPy (python-numpy, python-numpy-doc, python-scipy, python-netcdf): Scientific and numerical computing modules for Python, allowing it to handle arrays of numbers, and the NetCDF data format.
  • Matplotlib (python-matplotlib, python-matplotlib-doc): Plotting modules for Python allowing you to make all kinds of publication-quality 2D and 3D figures such as these.
  • Basemap (python-mpltoolkits.basemap, python-mpltoolkits.basemap-data): Add-on for Matplotlib giving Python similar map-plotting functions to those of GMT e.g. plotting in different projections, adding coastlines or the Blue Marble image).  See some examples here.  It also contains the pyproj module which allows easy conversion between coordinate systems.  See my post for a quick intro.
  • R (r-recommended): An open source, cross-platform programming environment, with a strong emphasis on statistics.  Also very powerful for geospatial data.  [Added in 2012 after overwhelming support in comments below.  See them for useful links.]
  • SQLite (sqlite, sqlite3, sqliteman): This an open source database format. It can be accessed via the same Structured Query Language used by cutting-edge data servers, but the data are stored in a single, portable file. This allows you to perform cool queries such as getting a list of photos of samples that were collected on a Tuesday, in Scotland, and had ash in them. I am switching to storing sample data here because the data can then be accessed directly by GRASS and by Python.
  • SQLiteManager (Firefox plugin): A nice viewer that lets you edit and perform queries on SQLite databases.
  • XYScan (xyscan): Digitise points from plot images / maps.  Ideal for getting data from old papers.
  • LibreOffice Calc (libreoffice-calc): An open source spreadsheet program, and a viable substitute for Excel. LibreOffice is a slightly more independent version of Open Office. I don’t use spreadsheets that much, but it seems to do everything that I need it to.  Gnumeric (gnumeric) is a quicker, but less featured, spreadsheet program.

Writing Journal Articles

  • Zotero (Firefox plugin): Reference manager software. It runs in Firefox and lets you add articles to the database directly from the journal website or the results page of a Web of Science query. It has a plugin that lets you put references into Word or Writer documents and can export BibTex files, too. Also, it syncs with the cloud, so your reference library is constant across different computers.
  • LaTeX (texlive, texlive-latex-extra, texlive-fonts-extra, texlive-humanities + others): LaTeX is an open source typesetting program. It is used to produce beautifully laid-out pdf documents from plain text files containing the text and some simple formatting codes e.g. section{Introduction}. The best thing is that it does referencing, section numbering, figure captions and tables of contents for you automatically. If you are about to write a thesis, then learning LaTeX will be one of the best things that you ever did.  For a graphical-user-interface, try Lyx or MiKTeX.
  • LibreOffice Writer (libreoffice-writer): This is an open source word processing program. This is an ideal substitute for Microsoft Word on all platforms, as it can read and write .doc and .docx files. The most important features for me, comments and track changes, work perfectly. I need these to collaborate on work with my co-authors. It also prints straight to pdf, which is nice.

Conference Presentations

  • Scribus (scribus): I use this professional quality desktop publishing package to make conference posters. It is very easy to create good-looking layouts, align images and set font-themes, but that just scratches the surface of what it can do. The output is a pdf file that you can print anywhere.  Read my quick-start guide here.
  • Beamer (latex-beamer): Make pdf-format conference slides in LaTeX. It has all the advantages of LaTeX e.g. beautiful results, no-fussing about layout, referencing and contents all taken care of. Plus the pdf files don’t get messed up between Mac/Windows/Linux versions like Powerpoint slides can.
  • LibreOffice Impress (libreoffice-impress): This is an open source Powerpoint substitute. It is definitely the weakest of the LibreOffice family. It can read and write Powerpoint files but sometimes the fonts and layouts come out differently, and it is generally a lot less slick. It does a decent job, though, and I have written a couple of lecture courses with it.
  • PDF Toolkit (pdftk): Command line tool to join pdfs, extract individual pages, rotate pages and generally reshuffle pdfs.

Programming Tools

  • GVIM (vim-gtk): Geeky text editor.  Steep learning curve, but if you love keyboard shortcuts then give it a go.  Once you discover macros you’ll be flying.  Learn more here.  So far, I mainly use it for LaTeX, but have recently found that it can connect to iPython to become a Python IDE.
  • git (git): Distributed version control for working offline and online.
  • meld (meld): Compare and merge differences between two text files.

Images, Graphics and Photos

  • Gimp (gimp): The Gnu Image Manipulation Programme is equivalent to Adobe Photoshop or Corel Photopaint. The interface takes some getting used-to, but it is very powerful.
  • Inkscape (inkscape): Inkscape is a vector graphics package equivalent to Adobe Illustrator or Corel Draw. It’s fast, light, and a joy to use.
  • Image Magick (imagemagick): Command-line tools that allow automatic or batch processing of image files: resize, rotate, label, crop, change format etc. See my post about it here.
  • Shotwell (shotwell): Photo viewing programme a bit like iPhoto on a Mac, allowing you to view your images using tags, ratings and events. Ideal for organising field photos.
  • Hugin (hugin): Panorama / photo stitching software.  If you have to scan a map in many parts, it’s good for joining them up again.
  • Dia (dia): Software for drawing flowcharts and other structured diagrams.

Videos and Media

  • VideoLan Player (vlc): Play video files in almost any format that you can think of.
  • Openshot (openshot, openshot-doc): Simple video editing.
  • avconv (libav-tools): Command-line tool to change the size, framerate, format etc. of videos. Good for extracting the soundtrack as an mp3. Great for chopping out clips of sounds or videos.  This used to be known as ffmpeg.
  • Audacity (audacity): Edit mp3 and other sound files.
  • Sound Juicer (sound-juicer): Rip CDs to MP3 or other formats.
  • Youtube Downloader (youtube-dl): Command line tool to download youtube videos to watch offline.
  • Get iPlayer (get-iplayer): Command line tool to download BBC iPlayer programmes to watch offline (only works within the UK).

Computer Administration Tools

  • Ubuntu Restricted Extras (ubuntu-restricted-extras): By default, Ubuntu only ships with open source software. This package installs commonly-used the proprietary tools such as Flash video, Microsoft fonts and MP3 codecs.
  • Open SSH (openssh-client, openssh-server): Connect securely to your machine across the internet without the fuss of a VPN. Log in with a terminal to see how jobs are getting on, or use a secure FTP program such as WinSCP to copy files.
  • Rsync (rsync): One-way synchronisation over SSH. I use this to automatically back up my desktop to the department server. It knows which files have changed and only sends the differences, so it runs very quickly.
  • Unison (unison): Two-way synchronisation between computers over SSH. I use this to sync the files on my netbook with my desktop machine each day.
  • Dropbox (dropbox): File-syncing in the cloud, if you don’t mind the NSA reading your files.
  • EncFS (encfs, gnome-encfs-manager): Encrypt individual folders on your hard drive to keep confidential data (client data, student marks) if you lose your laptop.  Command line, but much easier with the graphical manager.
  • Baobab (baobab): Nice graphical disk usage program.  See which folders are taking up most space.
  • WINE (wine): Lets you run Windows programs on a Linux machine. Some people use it to play games or other complicated software, but it can be a bit hit-and-miss. I use to run the simple panorama-making software, Autostitch, which works perfectly.

Miscellaneous

  • Skype (skype): Free phone calls (with video) over the internet. The “Partners” repository should be enabled in the Software Centre before installation. Not FLOSS.
  • Adobe Acrobat Reader (instructions below): Evince, the pdf reader that comes as standard with Ubuntu is great for reading pdfs. But to add comments, make corrections, or fill in forms you need the Adobe version.  Not FLOSS.
  • Stellarium (stellarium): See what’s in the night sky above. Still cool despite the invention of the Google Sky Map app.
  • Hotot (hotot): Twitter client that lets you view your lists in different columns.
  • Adblock Plus (Firefox plugin): The internet is a much faster and less cluttered place without adverts.
  • Pocket (Firefox plugin): Save articles from the internet to read later, and have them synchronised with your phone.

Installation script

The following script will install most of the above software onto a freshly-installed Ubuntu 12.10 machine. First ensure that the ‘universe’, ‘multiverse’ and ‘partner’ repositories are enabled in the Software Centre.

# Maps and GIS software
sudo apt-get install grass qgis qgis-plugin-grass gdal-bin 
proj-bin proj-data gmt gmt-coast-low gmt-doc gpsbabel 
gpsprune

# Data processing
sudo apt-get install spyder python-numpy python-numpy-doc 
python-scipy python-matplotlib python-matplotlib-doc 
python-mpltoolkits.basemap python-mpltoolkits.basemap-data 
r-recommended sqlite sqlite3 sqliteman python-netcdf

# Upgrade to the latest IPython notebooks
sudo apt-get install python-pip
sudo pip install --upgrade ipython
sudo pip install pygments # needed for qt console

# Others
sudo apt-get install baobab dia dropbox scribus texlive 
texlive-latex-extra texlive-humanities texlive-fonts-extra  
texlive-lang-other latex-beamer gimp git hotot inkscape 
imagemagick libav-tools meld pdftk shotwell vlc openshot audacity 
sound-juicer youtube-dl get-iplayer ubuntu-restricted-extras 
openssh-server unison wine stellarium skype hugin vim-gtk xyscan

# Adobe Reader (uses gdebi to install dependencies)
cd /tmp
wget http://ardownload.adobe.com/pub/adobe/reader/unix/9.x/9.5.5/enu/AdbeRdr9.5.5-1_i386linux_enu.deb
sudo apt-get install gdebi
sudo gdebi AdbeRdr9.5.5-1_i386linux_enu.deb 

# EncFS manager (from external repository)
sudo add-apt-repository ppa:gencfsm/ppa
sudo apt-get update
sudo apt-get install gnome-encfs-manager

What have I missed?

These are the tools that I use in my day-to-day work as an academic geologist. I’m sure that there are plenty more for things like processing seismic data that I have missed. If you know any, please add them in the comments.

Just make sure that they don’t cost anything; don’t you know how copper wire was invented?

Categories: Uncategorized

Why people are scared of Katla

Note: 02 December 2011.
The current media interest in Katla does not stem from a recent change in activity at the volcano, but from an article published on the BBC website today.  The same thing followed a Guardian article earlier in the year.  Activity at Katla is still elevated, as it has been for six months already.  There is no new evidence today that an eruption is likely very soon.  In geological terms, imminent could mean weeks, months, or maybe years.  This post was written in early November.

Katla rumbles on.

The unrest began in the summer, when a small flood broke out from beneath the glaciers and washed away the bridge over the Múlakvísl river.  Since then, there have been a number of small earthquakes every day.  This is more activity than usual, but less than, for example, occurred at Eyjafjallajökull in the weeks before the 2010 eruption.  It is not clear where this is heading, but Iceland continues to prepare for an eruption and local towns have been running evacuation drills.

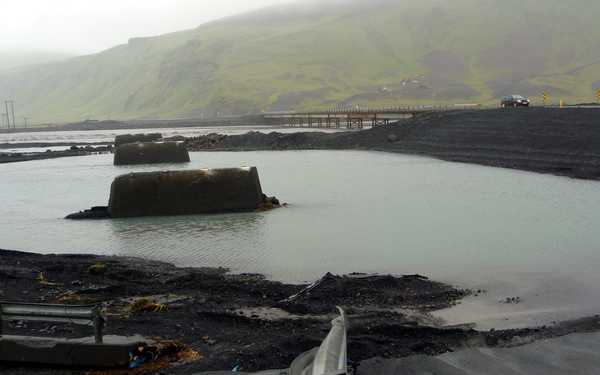
The new bridge at Múlakvísl

The remains of the bridge at Múlakvísl that was washed away in the flood of July 2011, with the replacement bridge in the background. Note the yellow earth-moving equipment high on the hillside. They aren't parked up there for the view.

While the international media focus on the potential ash cloud and ‘travel misery’, the real destruction in Iceland will be caused by meltwater floods.  Katla is covered by glaciers up to 500 m thick.  These represent a huge reservoir of water, waiting to be unlocked by the heat of an eruption.  A look at floods from the last time round, in 1918, gives an indication of what could be expected.

The jökulhlaup from the 1918 eruption

There is a word in Icelandic for such floods from beneath the ice: jökulhlaup.  Translated directly into English, it means glacier leap.  This seems appropriate, as the water bursting under, over and through the ice tears off huge chunks and carries them suddenly forward down the valley. When the water subsided after the flood of 1918, the plain was strewn with giant icebergs, up to 60-80 m high.

Eyewitnesses said the speed of the Katla 1918 jökulhlaup was “so great that a fit man could not have avoided it”.  Escaping from the eastern side of the glacier, the flood wave reached the ocean in 45 minutes.  These reports correspond to a speed of 10 metres per second (36 km per hour).  The high-water mark of the jökulhlaup is recorded on the slopes of small hills along the way that were scoured clean by the swirling torrent.  Near the glacier, the waters peaked at 25 metres deep.

Haukur Tómasson combined velocity and the depth of the flood with the shape of the channel and came up with an estimate for the peak discharge of 300,000 cubic metres per second.  The total volume of water was estimated to be around 8 cubic kilometres.  The flooded area was as much as 700 square kilometres.  There was sufficient sediment in the flow to extend the coastline by 5 kilometres.

To put these figures in context, the average discharge of the Mississippi is a relative trickle at 17,000 cubic metres per second!  The flood is equivalent to pouring out Loch Ness onto an area half the size of Greater London in less than 8 hours.

The jökulhlaup from the next eruption

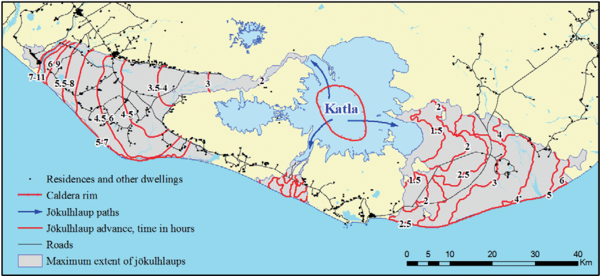
To understand the hazard from future flooding, researchers in Iceland used computer models to simulate what would happen if another Katla 1918-sized flood was to occur at the volcano.  They found that floods would reach the roads to the east of the volcano in 1-1.5 hours after the eruption began; a very short window to get people to safety.  Few people live in this region, but destruction of the road would be a major blow for the tourism-based economy of the area.

Iceland is a country about the size of Ireland.  For 9 months of the year, you cannot cross the middle as the roads are blocked by snow.  Highway 1 is the tarmac ring-road that runs around the country near the coast.  If it is destroyed, it means that you can no longer drive directly from Vík in the south, to Höfn in the south east (271 km, about 3 hours).  Instead, you have to go all the way round the other way (1068 km, about 13 hours).  A severe jökulhlaup could close the road for months.

The models showed that a flood travelling westward would sweep across the farmlands of the Landeyjar district, which is home to around 600 people, within 3-10 hours.  Homes, farms and livestock would be destroyed.  Fortunately, investigation of deposits from past jökulhlaups in the region suggest that this area is flooded rarely, perhaps only once every 500-800 years.

katla_jokulhlaup_times

Predicted times for Katla flooding from 1918-sized jökulhaup. Click to enlarge. Source: Gudmundsson, M. T., G. Larsen, Á. Höskuldsson, and Á. G. Gylfason (2008), Volcanic hazards in Iceland, Jökull, 58(58), 251-268.

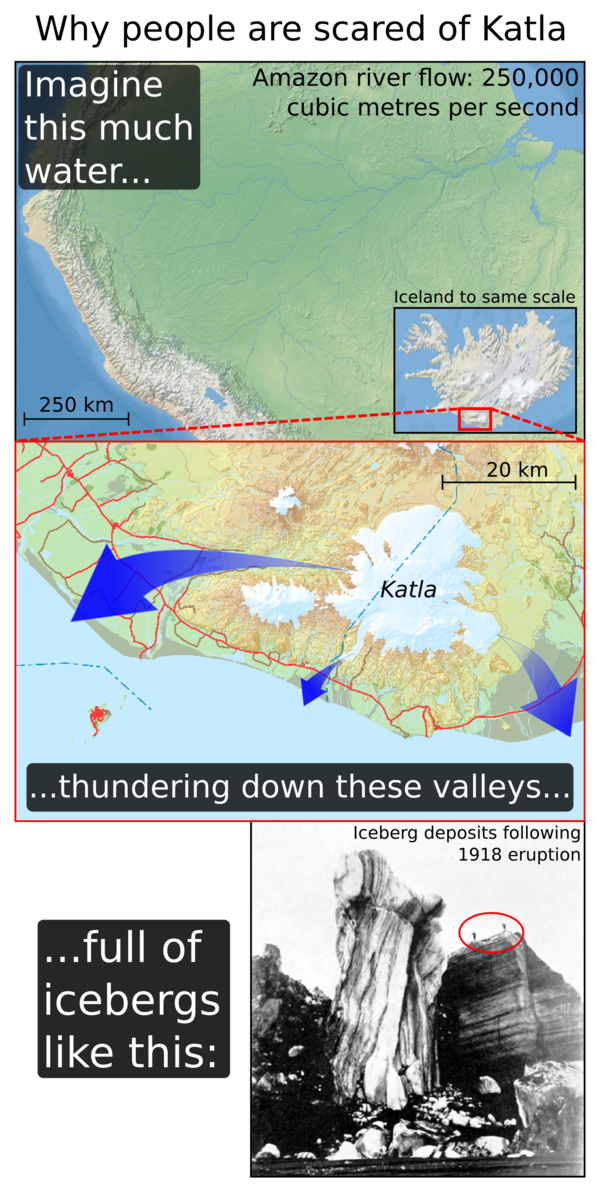
Summary in a single picture

Why people are scared of KatlaSources: Amazon map – Natural Earth data; Iceland map – atlas.lmi.is; Iceberg image – Larsen, G. (2010), 3 Katla: Tephrochronology and Eruption History.
Categories: Uncategorized

On Transatlantic Flight

Around 150 million years ago, plankton floated in warm seas.  Using energy from nuclear reactions in the Sun, they built their bodies from protein and fat and carbohydrate.  Then they died and their bodies sank to the muddy sea floor.  Over time, the mud was buried, compressed and cooked, and the plankton bodies became an oily liquid.  Much later, the liquid was pumped, refined and sold.

Now the liquid is exploding, releasing heat and gas.  The gas expands and turns a turbine.  The turbine sucks air through the engine and pushes it out into the atmosphere behind.  The atmosphere pushes back with an equal force, driving forward the engine and the wing that it is attached to.

The wing has an asymmetric shape that Deflection of air by the wing forces the air passing over it travel faster than the air that passes below.  The air below presses on the wing with more force than the faster-moving air above, lifting up both the wing and the metal tube to which it is attached.  The metal tube, and the seats inside, travel at 900 kilometres per hour across the ocean.

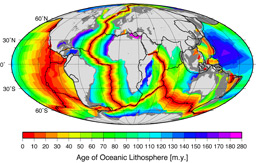
And the ocean, which is over 3000 km wide and averages ~4000 m deep, didn’t even exist back when the plankton were catching the rays.

Ocean Floor Age Map

Map of the age of the ocean floor. Most of the floor of the Atlantic Ocean is less than 100 million years old. Much of the source rock for North Sea oil was formed in the Jurassic (145-200 million years ago). Image from National Oceanic and Atmospheric Administration (http://www.ngdc.noaa.gov/mgg/ocean_age/). Click for for large version.

EDIT: 10 N0v 2011 – altered wing lift mechanism.  See comment below.
EDIT: 27 Mar 2013 – altered turbine thrust mechanism.  See comment below.
Categories: Uncategorized

Farmyard Geomorphology

Geomorphology is the study of the formation of landscapes, and may not seem immediately relevant to the farmyard.  But heaps of wet grain and mountains of fractured rock are shaped by the same processes.  It’s all just a question of scale.  This post illustrates some of the similarities.

Wet wheat behaves like fractured rocks

Freshly cut wheat, piled up into heaps as it waits to be dried, is a common sight across Scottish farmyards this September.  The grain will be fed through the grain drier, which blows hot air through it (like a huge, diesel-gulping, hair drier) and reduces the moisture content to less than 15%.  The drying process prevents the grain from germinating or going mouldy during transport and storage.

In a good year, minimal drying is required as the sun does most of the hard work while the crop is still standing in the field.  This summer has been rubbish, however.  There have been only short dry windows between bouts of rain, meaning that lots of wheat had to be harvested before it could dry out naturally.  It has left farmers cursing and big heaps of wheat with up to 30% moisture standing on the farms.

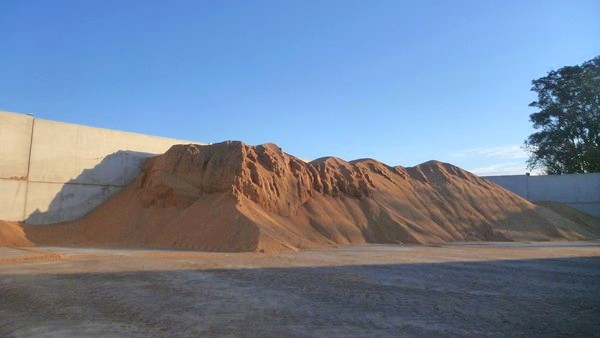
As grain is taken, bit by bit, from the heap to the drier, the geomorphological connection becomes clear.  Wet wheat is slightly sticky, so the grains do not flow past each other very easily and the pile can behave as a solid whole.  This effect is especially apparent if the grain has been sitting for a day or two.  If vertical walls remain as grain is removed from the edge of the pile, farmers know that the grain will need a lot of drying.  The moisture content is a strong control on the behaviour of the pile, and the size of walls that it can support.  This is demonstrated in the picture below.

Wheat waiting to be dried.

Grain heap ~3 m tall. The grain was cut from a number of different fields on different days and the moisture content varies from 24-28% on the left of the image, to 20-24% at the right. The ability to support vertical walls decreases with decreasing moisture content.

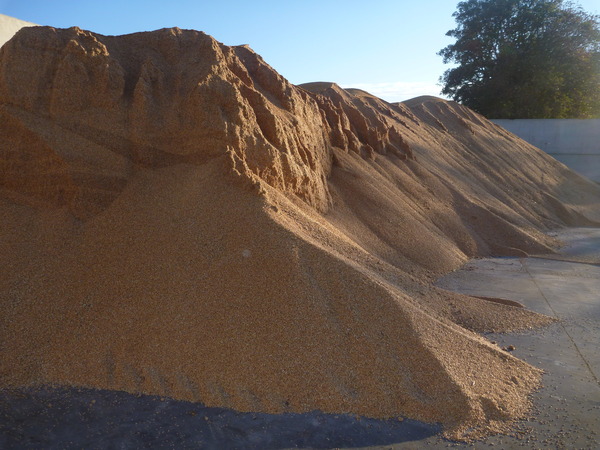
The wheat walls are not stable for long and are soon sculpted into cliffs and valleys and ‘scree slopes’ (also known as talus ramps in countries where they eat tomaytoes) of loose grains by a series of small landslides (or wheatslides?).  The results are strikingly similar to real-life mountain landscapes.  Given sufficient time, all the cliffs will collapse to form a pile with uniform, smooth sides.  The angle at which the loose grains are stable is called the ‘angle of repose’ and is higher in the wet grain than the dry.

Beans means bedrock

The collapse of the grain heap is interesting because it demonstrates processes that take thousands of years in real mountains, but in the space of a few minutes or hours.  The farmyard is like a large-scale version of an experiment published by Alex Densmore and colleagues in 1997 in the journal Science, and which is now carried out in undergraduate labs each year in order to demonstrate erosional processes.  They built a perspex box with a wall that could slide up and down,  and filled it with elongate, red beans, which simulated the bedrock in mountainous regions.  As they lowered the sliding wall, the beans spilled out over the edge.  At each stage, they weighed the beans and traced the profile of the bean surface on the transparent side of the box.

They found that the beans were not lost continuously, but fell in bursts in a series of unpredictable landslides of differing sizes.  Steep slopes could develop and last for a short time, but would be swept away in bigger events.  In fact, the vast majority of material (70%) was removed by just a small number (10% of the total count) of large events.  Densmore and colleagues concluded that the variety in landslide size was down to the existence of regions in the pile where the beans were aligned and which behaved as coherent lumps.  When they repeated the experiment using white beans (which have a more spherical shape), they found that the landslides were more regular and evenly-sized.

A closer view of the wheat pile

A closer view of the grain pile. Internal structure, formed when the pile was pushed up, is visible as aligned grains form light and dark bands. Collapse of the vertical walls leads to formation of 'scree slopes' of loose grains.

In real-life mountains, the sliding wall of the perspex box represents the lowering of the baselevel of a valley by erosion, perhaps by a stream or river.  The red beans represent bedrock that contains a network of fractures that are much weaker than the rock itself.  Such studies are important because landslides are a real danger in many parts of the world (there were a number in Nepal and India following an earthquake in the area on Sunday), and if we can understand how they work then the areas at greatest risk can be identified and avoided.

Beans versus wheat, wheat versus mountains

In the grain heap, the lowering of the baselevel is controlled by a forklift taking wheat from the foot of the slope.  Instead of a gradual lowering, this happens quickly, then the grain pile has to catch up.  While the grains can align as the beans did, grain moisture is a key factor in slope stability and dry grain behaves more like white beans.  A few large landslides make much bigger changes than many small ones.  The erosion of the walls is helped by drying of the surface by the sun, or by the wind, or by grains from above sliding down scree chutes.

Comparison between the grain and the Dolomites

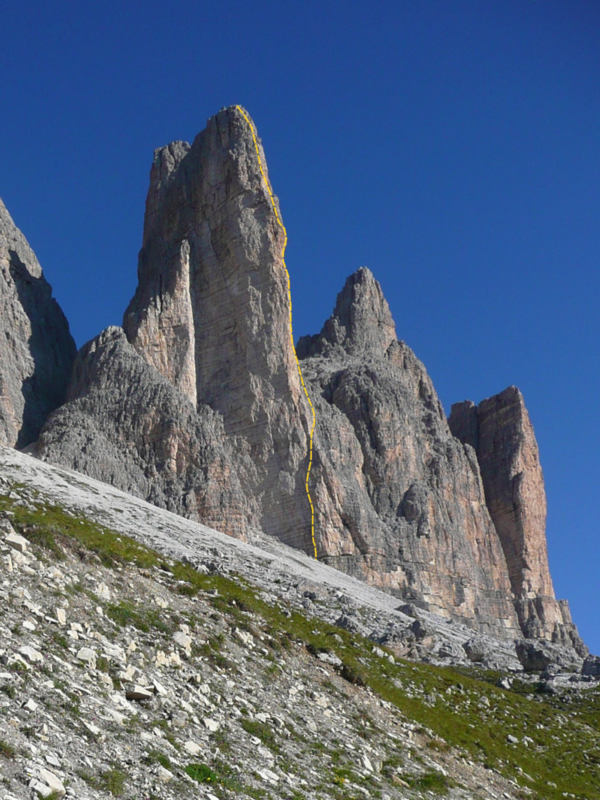
(a) Steep buttresses and scree slopes, grain pile, Fife, Scotland. (b) Steep buttresses and scree slopes, Tre Cime de Lavaredo, Dolomites, Italy.

The landscape in the Dolomite mountains of Italy bears an uncanny resemblance to the grain heap.  There, the mountains are adjusting to lowering of the baselevel by glacial erosion during the last Ice Age.  The rock contains different layers 20-200 cm thick, that make up a network of planes of weakness and frost, sun, wind and rain erode it away.  Scree chutes run between the peaks and build up at the base.

Though these mountains are literally ‘as old as the hills’ the lessons learned from the small size, high-speed example of the grain pile gives a glimpse into their future state.  The area has been designated at UNESCO World Heritage Site for its spectacular scenery.  But if you want to enjoy it, you’d better hurry up.  In a million years, it will be nothing but a pile of scree.

Spigolo Giallo

Here for a limited time only: Cima Piccola, of the Tre Cime, Dolomites, Italy. The orange line is the classic rock climb, Spigolo Giallo. As with the 'cliffs' in the grain heap, it is just a matter of time until all this is just scree.

Meanwhile, back on the farm

Fascinating though all of this is, I’m sure that most farmers would much rather see two weeks of wall-to-wall blue skies, and sun-dried grain flowing into the grain store as smoothly as water, than ponder the fate of distant mountains.  Hopefully the weather will pick up in the next few days.

Wetter grain is slightly sticky, so they do not flow past each other very easily and can act as a solid whole.  As grain are is removed from the edge of the pile, vertical walls can remain if the grain is wet.
Comments Off on Farmyard Geomorphology
Categories: Uncategorized

Grímsvötn 1 – Crossing the glacier

Last month, the Institute of Earth Sciences of the University of Iceland and the Iceland Glaciological Society organised an expedition to Grímsvötn to study the deposits of the eruption that took place there in May.  This post describes the journey to the volcano and the effect of volcanic ash and other debris from the eruption on ice and snow.

Driving on ice

Grímsvötn lies beneath the Vatnajökull ice cap, which is the largest glacier in Europe.  At 120 km by 90 km by 900 m thick, it is huge.  If, for some reason, you needed to hide the English Lake District, you could just slip it underneath.  There would be room in there for the Yorkshire Dales, too.  To get to the volcano it is necessary to drive across this expanse of ice, in our case approaching from the east.

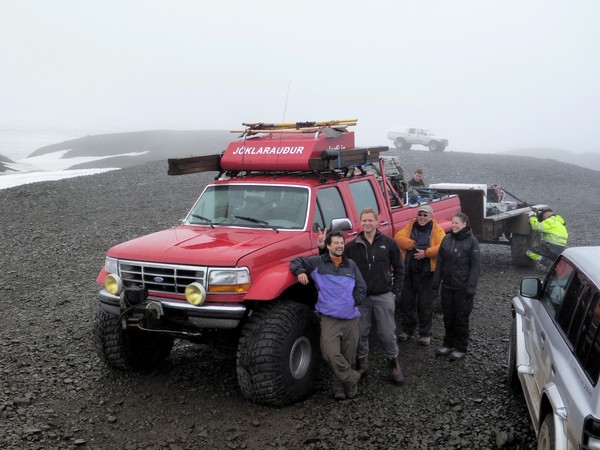
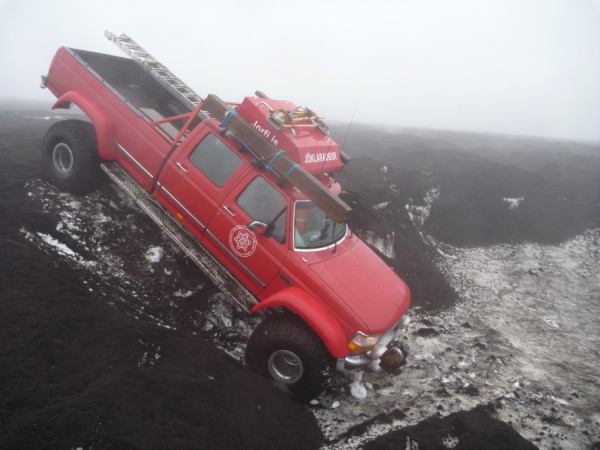
Fortunately, driving on glaciers seems to be a relatively routine practice in Iceland.  Two vehicles, equipped with winches, planks, shovels, compressors and a host of spares and tools can cross snow-covered ice with each providing a backup for the other.  The other vital component is a set of massive, waist-high tyres.

The final stage before driving onto the ice is reducing the air pressure in the tyres, which spreads the weight of the vehicle and greatly improves their grip.  It may look like the truck is loaded with everything but the kitchen sink.  That isn’t exactly true, but the large white object in the trailer is a household chest-freezer.  This was brought to store samples containing ash-filled hailstones, which were produced during the eruption.  At 08:00hrs, we were ready to get on the ice.

Follow the black ashy road

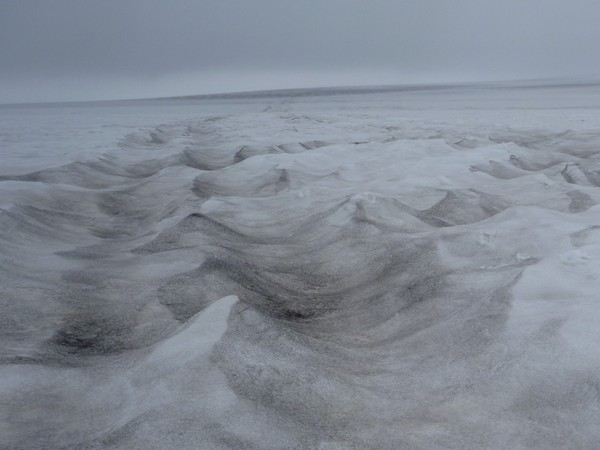
Ash from the Grímsvötn eruption is scattered thinly over the eastern part of the glacier.  The dark coloured ash absorbs sunlight, heating the snow beneath and causing extra melting.  Thus the surface of the snow, normally flat, is currently very uneven with curving ridges and smooth, wide valleys around 50 cm deep.  In places they resemble frozen waves on a choppy sea.  Crossing them is equally rough, and the maximum speed was around 10 km/hr.

The eruption took place in the late spring, so there has been little new snow to bury the ash.  Where it was blown into the tracks of vehicles that crossed the glacier back in June, it defines a vague road of long, dark, parallel trenches caused by the extra melting.

Snowfall accumulation and melting

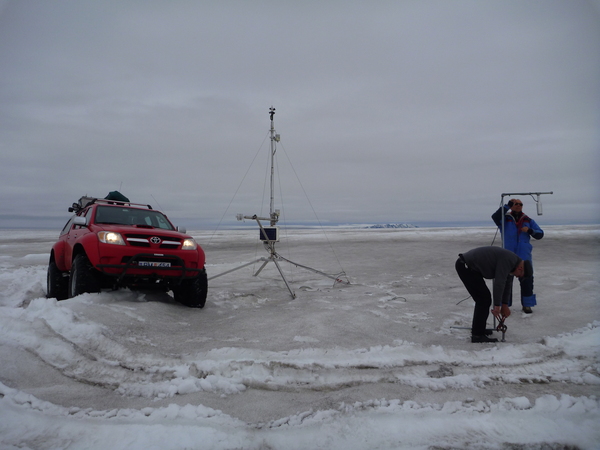
At a seemingly anonymous point, defined only by GPS coordinates, is a snow monitoring station.  It uses echo-sounding the measure the distance from the sensor to the snow surface.  In an average year, 6 m of snow fall onto the glacier in this area.  Of those, 1.5 m melt and evaporate away; the remainder compacts and joins the rest of the ice flowing slowly to the lowlands.  We stopped to adjust the height of the sensor and to download the data.

Thicker tephra and dirt cones

Tephra is the technical term for all the ash and pumice and rock fragments that are thrown out by an exploding volcano (strictly speaking, ash only refers to material less than 2 mm in diameter).  Closer to Grímsvötn, the tephra got gradually thicker and coarser.

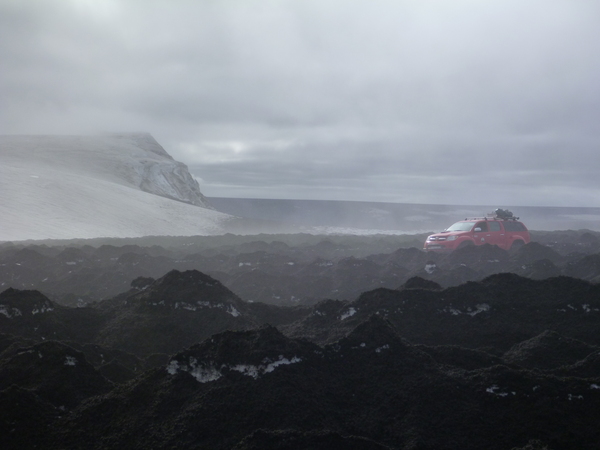
Once the tephra thickness gets more than a few centimetres, the effect that it has on the underlying snow changes.  While the black tephra still absorbs extra sunlight, if the layer is thick enough then the heat isn’t transmitted through to the snow.  Instead of enhancing melting, the underlying snow is protected.  The result is a rough landscape of dirt cones.  While the cones may be a metre high, the tephra only accounts for a black, sandy skin over their snowy cores.

Approaching the huts – Plan A

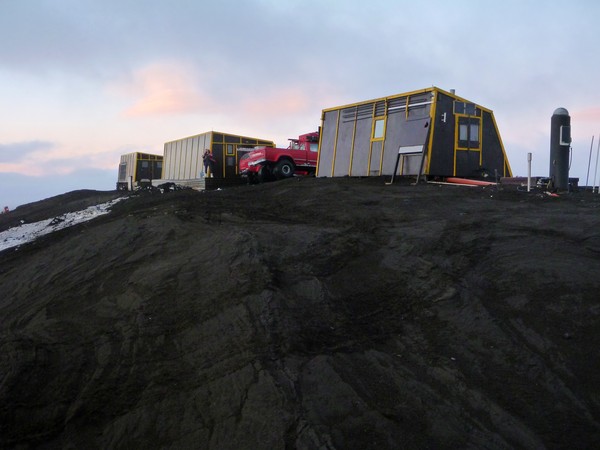
We were aiming for three wooden huts built on a ridge of rock called Grímsfjall, that pokes out above the ice.  The normal approach is to drive up the slopes from the south, as the direct route from the east is blocked by a series of large crevasses.  It appeared, however, that this route was also impassable.  Where the tephra was even thicker (10-15 cm), it gave more uniform protection to the snow beneath, resulting the a series of large plateaux about 2 m taller than their melted-out surroundings.

After driving back and forth along the foot of Grímsfjall and scanning the slope with binoculars, we could not see a way through.  Potential leads were explored on foot, but they they were dead ends, finishing in steep dirty walls.

Approaching the huts – Plan B

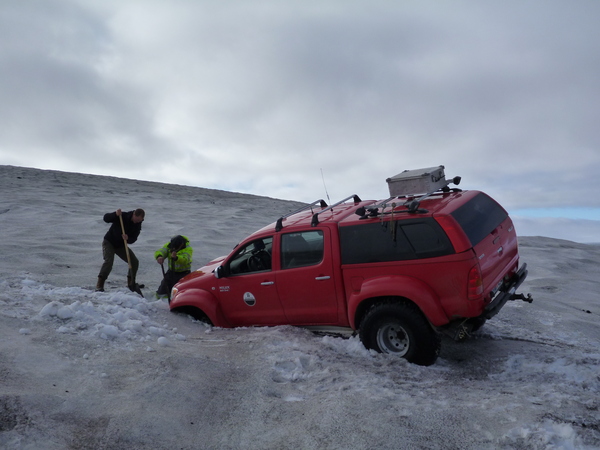
It was decided that the best approach may be to try a bit further east, where the tephra was thinner.  Driving up the slopes, things seemed promising as the black piles gave way to more open snow fields.  We progressed steadily higher until CRUNCH!  The front of the truck fell into a crevasse.  These deep cracks form in the glacier where the ice accelerates down the slope and they are covered in snow-bridges that hide them from view.  As the truck drove onto it, the bridge collapsed and it dropped down to its axle.

Removing the truck was suprisingly straightforward.  Jump out, clear the snow from the front, set up a jack on the far side of the crack (which was only about a metre wide), jack up the truck, reverse out.  It took less than 20 minutes.  We looked for an area to the side where the crevasse was narrower then continued upwards.

CRUNCH!  Another crevasse.  We were going to need another plan.

Approaching the huts – Plan C

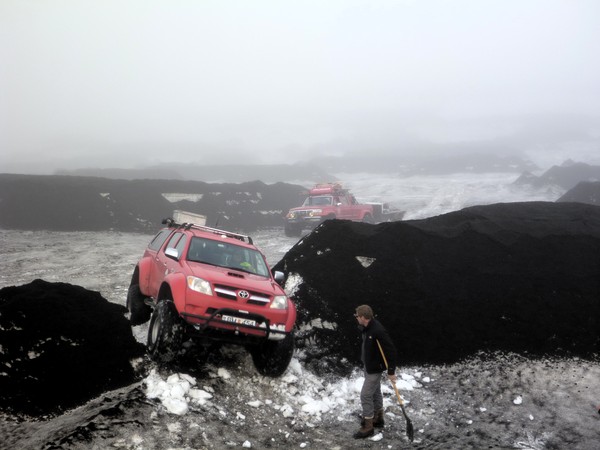
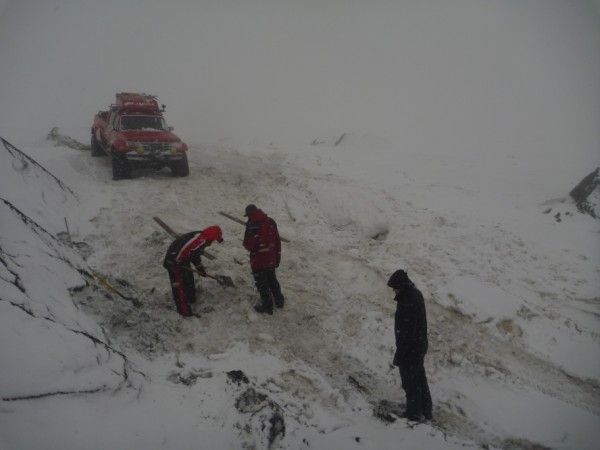
Where two high ash-covered platforms met, there was sometimes a notch in the wall.  The notches were too narrow to drive through, but with a bit of shovelling, they could be enlarged sufficiently to allow the trucks and trailer to pass.  A route was staked out on foot, then the gateways were dug through the snow.  Four breaks were enough to give us access to the huts.


The Grímsfjall huts

Once through the worst of the tephra platforms, it was easy going to the crest of Grímsfjall and the huts.  We finally arrived there at 20.30 hrs.  With good snow conditions, the journey across the glacier can take just two hours.  It had taken us over twelve.  The difference was due to the tephra on the ice.

Some observations from the fieldwork are described in the following post (Grímsvötn 2 – What was in the plume?) and there are some more vehicle-themed photos in another (Grímsvötn 3 – Bonus truck pictures).

Categories: Uncategorized

Grímsvötn 2 – What was in the plume?

The May 2011 Grímsvötn eruption blasted ash and pumice and rock fragments (collectively known as tephra) through the Vatnajökull glacier, forming a massive plume up to 20 km tall.  It was the biggest eruption in Iceland since Hekla 1947.  Locally, ash rained down across southern Iceland turning day into night, while the finest grains were swept across the Atlantic to be deposited at least as far afield as in the UK.  There are nice images of the plume and its consequences at The Boston Globe website.

Last month, the Institute of Earth Sciences of the University of Iceland and the Iceland Glaciological Society organised an expedition to Grímsvötn to study the deposits of the eruption.  Following an adventurous journey across the glacier to the volcano (see Grímsvötn 1 – Crossing the glacier and Grímsvötn 3 – Bonus truck pictures), it was possible to see the deposits of the eruption, and thus what was in the plume, at first hand.  This post shows what was erupted and explains some of what the deposits can tell us.

All this should be snow

The dispersal of volcanic ash is controlled by the wind.  During the May 2011 Grímsvötn eruption, southerly winds blew the top of the plume northwards, while northerly winds blew the lower part to the south.  It was the lower part that contained most of the tephra that was deposited near the volcano.  Tephra is the technical term for all the ash and pumice and rock fragments that are thrown out in an explosive eruption (strictly speaking, ash only refers to material less than 2 mm in diameter).

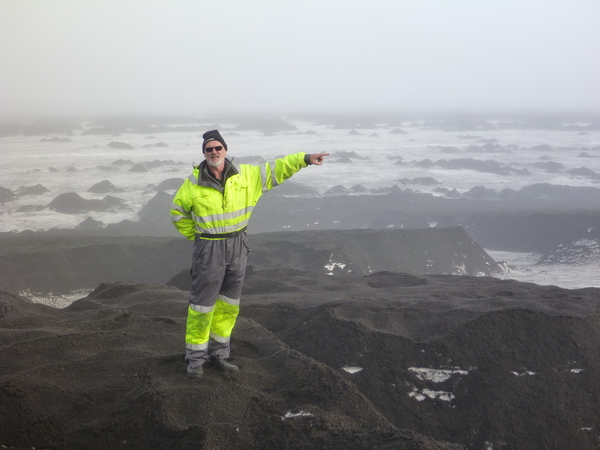
This view, looking south from across Vatnajökull, should be dazzling white snow and ice all the way to the coast.  Instead, it is black: a vast dark plain of pumice and ash extending tens of kilometres from the crater.

Calculating the erupted volume

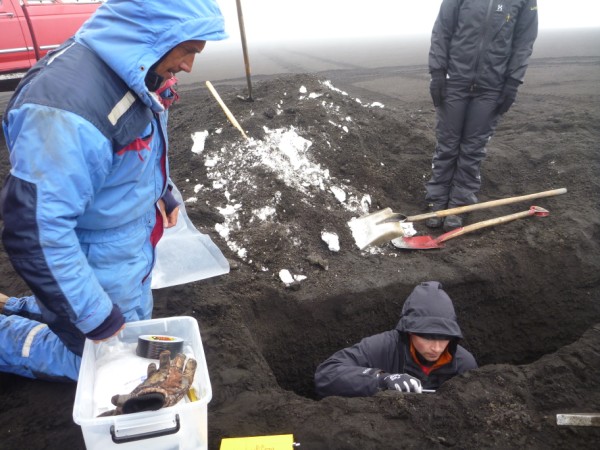
Digging through the black surface reveals the bright snow beneath.  This makes it easy to measure the thickness of the tephra layer in different locations.  A simple, but very important, question can be answered from the resulting map of tephra thickness: how much material was erupted?


At this location, if you keep digging, you will pass nothing but snow, ice and ancient tephra layers for over 700 metres before you finally reach the bedrock.


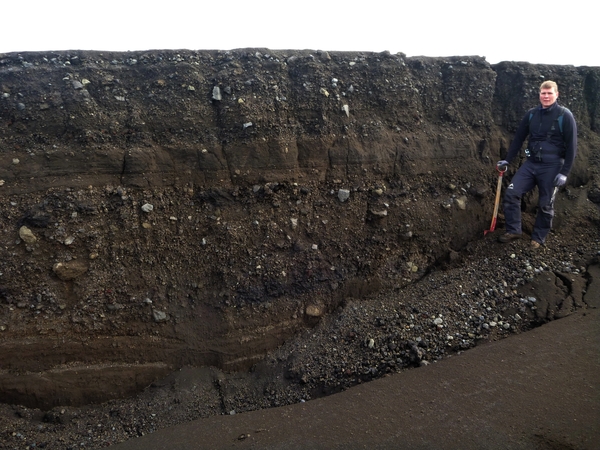
Closer to the crater, the tephra gets thicker and contains coarser, gravel-sized, pumice grains.  At this site 8 km downwind of the crater, the deposit is nearly 2 m thick, and the hole took eight people over an hour to dig.  It is clear why lone murderers favour shallow graves.  A layer of ashy-hailstones that fell during the eruption has refrozen into an icy layer near the base.  These were collected and transported back to Reykjavík in a freezer.

Other things that tephra can tell us

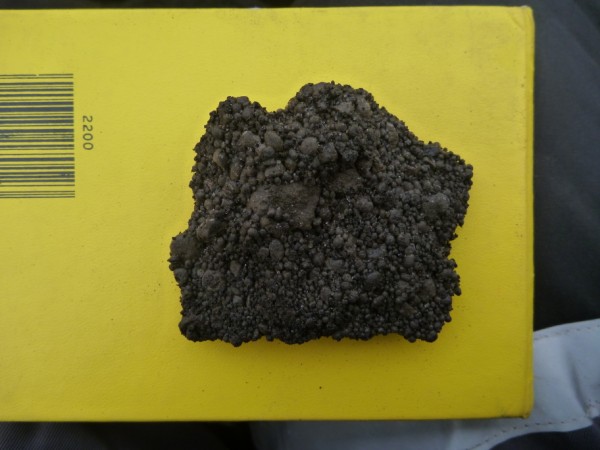
The deposits mainly contain ash and pumice: broken-up, bubbly rocks.  The ash is fragmented pumice and looks like black sand or grit.  All of this rock was hot enough to be liquid magma just moments before it erupted from the ground.  A detailed look at some of the grains can tell us more about the eruption.

The first photo shows tephra from a layer that was full of smooth brown spheres called accretionary lapilli.  If you cut one open, you find concentric rings (like in a gobstopper or an onion) of very fine ash grains.  These form as the ash is swirled around in the turbulent plume.  Helped by moisture, fine grains stick to the outside of the growing lapillus, building it up layer by layer.

It is important to understand accretionary lapilli because if these fine ash grains are sticking together and falling out onto the glacier then they aren’t drifting off downwind to bother European airports.


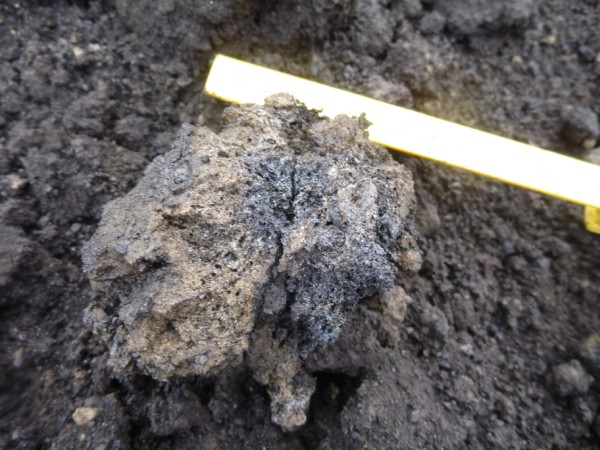
The second photo shows a piece of golden-coloured pumice.  It is very lightweight and contains millions of tiny bubbles.  This is unusual for basaltic tephra, which commonly has only a few, large bubbles.  Bubbles in volcanic rocks form when gases dissolved in the magma are released (exsolved), usually in response to decreasing pressure as the magma rises up from depth.  Thermodynamically, it is much easier for exsolving gas to join an existing bubble than to form a new one, so pumice with lots of tiny bubbles tells us that the gas was all trying to get out in a hurry.

The golden pumice therefore means that the magma rose very quickly from deep beneath the volcano.  This is consistent with the very intense eruption.  Geochemists can measure how much gas is still dissolved in the rock, and how much is dissolved in material trapped inside crystals that formed at depth.  From this, they can estimate the depth at which the magma was stored before the eruption, and how much gas (such as SO2) was released.

The southern crevasse field

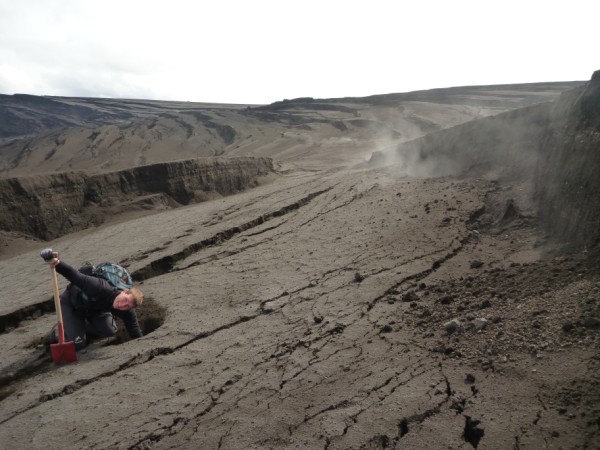
Great volumes of ice near the crater was melted during the eruption.  Since then, the glacier has flowed back toward the crater, producing a network of crevasses on the surface.  Unlike crevasses in a more alpine setting, tephra has fallen into and filled these ones, allowing the area to be explored in relative safety.  Unlike crevasses in a more alpine setting, these ones have steam coming out of them.  Just a few centimetres down, the tephra pile here is still warm.


The long, tall walls produced by the crevasses are a volcanologists dream, as they expose all the individual layers produced by different stages of the eruption.  These can be traced and measured over a wide area without the need for any digging whatsoever.  Here, the deposit is rich in pale-grey, angular, dense rocky chunks, 10s of centimetres in diameter.  These were cold pieces of old lava flows or other parts of the volcano that were ripped up and spat out during the eruption.  They are heavy, and rained out from the plume close to the vent.

A view of the crater area

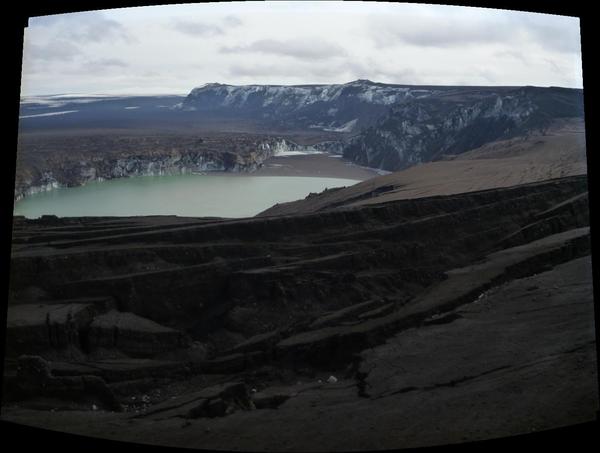
Looking across the crater area. Click for bigger version

The photo shows the crater area, looking from the west.  The crevassed area in the foreground, with all the exposed tephra layers is clear.  The ridge on the skyline is Mt Grímsfjall, and the huts are located at the far end.  The cliff is about 200 m high.  The eruption began along a 1.5 km fissure running parallel to the cliff, before focussing on a few craters.

The lower, flat, area of ice sits mainly on top of the permanent subglacial lake, Grímsvötn, which is kept from freezing by geothermal heat at the base.  The water drains periodically from Grímsvötn in floods called jökulhlaups.  The lake in the foreground has formed since the May 2011 eruption by surface water flowing in, and has flooded the site of the craters.  The black area at the far end of the lake is not a beach, but a raft of floating pumice stones.  The vertical ice cliffs are capped with tens of metres of tephra, and sometimes come crashing down into the lake.

It is a spectacular place.

The journey to Grímsvötn is described in the previous post (Grímsvötn 1 – Crossing the glacier) as well as the effect of the tephra on the glacier.  The following post (Grímsvötn 3 – Bonus truck pictures) describes the difficulties of working on the tephra-covered glacier.

Categories: Uncategorized

Grímsvötn 3 – Bonus truck pictures

Last month, the Institute of Earth Sciences of the University of Iceland and the Iceland Glaciological Society organised an expedition to Grímsvötn to study the deposits of the eruption that took place there in May.  This post describes some of the difficulties in working on the debris-covered glacier.  There are other posts describing the adventurous journey up to the volcano (Grímsvötn 1 – Crossing the glacier), and the huge volume of material produced during the eruption (Grímsvötn 2 – What was in the plume?).

Hiking in the clouds

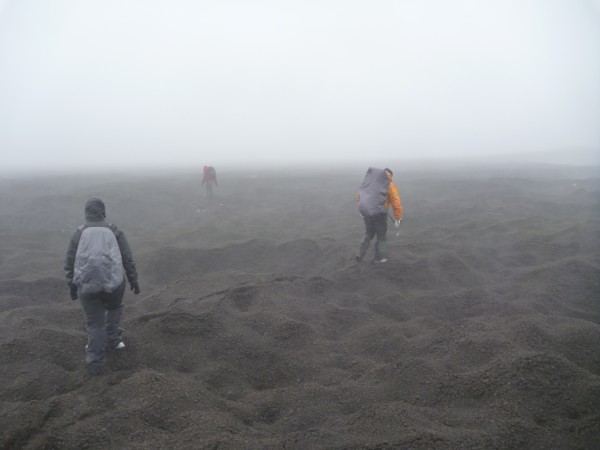
The journey across the glacier had been slow, as patchy cover of volcanic-debris and uneven melting had created a maze-like landscape of ridges and platforms on the surface of the glacier.  It was decided that the best way to get to the interesting geology would be to hike the 5 km from the huts.  The cloud was down, it was 2 degrees C, damp and windy.  The loose pumice and ash were soft underfoot.  Visibility was 20-100 m and navigation on the featureless terrain was by GPS.  The hike took 3 fairly-miserable hours in each direction.


It was decided that the best way to get to the interesting geology would be to somehow get the trucks through to where the surface was more continuous.

Building a road

The following afternoon, a ‘road’ was constructed.  Narrow ridges were dug through, holes were filled with snow, sharp edges on walls were softened to form ramps.  It was hard work.  Fortunately, the definition of ‘road’ for these trucks is quite broad.


The road meant the we could get to the interesting region in 1.5 hours, and arrive dry and warm, ready to work.  We could also move quickly between sites where the surface was smooth.  We used it for the following days, and scenes like the one below became almost routine.


Welding in a blizzard

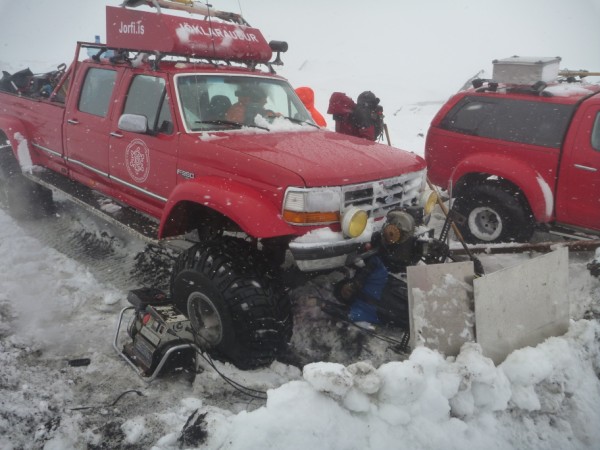
During the days that we worked on the glacier, the snow was melting.  By the time we were ready to leave, it had lost about 10 cm, weakening the snow bridges that we had used to cross crevasses on our way up.  On the homeward journey, a bridge collapsed beneath the front left tire of the big Ford F350 and it dropped to its belly.  We couldn’t get it out using the jack alone (as we had done previously) so the Hilux came round and winched it out.  A close look showed that the axle had been broken.  We had a spare, so it was changed there and then.

Further inspection showed that part of the suspension had been damaged, too.  It turns out that we also had a generator and welding equipment, so that was fixed there and then as well.  On a glacier, in a blizzard, in less than two hours.  It takes a week to get an appointment for the annual MOT test at my local garage!  It seems that a mechanic is top of the list of things to bring on this type of expedition.

Bridging the crevasse

To finally cross the crevasse, it was ‘bridged’ with wooden planks, which spread the weight of the truck across a wide area of snow.  The same principle allows a skier to cross snow bridges that a hiker would fall through.  Once out of the crevassed area, the return journey was straightforward, but slow.  We reached the edge of the glacier 12 hours after setting off.


The outward journey to Grímsvötn is described in the post Grímsvötn 1 – Crossing the glacier, and there are descriptions of the results of the eruption itself in Grímsvötn 2 – What was in the plume?

Comments Off on Grímsvötn 3 – Bonus truck pictures
Categories: Uncategorized

The most caring country on Earth?

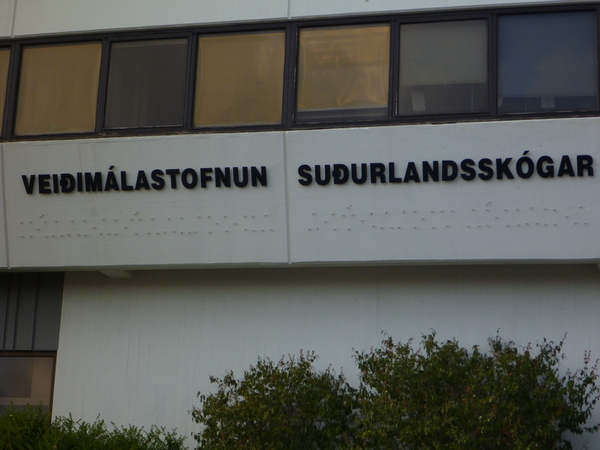
I knew that Icelanders have a reputation, like most Scandinavian countries, of having a strong sense of community and inclusiveness.  But I was particularly impressed when I saw that this office had gone as far as putting up a copy of its name in braille.

No, I am not being serious.

Office block with braille sign in Selfoss. Click for larger version.

Is Iceland the most caring country on Earth? Yes, I know it was an old sign.

Categories: Uncategorized

A taste of Hekla

Queen of Icelandic volcanoes

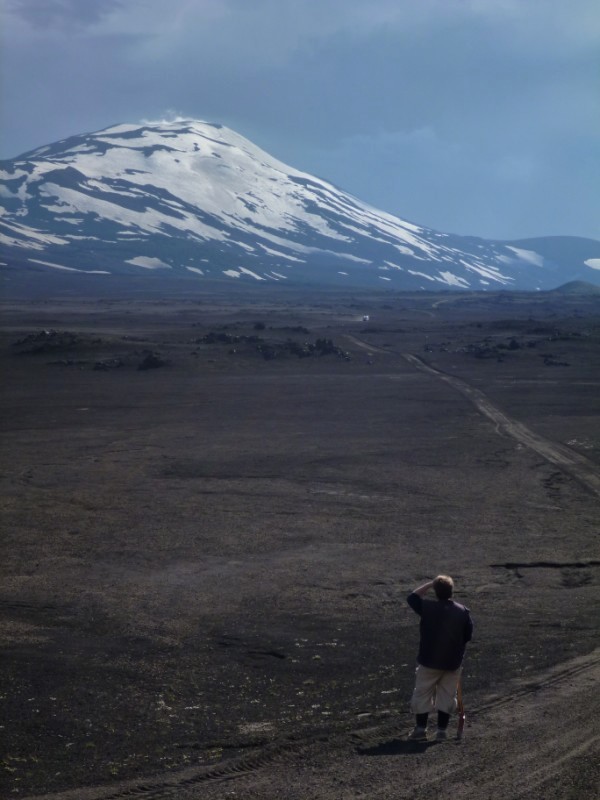
Hekla is the Queen of Icelandic volcanoes, famed and feared throughout Middle-Ages Europe as news of her fierce eruptions percolated back to the continent.  She was in the news again recently when GPS sensors detected ground deformation around the volcano.  Although many mainstream media reports of the unrest were riddled with errors and hype, it is true that recent eruptions have come with little prior warning.  Consequently, people in Iceland are keeping a close eye on her.

what are you up to?

Hekla viewed from the north.

This post contains photos from recent fieldwork looking into some of her past eruptions.  They give a taste of what she can do if she’s in the mood.

Tephrochronology

Tephrochronology is the use of tephra horizons in soils and lake cores as a dating tool.  Tephra is the technical term for all the ash and pumice and rock fragments ejected from a volcano during an explosive eruption (strictly speaking, ash only refers to particles less than 2 mm in diameter).  In Iceland, as elsewhere, this technique is an important method in working out the size and frequency of explosive volcanic eruptions in the past.

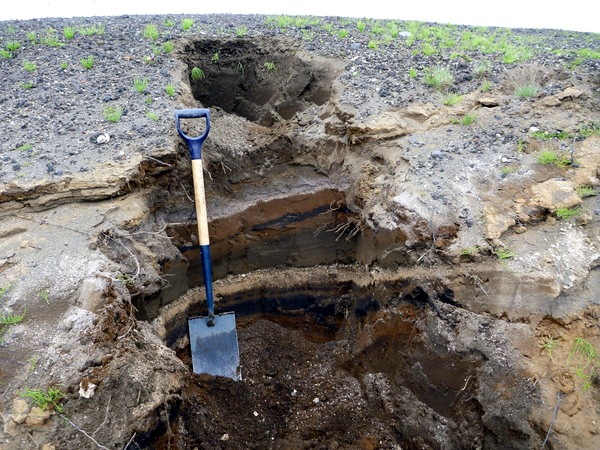
Tephra pit

A tephra pit in south Iceland. In general, soil is brown and the light and dark bands are tephra horizons from volcanic eruptions. The black bands here are from Katla eruptions. The upper and lower pale-coloured bands are from eruptions of Hekla and Torfajökull volcanoes, respectively.

The Hekla 4 eruption

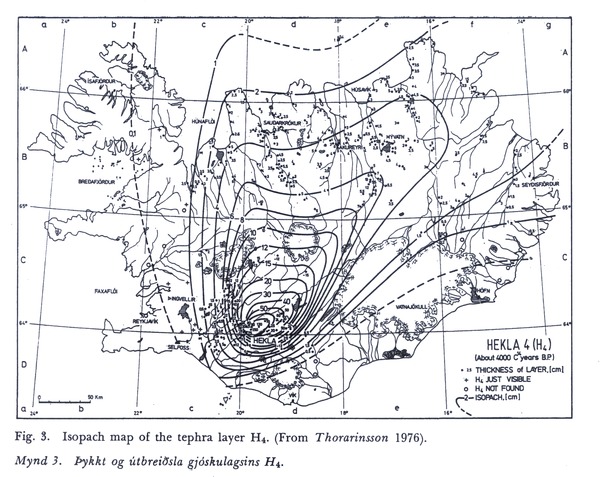
The Hekla 4 eruption (H4; estimated to have occured approximately 4000 years ago) was one of the largest explosive eruptions in Iceland since the Ice Age ended about 10,000 years ago.  Around 5,600,000,000 cubic metres of tephra was erupted, which puts the eruption into Category 5 of the Volcano Explosivity Index, alongside Mount St Helens 1980 and Vesuvius 79 A.D.  Ash from the eruption can be found across Scotland and Scandinavia, where it is an important tephrochronological marker.

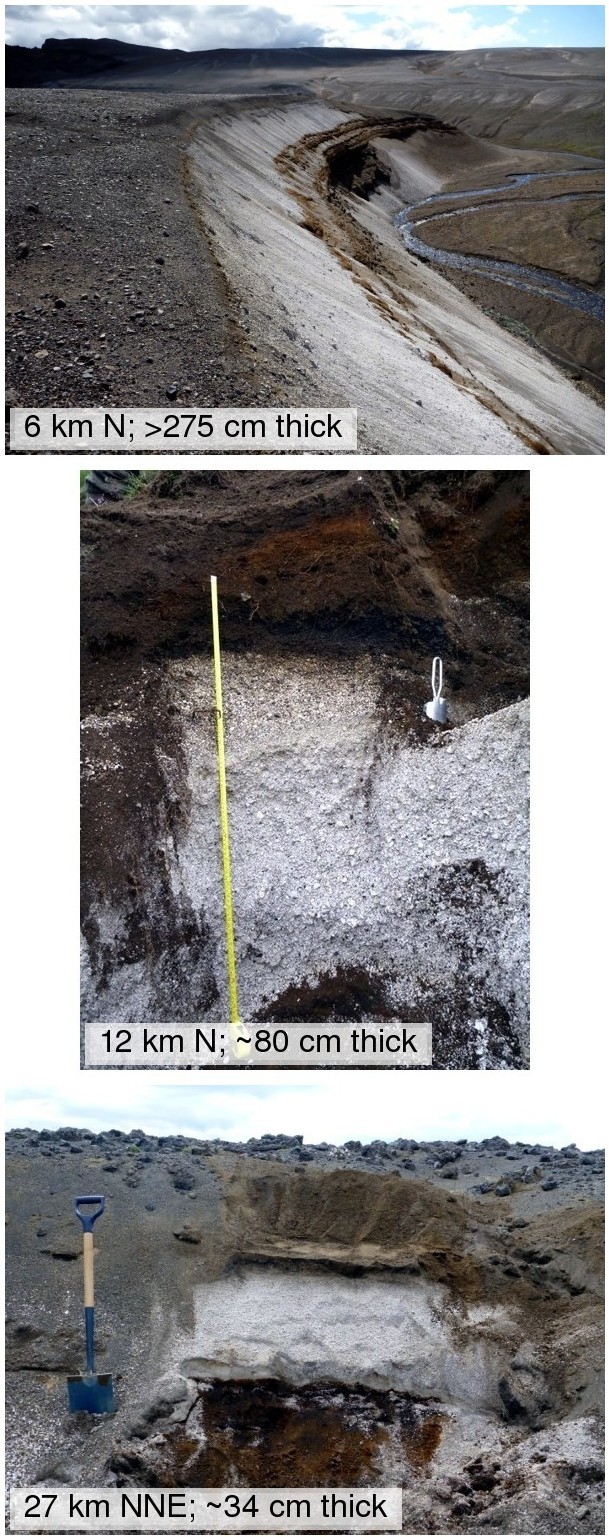
Soil pits

Soil pits containing Hekla 4 tephra across South Iceland. The layers consist of chunks of white, bubbly pumice and smaller dark fragments of older lava that were ripped from the volcano during the eruption. As you get further from the volcano, the layers get thinner and the chunks of pumice get smaller.

The scale of the eruption can be appreciated by tracing the thickness of the tephra layer across the surrounding countryside.  The early parts of the eruption produced distinctive white rhyolite pumice that is easily seen against the brown soil.

Isopach maps

Isopach maps show the thickness of tephra layers produced in explosive eruptions.  The isopach map for the H4 eruption was published by Icelandic volcanologists over 30 years ago, and was produced with data from hundreds of tephra pits all over the country.  The total volume of the eruption can be calculated from the area contained between each of the contours of tephra thickness (isopachs).

H4 isopach map

Isopach map for the Hekla 4 eruption. The contours give the thickness of tephra in centimetres. Most of the tephra was blown to the north of the volcano and over half the country received more than 1 cm of ashfall. Click on the image to see a larger version. Source: Larsen, Gudrún, and Sigurdur Thorarinsson. 1977. “H4 and other acid Hekla tephra layers.” Jökull 27 (27): 28-46.

By revisiting this work and sampling the tephra at many locations, modern methods can used to get an even better understanding of the eruption.  In particular, by knowing the grainsize distribution in each sample, the total amount of fine ash produced can be estimated.  It is fine ash (<64 microns diameter) that travels furthest from the volcano and interferes with air travel.  If we know how much was produced in H4 then we can work out the likely consequences of a similar eruption.

The next eruption of Hekla

The next eruption of Hekla will probably not be as large as the Hekla 4 eruption, however.  The most recent eruptions (in 1970, 1980, 1981, 1990 and 2000) were all much smaller.  Each began with a short explosive phase lasting hours to days, followed by days, weeks, or months of lava production.  The 1947 eruption was the largest Hekla eruption last century; the explosive part was similar in size to this year’s Grímsvötn eruption and tephra can still be found within peat bogs in the British Isles.  The volcano then went on to produce smaller explosions and lava flows for the following year.

New rules on volcanic ash avoidance meant that disruption to air traffic due to the recent Grímsvötn eruption was much less than that caused by the Eyjafjallajökull eruption of the previous year, despite more tephra being produced in a short amount of time.  These rules would also apply during any future Hekla eruption, so flight cancellations would probably number in the hundreds as opposed to the tens of thousands.  This scenario may not sound too disastrous to European airport bosses, but that view is not shared in Iceland, where a northerly wind would dump the tephra across the fertile agricultural regions in the southern part of the country and a big eruption could put local farms out of action for years.

The Icelanders continue to watch their Queen of Volcanoes.

Categories: Uncategorized

Quick, multipart, annotated figures with ImageMagick

This is the first post so far that is much more 01010 than volcan.  As well as discussing volcanology, an aim of this blog is to share some of the computing methods involving free software that I use each day in my work.  I am sure that many people will find them useful, both inside and outside the worlds of science and academia.

ImageMagick

ImageMagick is a command-line program for manipulating images.  It is installed as standard on most Linux distributions and can be installed for Windows or Mac from here.  Although it can take a while to learn the commands, once you know them you can do things really quickly.  Furthermore, you can link them into a script to perform complicated manipulations on lots of images automatically.

This post shows how to use ImageMagick to overlay simple text annotations onto images, and to combine them to produce a multipart figure.  In this case, the command line method is  significantly quicker and easier than opening a clunky program such as Corel Draw or Adobe Illustrator and doing it by hand.

Annotating the image

Annotated volcan01010 logo

The volcan01010 logo has been annotated with (a) on a semi-transparent white background using the example command.

convert volcan01010_logo_white.png -resize 490x260 \
-background '#ffffffa0' -fill black \
-font Helvetica-bold -pointsize 28 \
label:' (a) ' \
-gravity northwest -geometry +10+12 \
-composite a_logo.png

The command breaks down as follows:

  • convert:  One of the ImageMagick programs.
  • volcan01010_logo_white.png:  The input file name.
  • -resize 490×260:  Resize image to 490×260 pixels wide.
  • -background ‘#ffffffa0’:  Set the colour of the text background, using hex codes.  The last two digits control transparency (00: transparent, ff: opaque).  You can also use none.
  • -fill black:  Set the text colour.  Hex codes can also be used.
  • -font Helvetica-bold -pointsize 28:  Set the font and size.
  • label: ‘ (a) ‘:  The text to write.  You can also use this to label different parts of a figure, or to give an image a title.  The extra spaces give a padded box.
  • -gravity northwest -geometry +10+12:  Text positioning, in pixels from a chosen corner.
  • -composite:  Overlays the label on the image.
  • a_logo.png:  Output file name.

Note that the backslashes ‘ \ ‘ are to tell the computer that the code continues onto a new line.  This makes it easier to read, especially on the blog.  They aren’t necessary if the command is entered on one long line.

It often takes a bit of trial and error to get the correct settings for the font size and position, as they depend on the size of the image.  The images here are quite small; a single column image in a scientific journal should be about 1600 pixels wide (for printing at 500 dpi).

Combining the images into a multipart figure

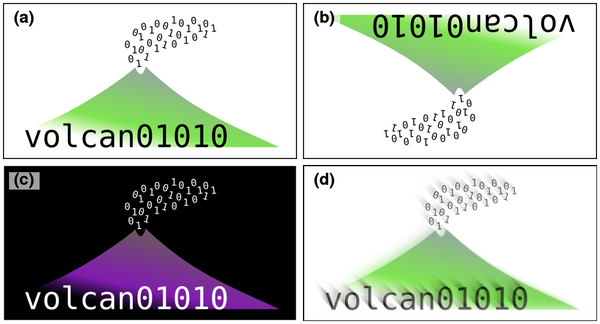
Multipart images

The multipart figure using annotated images, combined with the montage command. (a) Original. (b) Rotated 180 degrees. (c) Negative. Note the semi-transparent background on the annotation. (d) Motion blur.

montage a_logo.png b_rotated.png c_negative.png d_motion_blur.png \
-tile 2x2 -geometry +5+5 multipart.png

The command breaks down as follows:

  • montage:  One of the ImageMagick programs.
  • a_logo.png … d_motion_blur.png:  Input file names.
  • -tile 2×2:  Sets how the images are laid out.
  • -geometry +5+5:  Controls the size and spacing of the images.
  • multipart.png:  Output file name.

Other uses for ImageMagick

There are a host of other supremely useful functions in ImageMagick.  The convert command is primarily used to convert between formats e.g. jpg, tif, png.  Some of the other commands or options that I frequently use are listed below.  If you Google them, you can find full instructions.

  • mogrify:  Change an image in-situ e.g. input file = output file.
  • -rotate 90:  Rotate image.
  • -trim:  Remove unnecessary white border from around an image.
  • -bordercolor white -border 2×2:  Add border of chosen size and colour.
  • -colorspace Gray:  Convert to grayscale.
  • -append:  Join two images together.
  • -composite:  Overlay one image over another (e.g. a logo or watermark).
  • -blend:  Blend one image into another (e.g. a logo or watermark).
  • +repage:  Sometimes necessary to scale png files correctly.
  • -fuzz 2% -transparent white:  Replace white with transparent (in png files).
  • -shadow:  Add a shadow to an image.
Categories: Uncategorized