In the previous post, I highlighted some indirect measurements of Grímsvötn ash in the UK. Now that there has been time to collect and process samples there is lots of concrete, irrefutable proof that the ash cloud came over the UK on Tuesday. I really despair at the amount of media coverage that was given to the ‘Ash Cloud Myth’ camp, as it diverted attention from legitimate and important questions such as:
- How can we improve the way that we use satellite data and other observations to check and refine model outputs?
- How exactly are all the possible effects of ash on an aircraft combined to determine the safe flying threshold? What are the extra risks of setting it at 5 or 25 or even 50 mg m-3?
- How much of the decision to fly should be with the operators, and how much with the government?
These questions are far more subtle, and the best answers will take time to find. We have come a lot closer to them in the year since Eyjafjallajökull. Hopefully we will be closer still by the next time. Because there will be a next time…
How many roads must a man walk down before you call him a man?
Volcanic ash, pollen, soot, mineral dust, insects and bits of leaves. And rain.
Not a very helpful answer, but that is what is actually blowin’ in the wind. Here are a collection of images of ash samples from the UK. They are presented in order of increasing magnification.
Reflected light microscope (45x magnification): sticky tape samples
The image shows what I found in my saucepan sample, collected on Wednesday night using the method described here. Unfortunately, it doesn’t have any obvious ash in it. Most of the ash fell on Tuesday, so I missed it here. Some of the ash sightings during the Eyjafjallajökull eruption turned out to be false alarms, so I’ve put up this picture to show the kinds of things that are blowing around all the time.
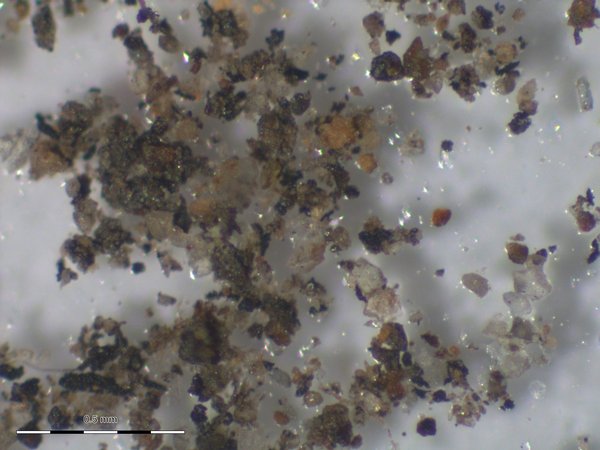
Assorted mineral grains collected from rainwater in Edinburgh. Most of these are >100 microns in diameter. So far, ash grains from the UK have been less than 50 microns. Other samples contained soot, insects and bits of plant material.
The British Geological Survey made a request for samples from the public, and these are beginning to arrive now. Hopefully they will have more luck than I did.
Transmitted light microscope (500x magnification): pollen sampling slides
The Met Office measure the amount of pollen in the air each day, in order to make pollen forecasts. These are useful for hayfever sufferers. This week, the sampling equipment also trapped volcanic ash grains, which are about the same size. The grains in the images below were collected in Lerwick and in Exeter between Monday and Wednesday, demonstrating that although the worst of the ash was in Scotland, there were lower concentrations all over the country.
The first image shows an individual ash grain that fell in Exeter on Monday night in Lerwick on Tuesday or Wednesday. The bigger grain is about 50 microns in diameter (i.e. you could fit ~20 of them in a millimetre). Magma is a mixture of crystals and bubbles and molten rock. When it freezes quickly during an explosive eruption, the molten rock turns into glass. You can see the glass and bubble shapes clearly in this grain. (Compare it with an Eyjafjallajökull grain shown in this post.)
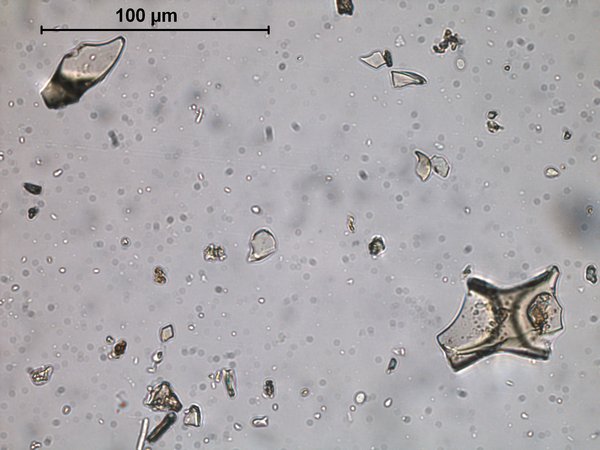
Basaltic ash grains from Lerwick. The larger grain shows bubble-wall shapes. The right-hand bubble contains finer ash grains inside it. Note: the original edit of this post featured a grain from an Exeter pollen slide; this image replaces that one.
The second image is from Tuesday’s slide. What looks like leopard-print wall paper is actually a fossilised rain shower. Each of the little circles was an ash-filled raindrop that was collected on the sample slide. Rainfall (or ‘wet deposition’) is an important factor in removing ash from the plume.
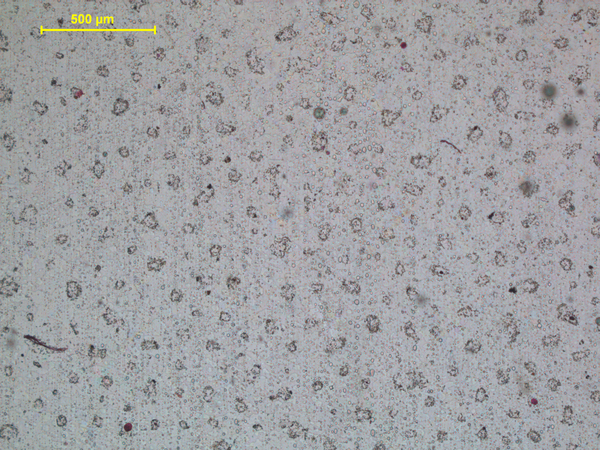
A fossilised rain shower. Drops of ash-laden rain landed on the Met Office pollen sampling slides.
The third image is a close-up of the fossil raindrops. Each one forms a ring about 50 microns wide, and consists of 50-100 grains of ash, each only 5-10 microns in diameter. The clear, round blobs that form lines down the image are bubbles in the glue on the slide.
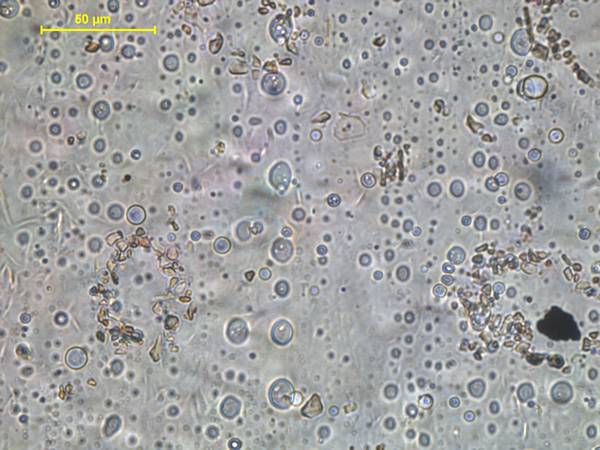
Close up of the pollen sample slide, showing rings of tiny individual ash grains.
Scanning Electron Microscope (~2000x magnification): rain-washed dust
The ash grains that have reached the UK are generally very small, so a scanning electron microscope is used to get a good look at them, at magnifications of 2000x or sometimes more. A sample of dust from a car parked in Lerwick, in the Shetland islands, was analysed by the Scottish Environmental Protection Agency. It was found that the dust contained thousands of tiny (less than 10 microns), ash shards. Many of these had clumped together to form ‘aggregates’. Aggregate formation is another important process in deposition of ash from a plume, because a big clump of many grains will fall to Earth much more quickly than the individual grains would do alone.
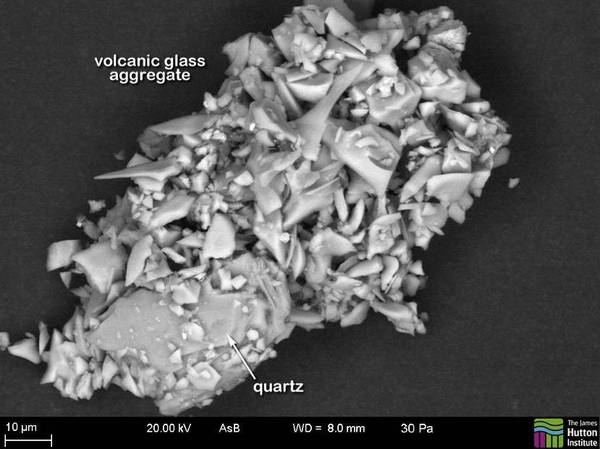
SEM image of volcanic ash from the SEPA website.
The image shows a quartz grain amongst a cluster of tiny ash grains, but you wouldn’t know it just by looking at it. The composition of the grains is worked out using a technique called Energy Dispersive Spectroscopy. This works by using the electron beam to knock other electrons out of the atoms in the sample. The gap is filled by another electron from within the same atom, and energy is released as an X-ray. The wavelength of the X-ray is specific to the type of atom e.g. iron is different to magnesium is different to lead. By measuring the wavelengths of all the X-rays, you can tell which types of atoms are in your sample. Quartz (chemical formula SiO2) produces big spikes corresponding to silicon and oxygen. Volcanic glass contains a huge range of different elements (silicon, oxygen, aluminium, iron, magnesium, calcium, sodium….). This is how they worked out what each grain was.
Have a look at the SEPA website for the full report, which contains lots of other nice images. The British Geological Survey has SEM images on their Grímsvötn page, too.


Pingback: Cenizas volcánicas al microscopio | Ciencias y cosas
Pingback: Grímsvötn: images of UK ashfall - Environmental Dust Monitoring Blog - - June 3, 2015