Erosion makes mountains beautiful

The thing that makes mountains so beautiful and fascinating,is not so much their height as their steepness. Climbers and trekkers flock to the High Himalaya, not to get altitude sickness but for the grandeur of the landscape, the experience of seeing views that require you to lift your head up. Mountains are created by deep-seated geological processes that raise the surface of the earth, but it is erosion that creates the scenery we love.

Erosion is often taught in terms of gentle everyday processes – tiny fragments of rock falling off and slowing washing downstream. Over the awesome expanse of deep time such tiny events can indeed wash away mountains. But mountainous areas can rise at rates of centimetres a year – is small-scale mechanical weathering really quick enough to keep up with such rapid uplift? Erosion in mountains also involves faster acting processes: ravine-making rivers, grinding glaciers and lots of landslides.

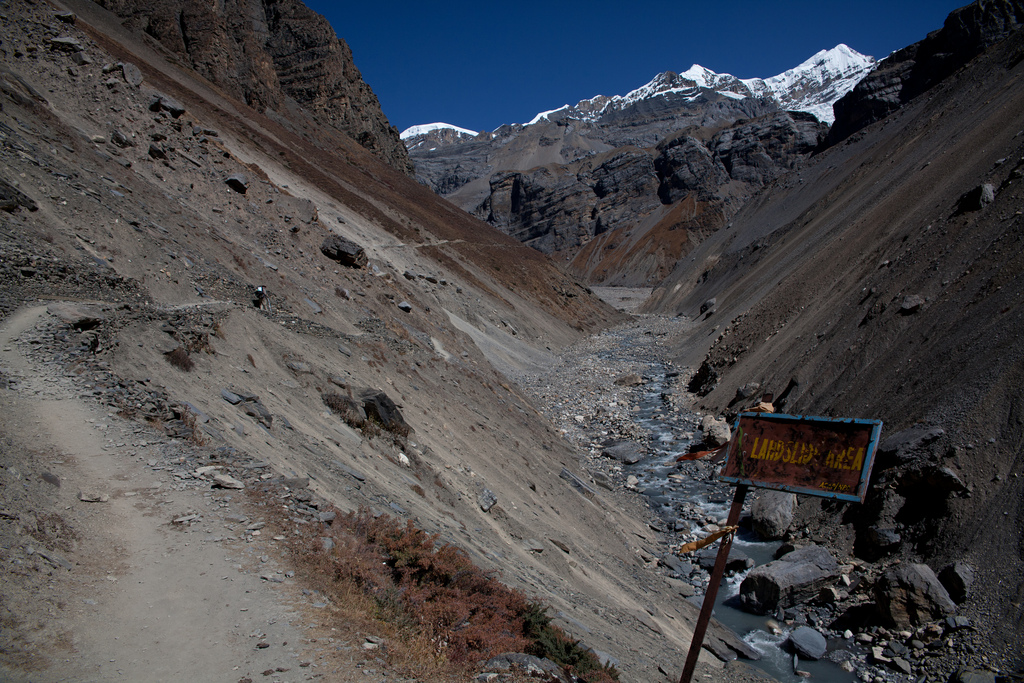
If you’ve ever had the pleasure of visiting high mountains such as the Himalaya, you’ll have noticed how common landslides are. A recent scientific paper seeks to quantify how their frequency relates to other factors.

Larsen & Montgomery from the University of Washington, studied the  Namche Barwa area in the eastern Himalayas. This is an area where rocks are being  brought to the surface extremely quickly by high rates of erosion. The mighty Tsangpo-Brahmaputra river flows through the area and its influence may extend deep into the earth, creating a tectonic aneurysm.

A river only directly erodes within a tiny area, but has a wider influence.  Our authors start by describing the threshold hillslope paradigm. This is a concept three year old children understand: if you dig a hole in a sand pit, once the edge reaches a particular steepness, sand slides back into your hole, no matter how fast you dig.  Within a mountainous area, if erosion rates are high enough, hill slopes are limited by the material strength of  the rock.

“Vertical river incision into bedrock is thought to over-steepen hillslopes with gradients near the threshold angle, increasing relief until gravitational stress exceeds material strength and bedrock landsliding occurs.”

Somewhere like Namche Barwa, with high uplift and erosion rates, we would expect to see lots of landslides. To test this, they used an array of remote sensing data, including declassified spy satellite images, to map more than 1500 landslides over a period of 33 years. By looking at an area affected by differing erosion rates, that found a rough correlation between landslide erosion rate, stream erosion power and even cooling ages of metamorphic rocks. The study area showed an order of magnitude difference in exhumation rate which corresponded with a tiny 3 degree difference in average slope angle.

As well as providing evidence for the importance of landslides, they found insights into the processes. They see a link between large landslide dam bursts (flooding events), and landslides – flooding causes more erosion at foot of slope, destabilises the valley sides and causes a series of small landslides.

Another recent paper by James Spotila at Virginia Tech also derives useful data simply from looking at mountains in detail. He made a detailed analysis of topographical data from mountains across the world.

Browse photo galleries taken in mountains and you’ll find most pictures are of the peaks and mountain ridges – that is where the beauty lies. In contrast models of mountain erosion are (conceptually) peering into the valleys. Ridges and peaks are seen as the consequence of valley-shaping processes, in map view merely the negative image of drainage networks.

Spotila hypothesises that the highest peaks will form where two ridges meet, at ‘divide-junctions’. High peaks are often broadly shaped like pyramids, forming where three glacial or river valleys meet (and therefore where two ridges meet). Peaks of this shape may be mechnically more stable than on single ridges. Using digital topography to study 255 of the world’s most prominent peaks, Spotila finds that 91% of prominent peaks studied are found at divide junctions. Of these, all are pyramid shaped.

The highest mountains of central Nepal contain most of the world’s highest peaks. The Himalayas are cut by a number of large rivers. The high peaks are preferentially located close to the divides between these rivers – the drainage pattern controls the location of the highest peaks.

Once mountains become pyramidal and have flat triangular faces, they become more resistant to erosion. In the Himalaya the flat faces tend not to be covered by glaciers, for example.  This may make them more stable over time. Some workers have talked of ‘teflon peaks’ that rise above the glacial buzzsaw.  Recent models of landscape evolution have emphasised the importance of the migration of drainage divides over time. However if drainage-divide peaks are stable over time, they will anchor the overall drainage patterns, making them much more stable.

These details of the way mountains erode may seem detached from tectonic studies of mountains, but in fact so many aspects of mountain geology are beautifully intertwined. Erosion of mountains influences processes deep within the crust, allowing material to flow towards the surface – patterns of crustal flow are linked to drainage patterns via erosion. That these patterns of crustal flow become fixed in space due to the way peaks and ridges form is a beautiful idea about beautiful places.

claimtoken-50c4761181470

First photo of landslide area, Annapurna region of Nepal, courtesty of Julien Lagarde on Flickr under Creative Commons
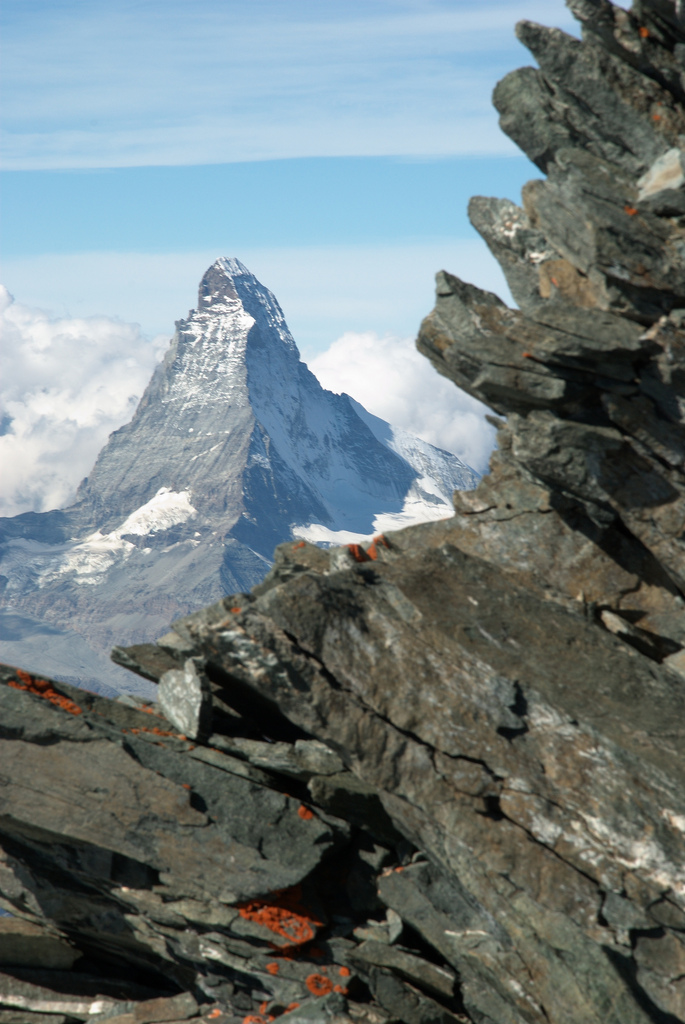
Second photo of Matterhorn, Swiss Alps, courtesy of  Martin Jansen on Flickr under Creative Commons

Larsen, I., & Montgomery, D. (2012). Landslide erosion coupled to tectonics and river incision Nature Geoscience, 5 (7), 468-473 DOI: 10.1038/NGEO1479

Roering, J. (2012). Tectonic geomorphology: Landslides limit mountain relief Nature Geoscience, 5 (7), 446-447 DOI: 10.1038/ngeo1511

Spotila, J. (2012). Influence of drainage divide structure on the distribution of mountain peaks Geology, 40 (9), 855-858 DOI: 10.1130/G33338.1

Seasonal flow of geological learning

‘Big data’ is the idea that the Internet provides organisations with an unprecedented amount of data that deserves new forms of analysis. The more general idea that sophisticated analysis of big data sets is important is quite topical, just ask Nate Silver.

Google have always been good at this sort of thing. They make (some) of their internal ‘big data’ publicly available for all of us to have a geeky play with. One example is Google Trends which shows (normalised) data for the volume of searching on particular search terms. They also split data geographically.

I’ve been playing around and there are some interesting patterns that suggest to me there is a seasonal flow of geological learning. Take a look at this.

[trend w=”600″ h=”400″ q=”Subduction” geo=””]

There is a clear seasonal pattern there. Searches are lowest in the Summer (July/August) and show a clear dip in December. The pattern holds for plate tectonics and other terms too.

[trend w=”600″ h=”400″ q=”continental+crust, oceanic+crust” geo=””]

It seems pretty obvious these correspond to term time in schools and colleges and that most searching for geological terms is done by students. Further evidence comes from Google Correlate, which shows searches terms that are correlated in time. Subduction searches in France and the US correlate with other terms that students with geological assignments are likely to type in.

Some geological words have other meanings of course, look at this.

[trend w=”600″ h=”400″ q=”quartzite” geo=””]

The peak in January confused me, until I looked at the related terms and found out about the large mineral fair in the town of Quartzite, Arizona in January every year. There is a peak for searches for ‘Mars’ in March which is related to that being the French word for March.

My examples are fairly trivial perhaps, but what staggers me is the potential of this sort of data. Another post I’m writing is about recent scientific research based on publicly available ‘big data’ (remote sensing and altitude data). There must be proper scholarship to be done using this Google Trends data, but for me its just an interesting diversion. I leave you with a puzzle, why is the seasonality of ‘photosynthesis’ searches so distinctive? What happens in October and November? Do thousands of biology teachers all start the academic year with the basics of plant biology?

[trend w=”600″ h=”400″ q=”photosynthesis” geo=””]

Earth, moon and Mars: connected by meteorites

The time immediately after earth’s formation is known as the Hadean Eon. It was a time when earth suffered a heavy bombardment from space. Rocks this age on earth are extremely rare, mostly they have been destroyed by later events – eroded, dissolved, melted or smashed. Scientists searching for rocks formed during these hellish times are starting to turn their eyes away from earth, up to the heavens.

At a recent Lunar Science Event, joint between the Geological Society of London and the Royal Astronomical Society I had a marvellous time. Here’s some of what I learnt.

One of my favourite talks was given by Jay Melosh (Purdue University)  who talked about how pieces of planets are thrown off into space and land on other planets. The most unequivocal line of evidence that this happens is the Martian Meteorites – 40 pieces of meteorite that came from Mars but ended up on earth . Dating of these samples suggests 6 ejection episodes, all within the last 20 million years. Magnetic studies suggest that at least some of these samples never reached temperatures greater than 40°C

Apart from Apollo astronauts, the only mechanism that send rock samples through space are large impacts. These are associated with large pressures and temperatures, so how do we explain these samples that were not strongly heated? Numerical modelling, if its very fine-grained, shows that rocks on or near the surface close to the impact are thrown off extremely fast, without being heated. As the shock wave radiates out from the impact site it interacts with the free surface in a process called spallation.

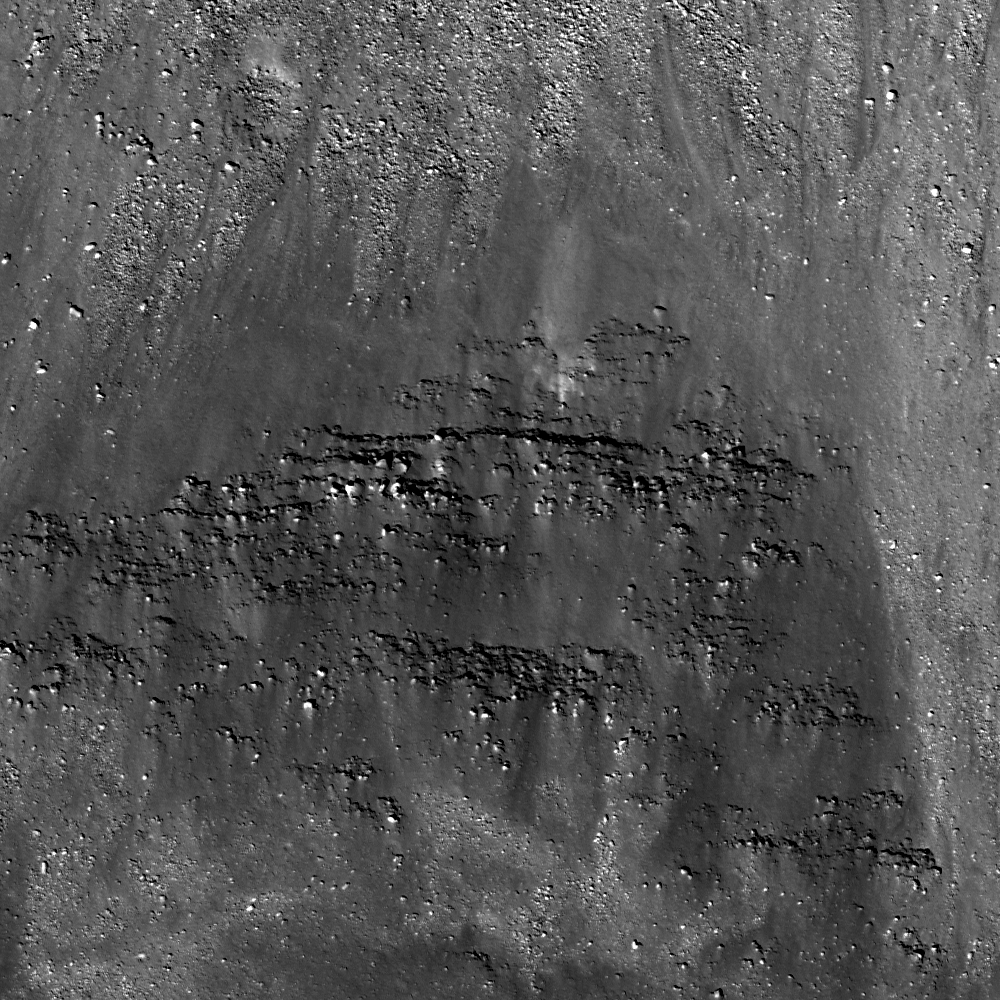
Studies of Martian craters show large sprays of material, up to 1500km from the crater. This material, thrown from the impact can be large enough to form their own craters as they hit the ground again, so called ‘crater secondaries’. It’s a relatively small step to move from throwing material this far to putting it beyond escape velocity and into space. The Zunil crater on Mars is a good example of this and may be a source of earth’s Martian meteorites. The same phenomena is seen on earth – fragments of limestone originally from Germany, near the Ries crater, are found near St Gallen in Switzerland where they were thrown by the impact.

Cluster of Zunil Crater Secondaries

Cluster of Zunil Crater Secondaries. Image: NASA/JPL/University of Arizona

When a probe was due to land on Mars’ moon Phobos , (it never made it), Jay Melosh was asked to model how much Martian material would be on it. They wanted to know if they ought to quarantine Phobos samples in case they contained Martian bugs. The answer was – there would be not a lot, but some.

The clear picture of all this evidence is that impacts on Earth, particularly the early earth when impacts were common, would leave fragments on the moon. Euan Nisbet (Royal Holloway, University of London) gave a whistle-stop tour of the early earth. If pieces of this sit on the moon, we would expect to see zircons (very durable), komatiite lava (olivines with distinctive compositions) and maybe sediments. All very distinctive from lunar rocks.

Dave Waltham (Royal Holloway) talked us through how the earth-moon distance has increased over time. Using an equation created by Charles Darwin’s son and armed with only 3 data points (distance now,  zero at moon formation and data from some awesome 620Ma tidal sediments) he constrained distance over time. The moon was very close very early on, but it reached half of the current distance with 10 million years. So the moon was a closer target for bits of the early earth, but not by as much as we’d thought.

One of the joys of the conference was the variety of scientists on display. This ranged from slick suit-wearing committee-men to wild-eyed, wild-haired ‘crazy scientist’ types. There were geochemists who talked about the difficulty of getting good data points, geologists who showed pictures of rocks “because they are pretty” and astronomers who, while restrained, where keen to link events on earth to astronomical causes.

We also had an experimentalist, Mark Burchell (University of Kent). It is a truth universally acknowledged that a man in possession of a good gas gun must be in want of interesting things to shoot out of it. Things such as lumps of shale, yeast-infused samples and seeds are interesting – firing samples at up to 5 kilometers a second from a ‘two-stage light gas gun’ into sand is a pretty good approximation of a piece of earth landing on the moon. Very interestingly, samples of shale retain their biomarkers, chemicals indicative of life. Yeast and bacteria also survive the impact, making ideas of simple life moving between Mars and earth plausible. Plant seeds wouldn’t survive the journey though, so we don’t need to worry about ‘Day of the Triffids’ style alien-plant invasions. Part of me wonders if Mark Burchell wasn’t a little disappointed that the seeds didn’t survive, removing the need to move onto higher forms of life. He strikes me as a man who’d relish the challenge of firing a flea at cosmic velocities.

Layers of lava visible in lunar crater wall. Image: NASA/GSFC/Arizona State University

Finding the evidence

The phrase “the relatively accessible surface of the moon” is definitely something only a scientist would say. For a Professor of Planetary Science such as  Ian Crawford (Birkbeck, University of London) the moon is our backyard. He spoke passionately about the scientific benefits of a human presence on the moon.

The samples returned by man to the earth (mostly in Apollo missions) are all from low latitudes on the near side. A return mission to the moon should focus on sampling high latitudes and widening our coverage of lunar material.

Ian Crawford has given much thought to suitable areas to explore lunar geology. He has identified the potential of layers between lava flows as repositories of ancient materials. Consider two overlapping lunar lava flows. Chances are there is a layer of material in between the two that landed on the surface during the gap between eruptions. This material could include earth meteorites, ‘normal’ meteorites, samples of the solar wind and more exotic material from the wider galaxy. Preserved by the upper lava flow, the age of the material can be constrained by dating the surrounding lava flows.

Slightly more prosaically, dating of events on all terrestrial bodies apart from the earth is based on cratering rates derived from the moon. The more craters on a surface on Mars, the older it is. Estimates of its absolute age are derived from studies of lunar cratering. Data of more lava flow surfaces on the moon would help refine our understanding of cratering rate over time and so improve dating of events across the solar system.

Katherine Joy (University of Manchester) spends her time studying rock samples from the moon. Some of these are Apollo samples, some are meteorites found on the earth. She’s already found some amazing things such as a meteorite in a meteorite. A tiny piece of rock floating around the solar system landed on the moon and got incorporated into the surface layers (the regolith). Another large chunk hit the moon and fractured the regolith sending pieces hurtling into space. One of these lunar fragments, containing the older meteorite within it, fell to the earth as a meteorite.

A portion of her research is identifying these fossil meteorites in samples of regolith. She has enough data to identify a suite of 3.9 Ga meteorites that are noticeably different from modern-day meteorites found on the earth. This work involves painstaking analysis to identify the individual fragments and analyse their chemistry. She is able to distinguish between fragments of the moon and pieces of meteorite – these techniques would allow her to recognise a piece of rock from the ancient earth. So one day, maybe right now, a scientist in Manchester will jump up in excitement, eager to share the amazing fact that they have before them a sample from earth’s early history, a little piece of evidence that’s survived four billion years and two journeys through space to bear witness to an otherwise lost time.

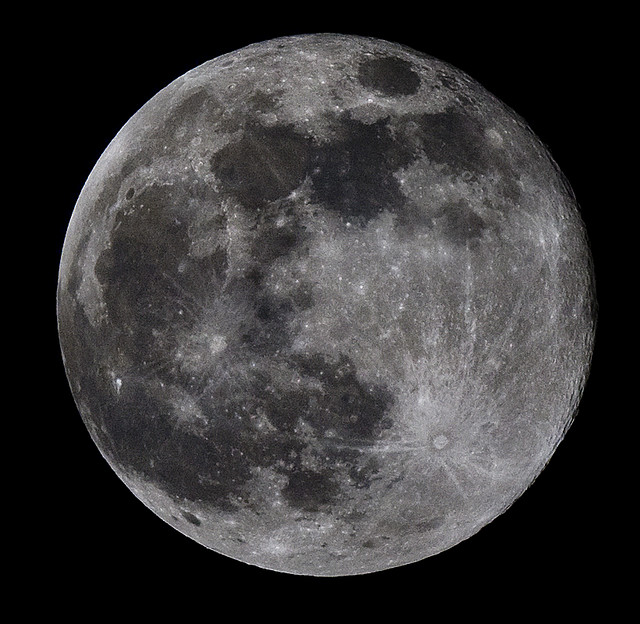
Image of Moon from ‘via moi’ on Flickr

Mantle support of topography – a swell idea

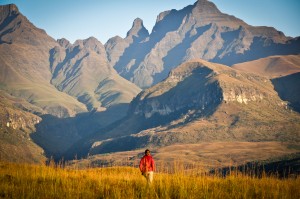
Cathedral Peak area at sunrise - Ukhahlamba Drakensberg National Park, South AfricaWhy are some bits of the earth higher than others? Finding mountains near plate boundaries is easy to explain – various forms of plate collision cause the crust to thicken and the surface to rise. What about Southern Africa?

Reaching a high point of 3473m, most of Southern Africa is a high plateau. It is not tectonically active – the sedimentary layers in the photo are still horizontal – but they are more than a kilometre higher than they ‘ought’ to be. Why?

African swells and superswells

In recent GSL paper, Stephen Jones, Bryan Lovell and Alistair Crosby argue that the topography of Southern Africa can be explained by mantle convection pushing the crust upwards – that flow of the mantle has a direct influence on surface topography. They go onto argue that this phenomena also controls patterns seen in ancient sedimentary basins.

A spot of theory first. On the scale of 100s of kilometres topography is controlled by the properties of the lithosphere – the Tibetan Plateau can be explained this way. But over scales of 1000s of kilometres the lithosphere isn’t strong enough. On this scale, variations in height can only be explained either because the lithosphere is thicker, or because it is being pushed up from below.

Our authors look at Southern Africa and Antarctica, areas far from convergent plate boundaries. Studying the patterns of topography and gravity, they argue that the main geographic features can be explained by dynamic support from mantle convection. So the Drakensberg mountains (pictured above) are high because they sit above a portion of the mantle that is rising, pushing the plate (and the surface) up. The low-lying Congo basin, further north sits above a descending part of the mantle.

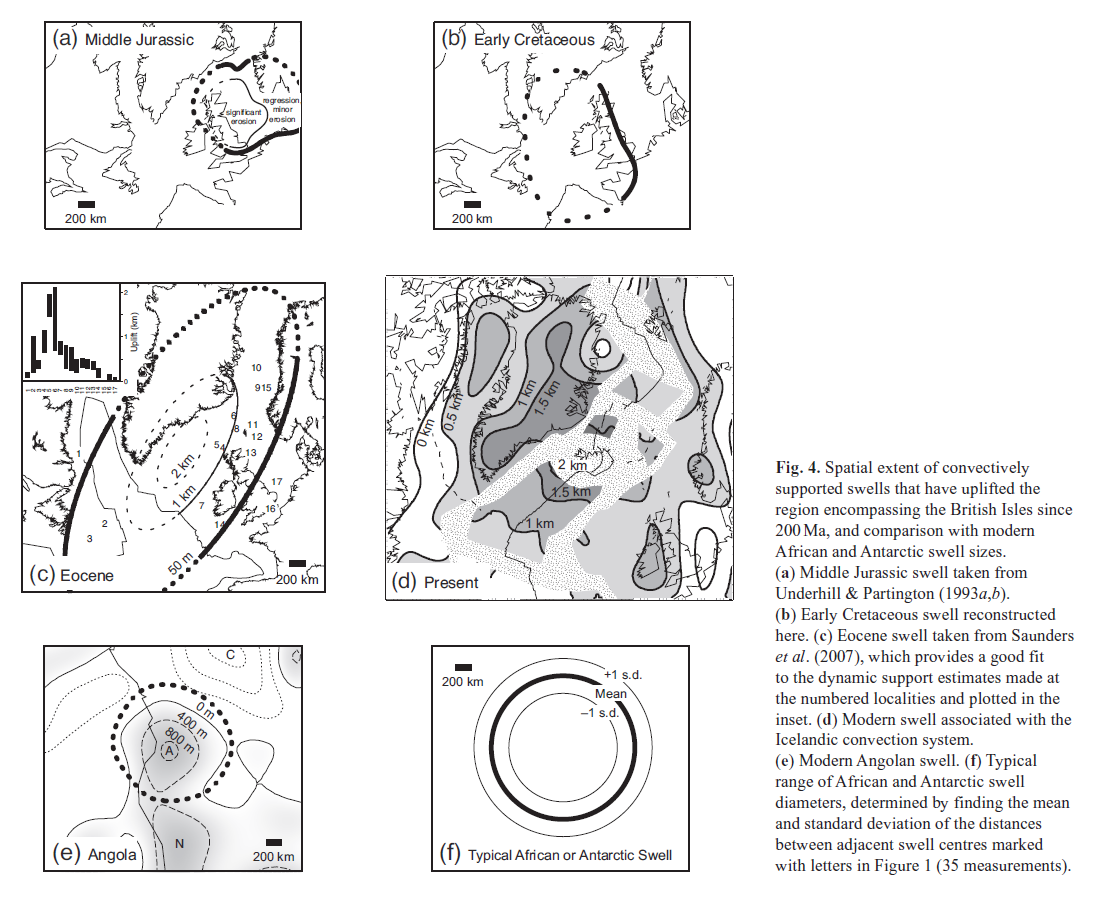
They paint a picture where “thousand-kilometre scale dynamically supported swell topography is the norm for continental regions that are not influenced by subduction zones“, suggesting that areas such as eastern Australia, peninsular India, central USA, east Africa, eastern USA, the Siberian Shield and eastern Siberia are all  affected by similar long ‘topographic swells‘. The African swells they study in detail are around 2000km in diameter and between 1.4 to 2.7km in height.

This is a tremendously important idea, suggesting that the broad patterns of the landscape can be explained by slow movements of rock deep under the surface. Patterns of convection within the upper mantle subtly change the shape of the earth we stand on. More, there is talk of an Southern Africa superswell, over 10,000km in size. A long wavelength warping of the earth’s surface that the other swells sit on and which could be partly supported in the lower mantle.

One of the beautifully elegant things about earth sciences is the way we discover that apparently unrelated aspects of the earth are linked. Discovering such a linkage provides insights into both things simultaneously. So, discovering that topography is related to mantle convection gives you new ways of understanding both. For example looking at sedimentary sequences sitting on these African swells allows us to work out how long the swell has existed for (40 million years). This in turn is an insight into the timescales of convection within the mantle hundreds of kilometres under the surface.

To the UK

The concept of dynamic topography is not new to this paper, (there was a conference about it last year), it adds importantly to the debate by quantifying  both modern day swells in Africa and ancient swells in sedimentary basins.

The UK, Ireland and associated oceanic basins make up a stable piece of crust with a long sedimentary record. There is a long and successful history of hydrocarbon exploration in the area, so there is lots of data to draw on. Our authors describe four swells from this area in the last 200Ma, active in the Jurassic, early Cretaceous, Eocene and present day (based on Iceland).

Figure 4 from Jones et al 2012. Reproduced under Geol Soc fair use policy

The evidence presented suggests that these ancient swells are similar in dimensions to present day African ones and formed over similar timescales, growing in 5-10Ma and decaying over 20-30Ma.

A fail for Vail?

The effect of these swells on sedimentary sequences is dramatic – a kilometre of uplift turns a sedimentary basin into an area of erosion. Dynamic support is not just of interest to students of the mantle, but also to lovers of sedimentary basins or those who seek the oil and gas found therein.

It’s been long understood that patterns of sedimentation are controlled by tectonic factors (creating holes with extensional or foreland basins) and by sea-level changes. In the 1970s, the work of a group at Exxon led by Peter Vail transformed the study of sedimentary basins. Their new techniques of sequence stratigraphy showed that patterns of sedimentation are best explained by different cycles of changing water depth (relative sea-level). The level of water within a typical sedimentary basin is constantly changing on both high and low frequencies.

Note that this relative sea-level change can be caused either by moving the surface of the earth or moving the surface of the water. Vail ‘chose’ to move the surface of the water and sought to explain local patterns in terms of global “eustatic” sea-level change. During periods of glaciation there is a plausible mechanism for doing this and the model is successful (for example, the Carboniferous of the UK). A longstanding problem is how to create cycles of sea-level if there are no ice-caps to vary in size and periodically change the volume of sea-water.

In his 2010 Presidential Address for the Geological Society of London, Bryan Lovell challenges the Vail hypothesis asserting that “mantle convection provides an alternative, regional, mechanism to eustatic control for explaining medium-frequency to high-frequency sea-level cycles“. Relative sea-level changes can be explained by moving the surface of the earth in a particular area. Over a mantle swell, basins will be shallower or stop being basins even if global sea-level remains constant.

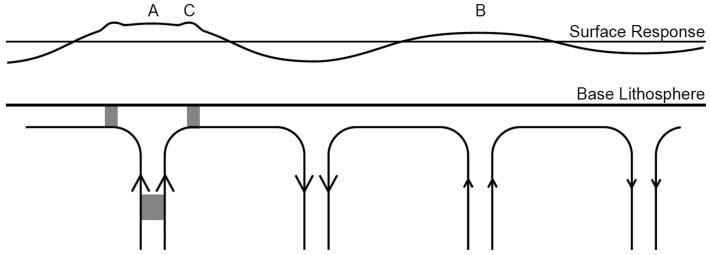
Figure 2 from Lovell 2010. Reproduced under Geol Soc fair use policy

Lovell proposes a mechanism to explain the different frequencies of cycles. Mantle swells, created by convection cells, work over the 10-40 Ma timescale. He proposes that ‘hot blobs’ (grey patches above) move within the wider cells. The blobs cause their own smaller scale (and faster moving) ‘mini-swells’ that explain the higher frequency patterns seen in sediments.

What I like best about the idea of dynamic mantle support of topography is that it is testable. By starting to quantify the time and length scales of mantle swells it becomes possible to recognise them reliably in the stratigraphic record. Changes due to global sea-level variation will be correlatable across many basins whereas mantle swells will not.

Its another way of thinking about the earth, too. As someone living on a tectonically quiescent patch of the earth I’m used to thinking of nothing much happening here until the Atlantic starts to close again. It turns out that “there is no such thing as a stable continental platform” and that a change in the way rocks are flowing deep below could move Britain up or down by a kilometre within as little as 10 million years.

References

Picture of Drakensburgs via Palojono on Flickr under Creative Commons.

Jones, S., Lovell, B., & Crosby, A. (2012). Comparison of modern and geological observations of dynamic support from mantle convection Journal of the Geological Society, 169 (6), 745-758 DOI: 10.1144/jgs2011-118

Lovell, B. (2010). A pulse in the planet: regional control of high-frequency changes in relative sea level by mantle convection Journal of the Geological Society, 167 (4), 637-648 DOI: 10.1144/0016-76492009-127