The Himalayan mountains: flow and fracture

Earth science departments are home to three styles of working, each of which tries to answer similar questions, but from very different perspectives. First we have the field geologists. Armed with field gear and a hammer, they gather data from actual rocks in the form of photos, diagrams and above all maps. Next we have those who live in the lab studying rock samples using mysterious machines to gain startling insights. Finally those who seek to recreate the world in a computer, building models to understand the underlying equations that can explain how the earth works.

In some departments the very different cultures and mental models that these approaches require can lead to conflict. But the best science is done when they are combined, in a department, research group or even a single brain. A recent paper by lead-author Andrew Parsons weaves together different techniques to provide a coherent model of how rocks flow to build huge ranges of mountains.

Different ways to build a mountain range

The Himalayan mountain range is the best place to study how mountains form. Sixty million years ago the Tethys ocean sat between the Indian plate and the Asian. Soon the Tethys oceanic crust vanished down into the mantle beneath Asia and the Indian plate collided with Asia. At the site of that collision now sits the highest mountains on earth, plus the huge and high Tibetan Plateau.

Geologically the Himalaya are long (over 2000km), thin and consistent. From Kashmir and Ladakh on the Indo-Pakistan border, through all of Nepal and further East through the Buddhist kingdom of Bhutan the same sequence of rocks is seen. Starting from the undeformed Indian Plain and walking up, we pass through the sub-Himalayan zone, through the Lesser Himalayan Sequence (LHS), the Greater Himalayan Sequence (GHS) and finally the Tethyan Himalayan Sequence (THS).

These distinctive packages of rock are separated by major faults. Sudden movements on these faults cause the major earthquakes that regularly affect the people who live in this beautiful part of the world. Early models for how the mountains formed focused on these thrust faults. We saw mountains as thick piles of slabs of rock, separated by brittle faults.
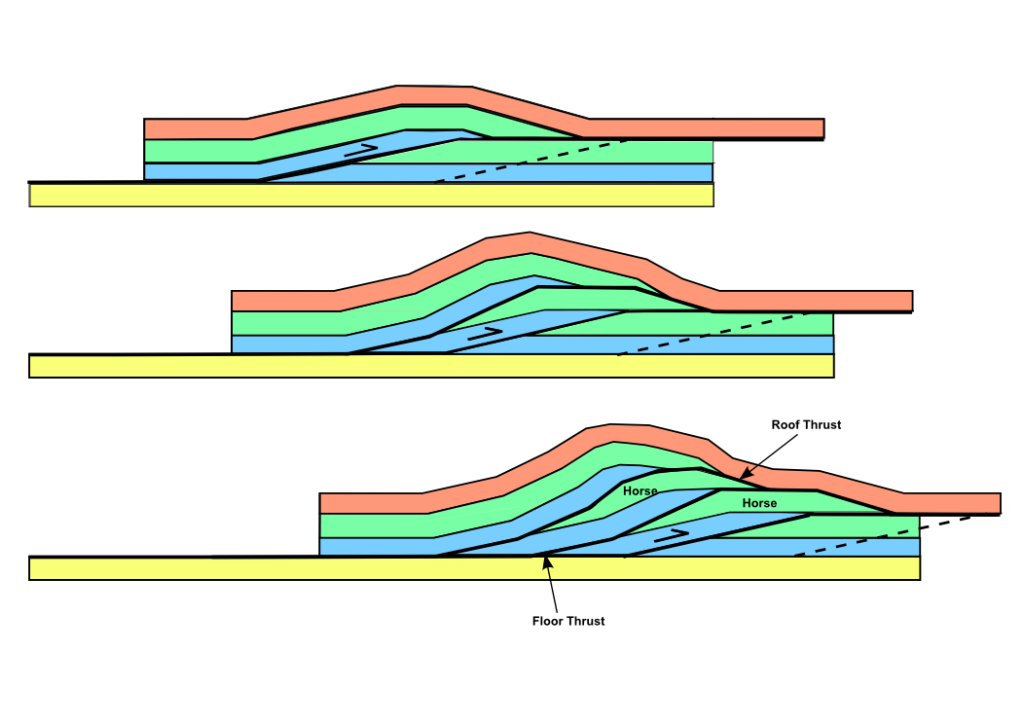
Thrust faults stack up layers of rock. Image from Wikipedia

Thrust faults stack up layers of rock. Image from Wikipedia

In these models deformation is focused on the thrust surfaces and the rocks in between are relatively strong and rigid. This is a reasonably good description of the rocks of the LHS. However studies of the GHS rocks showed them to have been strongly deformed at high temperatures. Intrusions of granite are common and appeared to form while the GHS rocks were deforming and moving rapidly towards the surface. Also the fault between the GHS and the barely deformed sediments of the THS is a normal fault, one with an opposite sense of movement to the thrust faults.
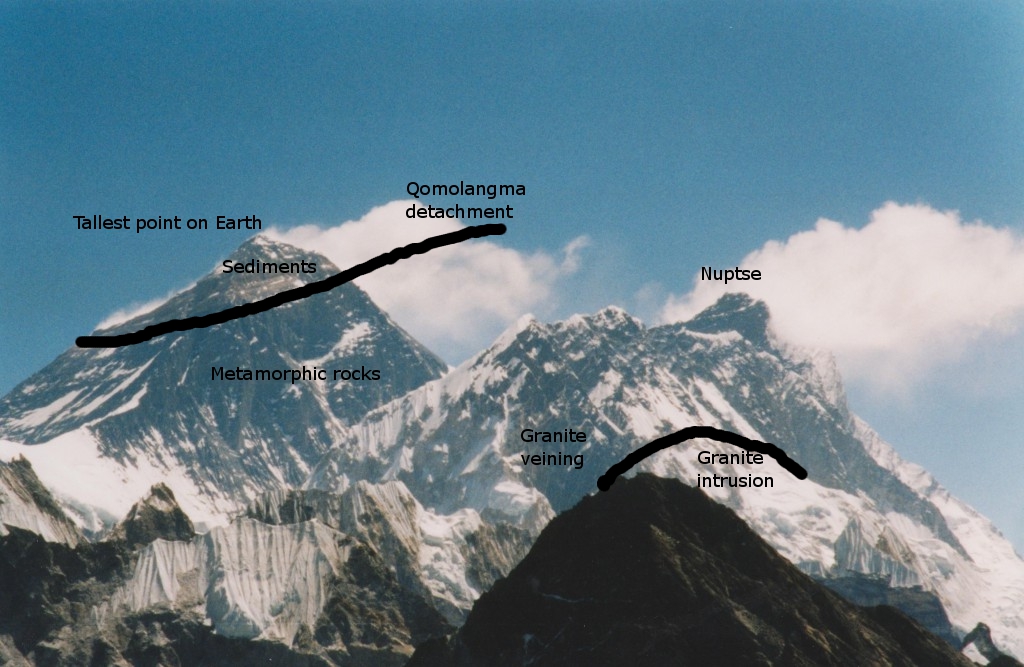
View of Mount Everest, with

View of Mount Everest, with sediments of the Tetyhan Himalayan Sequence forming the summit and metamorphic rocks of the Greater Himalayan Sequence below

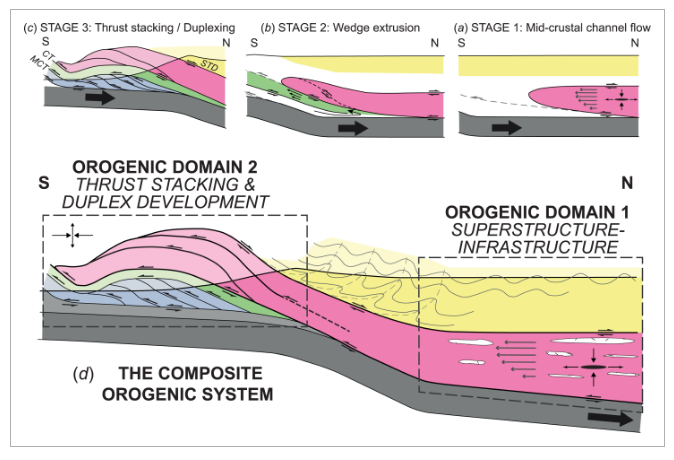
To explain these features, the concept of ‘channel flow‘ was borrowed from fluid dynamics. This describes how viscous fluids flow when trapped in a channel between two rigid surfaces (think of jam/jelly squeezed out of an overfilled sandwich). We know that hot rocks deep in the earth can flow (slowly!) even while remaining solid. The channel flow concept saw the GHS rocks as flowing out from underneath the Tibetan Plateau towards the surface, perhaps moving into the space created by rapid erosion of the high Himalayan mountains.

An alternative model for explaining the hot and deformed GHS rocks is called wedge extrusion, where deformation on thrust faults brought it to the surface, rather than channel flow.

These three models are often seen as being mutually exclusive. But what if all were true?

Going with the flow

Andrew Parsons work is based upon his PhD studies at the University of Leeds in England. He’s published a map of the Annapurna region of Nepal, covering all the main sequences of rock and so is at home in the fieldwork tradition of the Earth sciences. No doubt he has pictures of himself in field gear, looking sun-burnt and grinning in front of some amazing scenery. At the core of his prize-winning paper is hours and hours of lab-work. After wielding his hammer to collect over 100 samples in a transect across the Himalayas, he had them cut by a diamond saw into thin sections to have their secrets probed.

His studies used an optical microscope (to get a sense of this, check out #thinsectionThursday on Twitter) and also a scanning electron microscope. The goal was to identify precisely how the minerals in the sample were squashed.

Rocks are made of minerals and the way they flow is by deforming those minerals. We know a great deal about the many ways common rock forming minerals (like quartz, feldspar, calcite) deform. There are a range of different ways in which the minerals deform. Minerals are crystalline; the atoms within are aligned in consistent repeated patterns. Slow movement of atoms along particular slip-planes or the propagation of defects change the shape of the mineral and so deform the rock. The mineral structure is complicated and different planes of slip are favoured depending on the temperature. Careful study of subtle patterns in the minerals, plus measurement of the average orientation of the atomic structure in each grain tells a great deal.
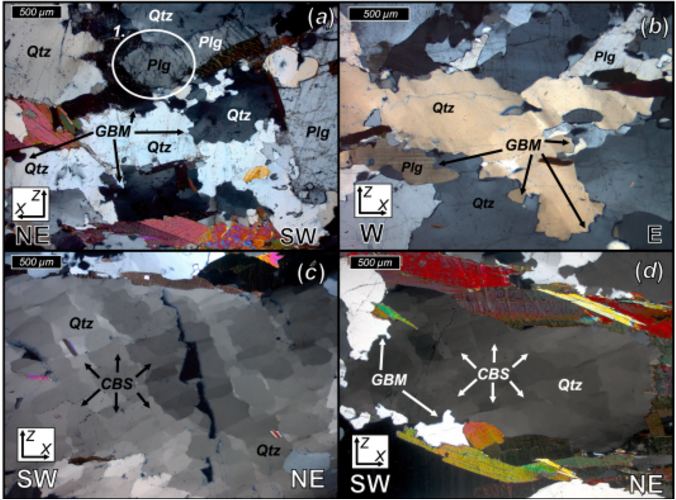
A portion of figure 6, showing different microscope images of rock samples, with different features highlighted.

A portion of figure 6, showing different microscope images of rock samples, with different features highlighted.

For each sample, the authors were able to estimate the temperature at which the rocks were deformed. Also they got a sense of the style of deformation. Imagine a perfect sphere in a rock that is then deformed. Rocks can be flattened turning the sphere into a cow-pat or M&M shape or maybe stretched into a cigar shape. As well as this, the deforming sphere can also be rotated. A combination of field observations, thin section studies and the scanning electron microscope work together gives a view of how the rocks were squashed.

Bringing it all together

The core achievement of this award-winning paper is linking the mass of data to the predictions of the various tectonic models.  Channel flow is predicted in the GHS rocks while they were hot and rapidly flowing. The entire channel should flow and rotation only be seen at the edges. This is what the samples from the upper section of the GHS show, plus an indication that this style of deformation ended while they were still at 550°C and changed from being hot and soft to being more rigid.

At this point channel flow ceased and another mechanism, rigid wedge extrusion, came into play. Here the lower portion of the GHS was deforming at a lower temperature. As the model would predict, deformation involves a lot of rotation, consistent with the whole of this sequence of rocks acting as a broad shear zone, bringing the upper GHS rocks  closer to the surface.

The lowest temperature deformation is found in a thin zone of rocks within the lower GHS that were acting as a thrust fault, stacking up different slices of rock.

Figure 12

Figure 12

This diagram emphasises the key insight – that different ways of building up mountains can be active at the same time, within different parts of the mountain belt. The mountain building (orogenic) system is composite, made up of different parts. Studying individual mineral grains helps us understand the structure of a massive mountain range. This is because that is how it grew. Countless millions of mineral grains slowly shuffling their atomic lattices over millions of years: this is what builds mountains.

The system is still active, as India pushes into Asia. We know from geophysics that there are hot rocks under the Tibet – perhaps these are right now flowing to the surface as a channel. As the Himalayas are eroded away they will get nearer the surface and start cooling, causing different styles of deformation to come into play.

The terminology of ‘superstructure/infrastructure’ used in this diagram is taken directly from computer modelling work. Numerical models of how mountain belts might work have directly informed this work. Cold rocks near the surface can be a lot stronger than the hot rocks below. By combining computer modelling with field work and lab studies, geologists are getting a good understanding of how the Himalayan mountains formed and have evolved over time. Many places are built on the roots of ancient mountain ranges and high-quality integrated studies such as this help us understand rocks across the world.

Parsons, A. J., et al. “Thermo‐kinematic evolution of the Annapurna‐Dhaulagiri Himalaya, central Nepal: The Composite Orogenic System.” Geochemistry, Geophysics, Geosystems 17.4 (2016): 1511-1539.

Speed of metamorphism: cooling down

A while ago, I asked Twitter for suggestions of topics for future posts. A great one came from Brian Romans, a Prof at Virginia Tech and a long-standing pillar of the online geoscience community:

This post follows on from my discussion of how quickly metamorphic rocks heat up which discussed an old conceptual model of metamorphism being caused by slow, gradual processes building mountains and heating the rocks inside. A more modern understanding shows that metamorphic events can be extremely fast, driven not by slow conduction, but rapid (even catastrophic) pulses of hot fluid or pressure.

Let’s think what happens next to the mountains in the old gradual conceptual model. They are slowly but surely brought low by erosion. Grain by grain of quartz or mica bidding farewell to their long-standing neighbours and heading off on an headlong tumbling adventure down a river to the sea. As the hills and mountains are laid low, once deeply buried metamorphic rock slowly emerges, cooling as it heads towards the surface over tens of millions of years.

Turns out, if you actually date the age of metamorphic rocks at the surface in modern mountain belts, they can be a lot younger than expected. Just as it doesn’t necessarily take millions of years to create a metamorphic rock, so they can reach the surface in double quick time.

How to date cooling

How do we know this? If you’re in an active mountain belt such as the Himalayas and you have a metamorphic sample in your hand, that’s already one piece of data – it’s at the surface and cool today. Date the age of the metamorphic event and estimate it’s temperature and you have a second data point. Those two together may be enough to demonstrate rapid cooling. But more data is always good. Luckily radiometric dating can really help us here.

Whenever geologists quote an absolute age1 for something, they are referring ultimately to an estimate derived from our understanding of radioactive decay. Certain elements (most famously Uranium) are unstable and their nucleus can fracture into pieces. Some of these pieces may be small and fast-moving – they make up the radioactivity that can be so dangerous – but there are larger fragments of nucleus too, which tend to stay put and are called ‘daughter elements’. They are the products of natural alchemy and form atoms of new different elements. The rate at which this radioactive decay occurs is steady and unchanging, perfect for a clock. Simply put2 if you measure how much there is of both the radioactive substance and its daughter, you can calculate the age of something. This is geochronology.

For us today, the key concept here is that ‘something’ we are dating the age of. Often we seek to find out the age at which a mineral grain grew, either in a metamorphic rock or crystallising from a magma. This works if the mineral acts as a closed system – once the grain is formed, nothing comes in or out. If instead some of the daughter element has left the system, then the date measured is ‘wrong’ – it doesn’t tell you the real age of the mineral. However, since the mineral becomes a closed system when it cools below a particular temperature3, careful measurements can give you the date when the mineral cooled below that temperature. This is therefore a new independent data point in the rock’s history of cooling. This is the principal behind the technique of thermochronology.

Different minerals, and different pairs of elements become closed at very different temperatures. Many common minerals are used to determine radiometric dates: biotite; muscovite and other white micas; various feldspars; garnet; calcite; apatite. The spread of closure temperatures is from around 1000°C (for Zircon) down to 70°C (for Calcite)4.

This gives us a very powerful tool kit. Different minerals in the same rock may give different ages, each dating a different stage in the rock’s cooling history.

Irish rocks are cool and once they were really hot.

Let’s move to an example of how thermochronology can give insight into how fast metamorphic rocks cool. It comes from a recent paper by Anke Friedrich and Kip Hodges focusing on Connemara in Ireland, (my old PhD field area). The paper cites my research, which immediately makes me think well of it.

master.img-006

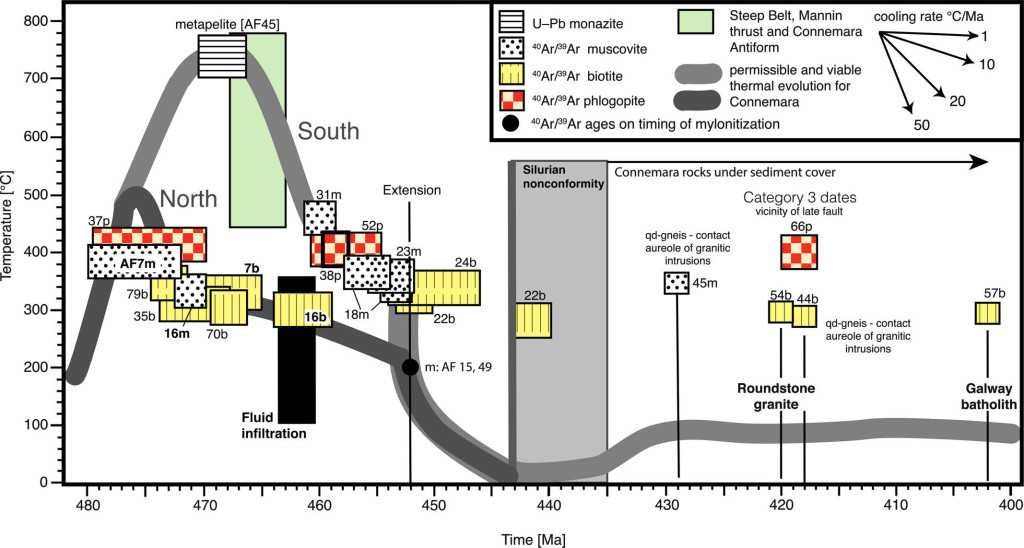
Figure 7 from Friedrich and Hodges (2016), showing the range of thermochronological dates and the contrasting T-t paths across Connemara.

This figure is the core of the paper. Each box is a different thermochronlogical measurement, plotted against time and Temperature.  Different coloured boxes are different types of systems. Even the same colour of box can be at a different temperature because these estimates include also a consideration of the size of the mineral grain. The data is superficially rather noisy, and could be taken to indicate a slow cooling history, but the geology of the area is extremely well known, allowing distinct 3 sets of dates to be identified.

Those defining the dark line – labelled North – show a brief period of heating and then cooling. The south of Connemara was the site of igneous activity for much longer than the north – the later cooling is clear from the data. Data points from the right hand side of the graph are associated with heating from much later granites.

Scream if you want to go faster

Prof. Romans is a sedimentary guy and interested in metamorphic rocks as something that ends up as a layer of sand or mud. Linking metamorphic rocks to sedimentary ones means tracing out one of those great big linked cycles that make earth science so mind-expanding. My favourite example – good evidence for what went on deep in the Himalayas can be found in sediments deep in the Indian Ocean. As an aside, for these Connemara rocks we can also trace the point at which they start being eroded and ending up in a sedimentary basin. As a further aside, the grains that were dated from Irish metamorphic rocks can also be found in modern sediments. These studies (detrital mineral thermochronology) can be used to find out where sediment came from or to estimate the  timescales of sedimentary processes. That’s a topic for another time.

Brian Roman’s original question started with asking how fast metamorphosing rocks can be exhumed. Exhumation means the rocks reaching the surface – like digging up corpses only much much nicer. This is linked to a rock’s cooling history as in order for a metamorphic rock to cool significantly and quickly it needs to get nearer the surface. Metamorphic rocks may form in unusually hot parts of the earth but the fact that the earth gets hotter the deeper you go is the main control. Places where rocks are exhumed quickly must be places where the rock above is removed quickly and one way to do this is to erode it away.

The fastest rates of exhumation known are in the Himalayas. Specifically at the eastern and western ends: Namche Barwa in the eastern Himalaya and near Nanga Parbat in the west. Here rocks are being drawn to the surface so fast that 25km of rock has been eroded in the last 10 million years. Given that the Himalaya are around 50 million years old and on average 5 kilometres high, this is quite amazing.

The likely reason for such rapid exhumation is that these points are where massive rivers, full of glacier melt from the Tibetan plateau and Himalayas, cross the Himalayan mountain range. The rivers cut deep down into the earth and soft hot rocks flow into the space created (more detail here). The Himalayas and the Tibetan Plateau cause the Monsoon which drives rain-clouds north from the ocean to feed Himalayan glaciers. Melting glaciers fill the rivers, which cut deep into the earth and drive a flow of rock from kilometres under the ground, up to the surface where it is turned into sand and mud that flows back down into the ocean. There it forms sedimentary rocks, that one day may be buried and be turned back into a metamorphic rock. There are so many cycles in geology and so many links between them.

In the first post in this series we learned that the formation of those beautiful metamorphic minerals paraded on Twitter every #thinsectionThursday is less like the slow transformation of dough baked into bread but instead more like the sudden explosive transfiguration of a hard kernel into tasty pop-corn5.  In this post we’ve learned how we know how quickly rocks cool. This can be slow, like letting a roast chicken rest before carving but other times it’s like popping some morsel straight from the fryer and onto your plate

Speed of metamorphism: heating up

Published in the 1830s, Charles Lyell’s ‘Principles of Geology‘ is one of the founding texts of the subject. Part of a generation of Geologists who broke free of Biblical interpretations of the natural world, Lyell was working in an intellectual context seeking to move beyond explanations based on Noah’s flood. The true causes of the earth’s rocks were sought not from sudden catastrophes but instead from slow, gradual processes such as those seen acting upon the modern earth. Lyell expressed this as Uniformitarianism, popularising a concept first expressed by James Hutton.

Such ideas were tremendously powerful and became baked into the way geologists thought. But one of the themes of the last 30 years has been the recognition that sudden events can be important in earth history and that gradual change doesn’t explain everything. The most dramatic example involves vaporised dinosaurs, but the trend is seen even in the less glamorous world of metamorphism.

Mix thoroughly then bake for 50 million years

Metamorphic rocks are often found in discrete areas called belts which are typically highly deformed. The conditions of metamorphism vary across the belts, different zones of rock contain different minerals. A common form of metamorphism is called Barrovian and a neat explanation of it came from a 1984 paper that has since been cited 1489 times. In it, England and Thompson performed some simple modelling of crust affected a collision between two continental plates. The models recreated the Himalayas by first using thrust faults to stack the crust up thick and then waiting for temperatures to reach equilibrium – a process called thermal relaxation, involving slow heating of the buried rocks. The conditions experienced by rocks in the model (expressed in terms of their P-T-t paths) closely matched the conditions estimated from actual metamorphic rocks. Thermal relaxation for thickened crust takes around 50 million years, making it a gradual, Uniformitarian process. Form mountains and you form metamorphic rocks. Slowly.

Back in the 1980s our view of the original Barrovian rocks in Scotland was that they were deformed in the Caledonian Orogeny, that might well have lasted 50 million years. However, as a wrote in a previous post some now distinguish three different episodes of metamorphism within a 50 million year period. Something other than thermal relaxation must be going on.

Very speedy metamorphism

The evidence for their being three distinct metamorphism episodes comes from improved radiometric dating of a variety of rocks (geochronology). This can tell us when a particular mineral grain crystallised from magma, or grew in a metamorphic rock, or cooled below a particular temperature. Combining various data points allows us to measure how long a phase of metamorphism lasted. Another slightly different approach is to use diffusion geospeedometry. This technique relies on our understanding of how quickly different elements move through mineral lattices and how this varies with temperature. Given the right samples, it allows us to estimate for how a long a rock was heated above a particular temperature. There’s more about the details of the technique in this other post on some earlier work. Often estimates from this technique show spikes of temperature that were extremely short-lived, sometimes less than a million years.

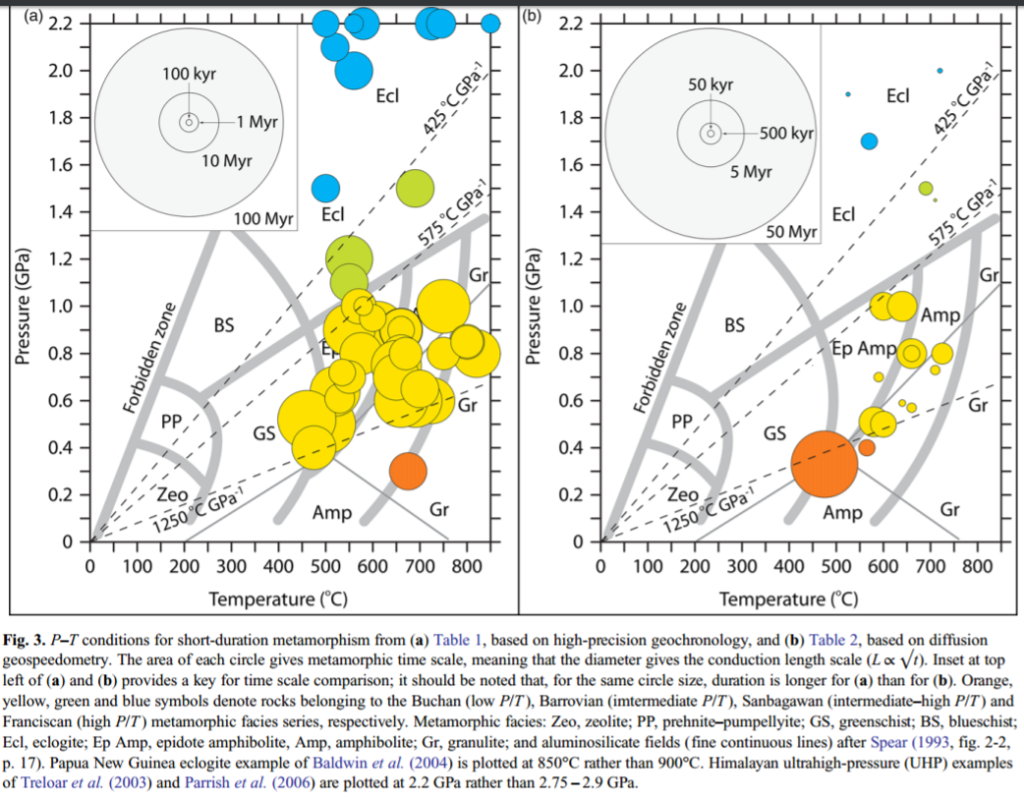
A 2016 paper called “On the significance of short-duration regional metamorphism” by Daniel Veite and Gordon Lister is a fascinating overview of this topic1. He defines short-duration metamorphism as being any event that completed in 10 million years for orogenic events (e.g. Barrovian) and 5 million years for subduction metamorphism. These timescales are chosen so that by definition any short duration event must represent a thermal anomaly smaller in size than the scale of the crust or lithosphere. It’s over before there is time to heat the entire crust meaning that the thermal relaxation concepts of England and Thompson cannot explain it.

The paper summarises instances of short-duration metamorphism as discovered either via high-precision radiometric dates or through diffusion geospeedometry.
short-duration-viete-fig-3

This figure shows a few different things. Firstly, there is a lot of data showing many examples of short-duration metamorphism. These data are taken from rocks around the world and of various different ages (but nothing PreCambrian2). Also note the scale difference. Geospeedometry consistently gives shorted timescales than estimates from high-precision geochronology. Whether this is because they are measuring slightly different things, or because one is more accurate than the other, is not clear at present.

But these are quibbles – two different forms of evidence show that short-duration metamorphism exists. So what causes it and what does it mean?

Flash steaming, not baking?

England and Thompson’s model shows only the effects of conduction and how it slowly transfers heat around the crust. Advective heat transfer instead is caused by the movement of hot fluids (water or magma, most likely) and it can happen extremely quickly.

The concept of metastability is key to metamorphism. The simple act of viewing high-grade minerals indicates that those minerals remained stable under different metamorphic conditions (as it cooled). Perhaps geospeedometry is measuring only a short instance of mineral growth in rocks that were slowly heated but where metamorphic reactions where suddenly triggered by a brief pulse of advective heating.

Figure 5 of Viete and , showing

Figure 5 of Viete and Lister, showing how a measurements of short-duration metamorphism way record only a short spike over a longer term heating trend.

The same effect may apply if a gradual long-duration heating event is associated with spikes of heating. As show in the diagram above, we may be measuring the duration of a little red spike using geospeedometry and must be careful not to overinterpret it.

If metamorphic minerals often grow due to transient small scale events, maybe our understanding of metamorphism is faulty. Perhaps metamorphic zones don’t tell us what the steady state condition of the crust is and are less useful than we thought.

One final thought, perhaps temperature isn’t the driver? Recent ideas suggesting that tectonic overpressure is significant raise the possibility that sudden changes of overpressure may be driving rapid metamorphism.

What next?

Viete and Lister’s paper is a review of an exciting area of metamorphic petrology. They summarise convincing evidence that many metamorphic events are of short-duration. The growth of many metamorphic minerals can be seen as more a brief catastrophe than a slow gradual event. It ends with a clear call to action:

Techniques in very high-precision petrochronology that are capable of resolving short- and even extremely short-duration metamorphic activity exist, but are yet to be applied in combination to a single set of young rocks. Such work represents a crucial next step for metamorphic geology

An example of what they have in mind can be found in Veiete et. al (2015). This highlights a technique that allows accurate measurements of the age of small areas of zircons. It’s long been known that thin rims of younger age exist on zircons, but previously they’ve simply been removed so the older bigger core can be dated. The ability to date thin layers of zircon directly adds to the information we can gather. For young rocks (Cenozoic) this technique allows events can be measured to within a million years. Bring all this together with the right rocks (young and showing short-duration metamorphism) and perhaps we can start getting answers to the questions above.

It’s likely this will lead to some very exciting new work in the next few years. Some parts of the world of metamorphic petrology may be about to undergo a sudden transformation into something new and startling.

References

Viete, Daniel Ricardo, and Gordon Stuart Lister. “On the significance of short-duration regional metamorphism.” Journal of the Geological Society (2016): jgs2016-060.

Viete, Daniel R., Andrew RC Kylander-Clark, and Bradley R. Hacker. “Single-shot laser ablation split stream (SS-LASS) petrochronology deciphers multiple, short-duration metamorphic events.” Chemical Geology 415 (2015): 70-86.


The many metamorphoses of the Moine

In a companion post I introduced you to a metamorphic rock with an apparently simple history. Using traditional geological techniques on this single outcrop can’t reveal the full history of the area, so this post will attempt summarise the latest research. In short1 the more closely you look, the more complicated things become.

The many Phases of the Caledonian

When I was young, things were simple. The metamorphic rocks of the Scottish Highlands, (the Moine and Dalradian) were affected the by Caledonian orogeny caused by the closing of the Iapetus Ocean. A nice simple piece of continental collision with classic Barrovian metamorphism and some splendid deformation. Nowadays, thanks to isotopic dating we know that things are much more complicated. Much much more.

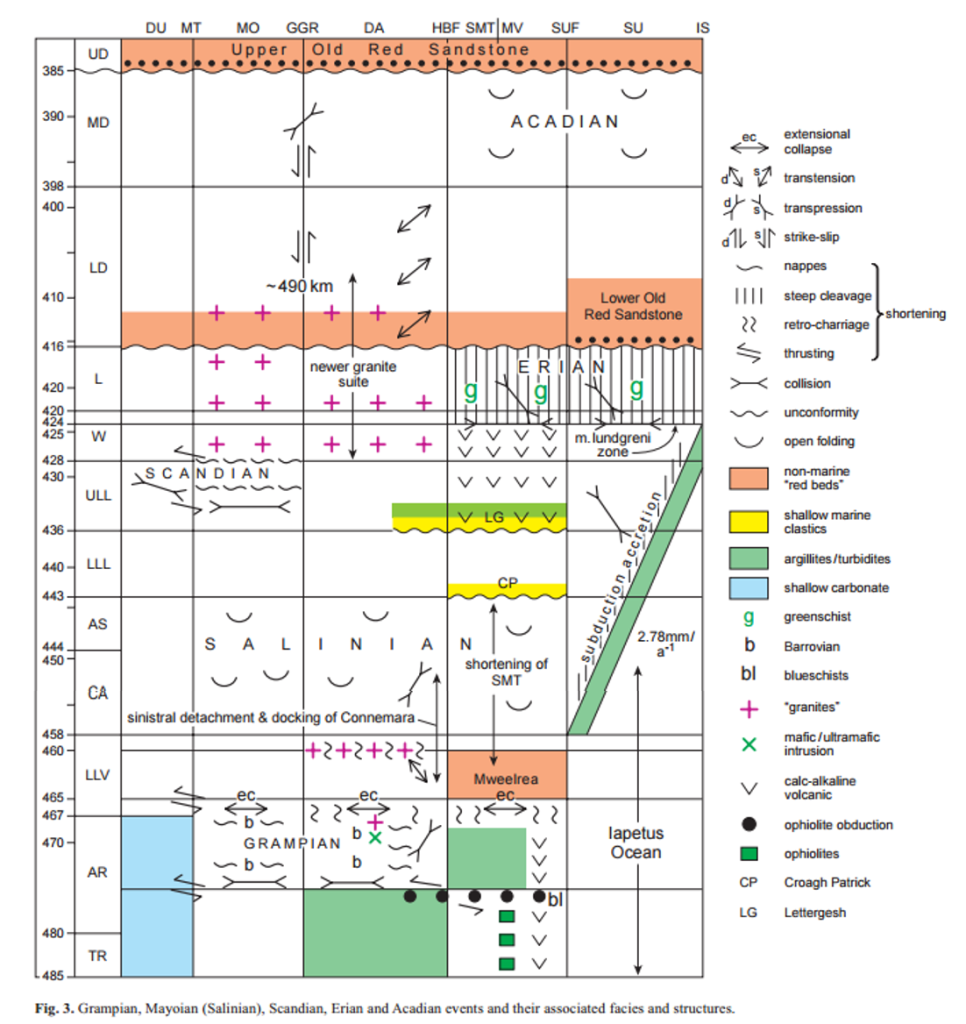
From Dewey et al 2015. Our rocks is from the Moine, which is represented by the second column from the left

From Dewey et al 2015. Our rock is from the Moine, which is represented by the second column from the left

The diagram above represents the latest thinking about what the Caledonian Orogeny consisted of. Instead of a single continuous event we can recognise 3 distinct events each of which is associated with deformation and the growth of metamorphic minerals.

It comes from a paper that is a grand summary covering the entire British Isles. For today, let’s just focus on the second column from left, with Mo for Moine at the top. Start from the bottom and move up in time. First we have the Grampian event around 470 million years ago. It was caused by a collision between the edge of the Laurentian continent and an volcanic arc, with a piece of oceanic crust (an ophiolite) thrown in for good measure. I’ve written about this in detail elsewhere.

The second event, marked in the diagram as Salinian is less well understood. In the text Dewey et al. also call it the Mayoian as the deformation is well represented in County Mayo in Ireland (also perhaps because this was John Dewey’s PhD field area and he’s long been in love with the place). The alternative name Salinian (or Salinic) suggests a link with events of the same age in rocks from Newfoundland (which before the Atlantic was not far away). Dewey et al. speculate it may have been caused by subduction slab flattening (like the Laramide orogen in North America).

Bird et al. (2013) recognises the same event, dating growth of garnets at this time in rocks only about 25 km away from our rock sample. They call the event “Grampian II”, which is less poetic but avoids potentially incorrect correlations with other areas. Their proposed cause is the collision of a small fragment of crust or arc with Laurentia.

The final event is called the Scandian, which represents the final closure of the Iapetus ocean. In this northerly portion of the British Isles, this means a collision between the ancient continents of Laurentia (most of modern day North America, plus a sliver of NW Scotland) and Baltica (the ancient piece of crust that sits under modern day Scandinavia). Further north in the Moine, the dominant deformation fabrics are of this age, including the famous Moine Thrust.

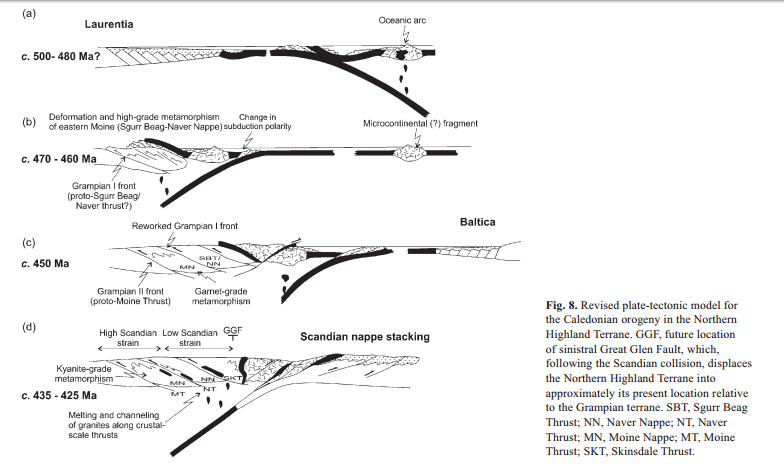
Figure 5 from Bird et al

Figure 5 from Bird et al. (2013) showing plate tectonic cross-sections at various times – b) is Grampian, c) Grampian II and d) is Scandian.

With one eye on the diagram above, lets describe those 3 events in terms of plate tectonics. First the Iapetus ocean opens up. Our rock is on one side, part of a plate called Laurentia. The ocean starts to close, but as it does so if forms an oceanic island arc. Around 470 Ma this collides with Laurentia heating and deforming a bunch of rocks. Twenty million years later, a smaller fragment (maybe like Rockall bank in the modern Atlantic) hits and causes some disturbance. Finally around 430 million years ago the ocean basin closes and messes some rocks up (again).

Which of these events caused the little feldspars to grow in my rocks sample? I don’t know for certain and what’s worse, it might not be any of them – it might be an older event.

When the Iapetus ocean opened at the beginning of my little story, the Moine rocks had already been deformed and heated at least twice before.

Before Iapetus

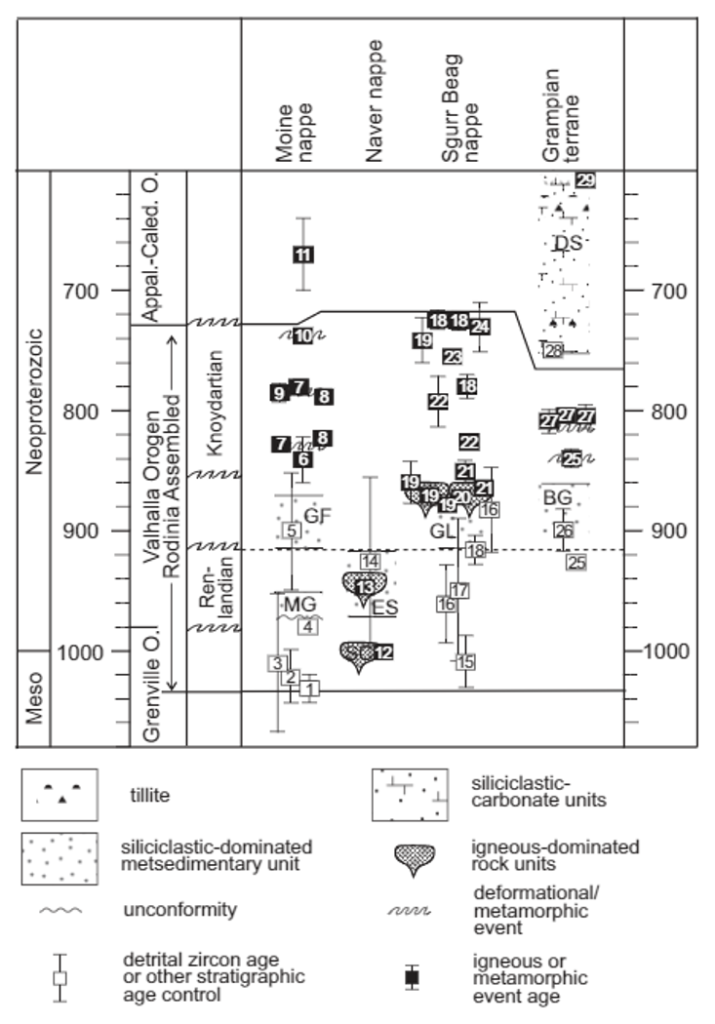
Cawood et al. (2012) is my main source of information here. Let’s cut to the chase and go straight for the summary diagram.cawood-figure

This is a similar diagram to the Dewey one above only it shows the actual dates from individual rocks. Similar dates exist for the younger events, but they are not shown on the first diagram.

I’ve reached my quota of explaining orogenies for the day. Let’s just say that there are two more here (Renlandian and Knoydartian), both poorly understood but both opportunities for my rock sample to have grown its feldspars.

What does it all mean?

What should we make of all this complexity? A few thoughts follow.

Firstly, the practice of correlating metamorphic or deformation events between different areas should be used with care – it can be completely wrong. The dominant fabric and metamorphic event in the northern Moine is Scandian in age, but in places further south it is Grampian II / Mayoian in age, despite looking very similar in thin section. Traditional analysis has correlated the two, but modern dating techniques show then to have formed at different times.

Secondly, if metamorphic minerals grew in the Moine at five different times, why doesn’t my rock show five sets of mineral growth? There are many possible reasons, but most importantly it’s likely that not all episodes affected all of the Moine – with the Scandian for example is possible that my area was too far from the action to be affected. Either geographically or possible because it was too high up in the crust.

It’s possible that later episodes of growth have completely destroyed earlier mineral grains, wiping the evidence away and making the rock’s history look simple. But we only know about each episode because we’ve dated a mineral grain that has remained relatively unscathed since. Rocks nearby still have visible sedimentary features retained so there are limits to how much we can explain this way.

Some believe that metamorphic events may transform relatively small volumes of rock because heating or fluid flow is localised.  Outside of these areas, dry rocks are heated but don’t recrystallise – don’t change. A piece of pottery is a form of metamorphic rock transformed from mud, but heating it up again doesn’t cause a further dramatic change.  Maybe my rock was transformed early on when it was rich in water from metamorphic reactions, but when heated up at a later date, little changed.

A third topic is around structure. There are no complex structures in my rock sample and its outcrop, but the Moine as a whole is a classic locality for refolded folds, which are exactly what you’d expect in an area deformed multiple times. Individual areas may have up to 4 different phases of folding, but the relationship between these and each orogeny is not simple. Bird et al. discuss this topic (about another area) and suggest fabrics or folds may be composite, that “structures may have initially developed as tight to open structures during the Late Ordovician event, and were later strongly modified into their present tight to isoclinal, sheath-like geometry during intense shear associated with Scandian nappe stacking“.

Many of discussions around metamorphism are relevant here as well. Let’s remember the undeformed sedimentary features in rocks nearby. They may now be vertical, but they are otherwise little deformed.

So how old are these blasted feldspars anyway?

Krabbendam et al. (2014), studying Moine rocks not far north of mine regard early structures (D1) as being pre-Grampian and later ones – and the main phase of mineral growth – as being Grampian II in age.

So that’s the most likely answer for my rock. Whatever happened in the pre-Grampian events is lost in the mists of time. Those nice big white feldspars grew and were rotated during the Grampian II event and shrugged off the Scandian event without any visible changes.

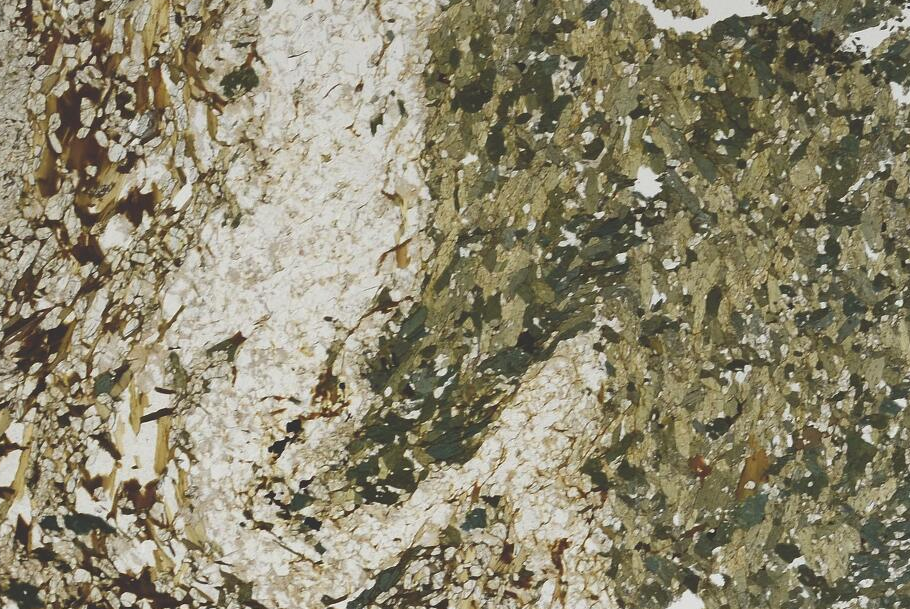
If you are thinking I’ve made this unnecessarily complicated2 I’ll just point that on a hillside visible from my outcrop there are some of the rocks that were the basement on which the Moine sediments were deposited. These ‘Lewisianoid’3 rocks, now ‘inliers’, or strips of gneiss folded into the Moine metamorphic rocks, have experienced all of the events the Moine has, plus three or more others (Scourian, Laxfordian and Grenvillian4). Here’s a thin section of some, with folded banding, but not looking *that* complicated, considering the 8 different events it’s witnessed.

lewisianoid

Life is complicated. Plate tectonics is a continuous process that takes place in three dimensions on a sphere over millions of  years. The fact we can use a bunch of ancient rocks in Scotland to recreate the ancient dance of vanished oceans and transformed continents is a triumph of science, but let’s not be surprised that it is complicated.

REFERENCES

Note that Professor Rob Strachan of Plymouth Portsmouth University is a co-author on nearly all of these papers. His nickname of ‘Captain Caledonides’ is well-earned.

Dewey, J. F., Dalziel, I. W., Reavy, R. J., & Strachan, R. A. (2015). The Neoproterozoic to Mid-Devonian evolution of Scotland: a review and unresolved issues. Scottish Journal of Geology, 51(1), 5-30. doi: 10.1144/sjg2014-007

Bird, A. F., Thirlwall, M. F., Strachan, R. A., & Manning, C. J. (2013). Lu–Hf and Sm–Nd dating of metamorphic garnet: evidence for multiple accretion events during the Caledonian orogeny in Scotland. Journal of the Geological Society, 170(2), 301-317. doi:10.1144/jgs2012-083

Cawood, P. A., Strachan, R. A., Merle, R. E., Millar, I. L., Loewy, S. L., Dalziel, I. W., … & Connelly, J. N. (2015). Neoproterozoic to early Paleozoic extensional and compressional history of East Laurentian margin sequences: The Moine Supergroup, Scottish Caledonides. Geological Society of America Bulletin, 127(3-4), 349-371. doi: 10.1130/B31068.1;

Krabbendam, M., Leslie, A. G., & Goodenough, K. M. (2014). Structure and stratigraphy of the Morar Group in Knoydart, NW Highlands: implications for the history of the Moine Nappe and stratigraphic links between the Moine and Torridonian successions. Scottish Journal of Geology, 50(2), 125-142. doi: 10.1144/sjg2014-002

All diagrams reproduced under fair use policy.