Speed of metamorphism: cooling down

A while ago, I asked Twitter for suggestions of topics for future posts. A great one came from Brian Romans, a Prof at Virginia Tech and a long-standing pillar of the online geoscience community:

This post follows on from my discussion of how quickly metamorphic rocks heat up which discussed an old conceptual model of metamorphism being caused by slow, gradual processes building mountains and heating the rocks inside. A more modern understanding shows that metamorphic events can be extremely fast, driven not by slow conduction, but rapid (even catastrophic) pulses of hot fluid or pressure.

Let’s think what happens next to the mountains in the old gradual conceptual model. They are slowly but surely brought low by erosion. Grain by grain of quartz or mica bidding farewell to their long-standing neighbours and heading off on an headlong tumbling adventure down a river to the sea. As the hills and mountains are laid low, once deeply buried metamorphic rock slowly emerges, cooling as it heads towards the surface over tens of millions of years.

Turns out, if you actually date the age of metamorphic rocks at the surface in modern mountain belts, they can be a lot younger than expected. Just as it doesn’t necessarily take millions of years to create a metamorphic rock, so they can reach the surface in double quick time.

How to date cooling

How do we know this? If you’re in an active mountain belt such as the Himalayas and you have a metamorphic sample in your hand, that’s already one piece of data – it’s at the surface and cool today. Date the age of the metamorphic event and estimate it’s temperature and you have a second data point. Those two together may be enough to demonstrate rapid cooling. But more data is always good. Luckily radiometric dating can really help us here.

Whenever geologists quote an absolute age1 for something, they are referring ultimately to an estimate derived from our understanding of radioactive decay. Certain elements (most famously Uranium) are unstable and their nucleus can fracture into pieces. Some of these pieces may be small and fast-moving – they make up the radioactivity that can be so dangerous – but there are larger fragments of nucleus too, which tend to stay put and are called ‘daughter elements’. They are the products of natural alchemy and form atoms of new different elements. The rate at which this radioactive decay occurs is steady and unchanging, perfect for a clock. Simply put2 if you measure how much there is of both the radioactive substance and its daughter, you can calculate the age of something. This is geochronology.

For us today, the key concept here is that ‘something’ we are dating the age of. Often we seek to find out the age at which a mineral grain grew, either in a metamorphic rock or crystallising from a magma. This works if the mineral acts as a closed system – once the grain is formed, nothing comes in or out. If instead some of the daughter element has left the system, then the date measured is ‘wrong’ – it doesn’t tell you the real age of the mineral. However, since the mineral becomes a closed system when it cools below a particular temperature3, careful measurements can give you the date when the mineral cooled below that temperature. This is therefore a new independent data point in the rock’s history of cooling. This is the principal behind the technique of thermochronology.

Different minerals, and different pairs of elements become closed at very different temperatures. Many common minerals are used to determine radiometric dates: biotite; muscovite and other white micas; various feldspars; garnet; calcite; apatite. The spread of closure temperatures is from around 1000°C (for Zircon) down to 70°C (for Calcite)4.

This gives us a very powerful tool kit. Different minerals in the same rock may give different ages, each dating a different stage in the rock’s cooling history.

Irish rocks are cool and once they were really hot.

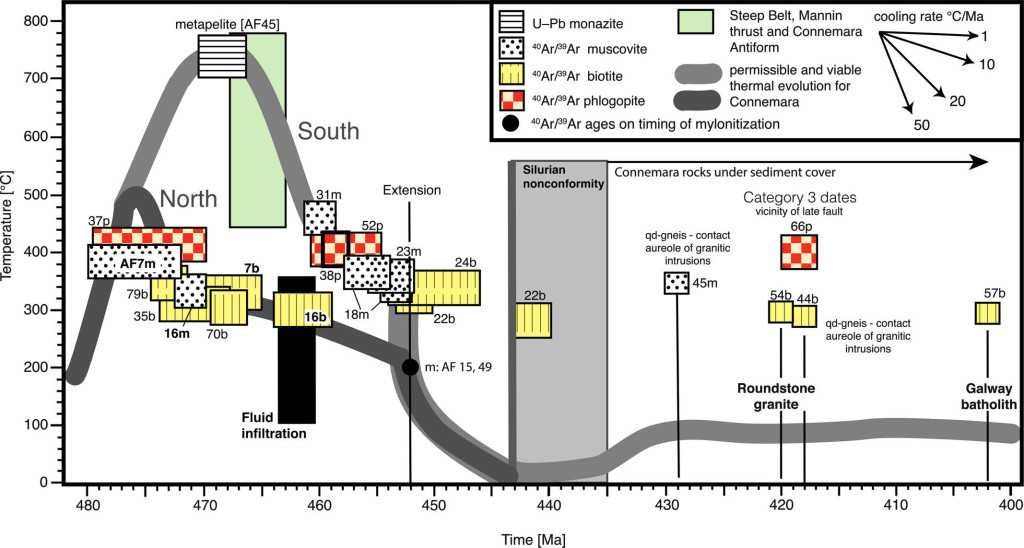
Let’s move to an example of how thermochronology can give insight into how fast metamorphic rocks cool. It comes from a recent paper by Anke Friedrich and Kip Hodges focusing on Connemara in Ireland, (my old PhD field area). The paper cites my research, which immediately makes me think well of it.
master.img-006

Figure 7 from Friedrich and Hodges (2016), showing the range of thermochronological dates and the contrasting T-t paths across Connemara.

This figure is the core of the paper. Each box is a different thermochronlogical measurement, plotted against time and Temperature.  Different coloured boxes are different types of systems. Even the same colour of box can be at a different temperature because these estimates include also a consideration of the size of the mineral grain. The data is superficially rather noisy, and could be taken to indicate a slow cooling history, but the geology of the area is extremely well known, allowing distinct 3 sets of dates to be identified.

Those defining the dark line – labelled North – show a brief period of heating and then cooling. The south of Connemara was the site of igneous activity for much longer than the north – the later cooling is clear from the data. Data points from the right hand side of the graph are associated with heating from much later granites.

Scream if you want to go faster

Prof. Romans is a sedimentary guy and interested in metamorphic rocks as something that ends up as a layer of sand or mud. Linking metamorphic rocks to sedimentary ones means tracing out one of those great big linked cycles that make earth science so mind-expanding. My favourite example – good evidence for what went on deep in the Himalayas can be found in sediments deep in the Indian Ocean. As an aside, for these Connemara rocks we can also trace the point at which they start being eroded and ending up in a sedimentary basin. As a further aside, the grains that were dated from Irish metamorphic rocks can also be found in modern sediments. These studies (detrital mineral thermochronology) can be used to find out where sediment came from or to estimate the  timescales of sedimentary processes. That’s a topic for another time.

Brian Roman’s original question started with asking how fast metamorphosing rocks can be exhumed. Exhumation means the rocks reaching the surface – like digging up corpses only much much nicer. This is linked to a rock’s cooling history as in order for a metamorphic rock to cool significantly and quickly it needs to get nearer the surface. Metamorphic rocks may form in unusually hot parts of the earth but the fact that the earth gets hotter the deeper you go is the main control. Places where rocks are exhumed quickly must be places where the rock above is removed quickly and one way to do this is to erode it away.

The fastest rates of exhumation known are in the Himalayas. Specifically at the eastern and western ends: Namche Barwa in the eastern Himalaya and near Nanga Parbat in the west. Here rocks are being drawn to the surface so fast that 25km of rock has been eroded in the last 10 million years. Given that the Himalaya are around 50 million years old and on average 5 kilometres high, this is quite amazing.

The likely reason for such rapid exhumation is that these points are where massive rivers, full of glacier melt from the Tibetan plateau and Himalayas, cross the Himalayan mountain range. The rivers cut deep down into the earth and soft hot rocks flow into the space created (more detail here). The Himalayas and the Tibetan Plateau cause the Monsoon which drives rain-clouds north from the ocean to feed Himalayan glaciers. Melting glaciers fill the rivers, which cut deep into the earth and drive a flow of rock from kilometres under the ground, up to the surface where it is turned into sand and mud that flows back down into the ocean. There it forms sedimentary rocks, that one day may be buried and be turned back into a metamorphic rock. There are so many cycles in geology and so many links between them.

In the first post in this series we learned that the formation of those beautiful metamorphic minerals paraded on Twitter every #thinsectionThursday is less like the slow transformation of dough baked into bread but instead more like the sudden explosive transfiguration of a hard kernel into tasty pop-corn5.  In this post we’ve learned how we know how quickly rocks cool. This can be slow, like letting a roast chicken rest before carving but other times it’s like popping some morsel straight from the fryer and onto your plate

BRITICE-CHRONO: death of an ice sheet

Using many different techniques, dozens of scientists are studying the death of an ice sheet that once covered Britain and Ireland. They want to understand the future fate of modern-day ice.

The phrase “ice sheet” doesn’t do justice to our subject: this is not something you shatter when stepping on a frozen puddle. Covering over a million square kilometres, this sheet is also kilometres thick. As it grew it pulled enough water out of the world’s oceans to lower them by metres, affecting tropical coastlines as well as the land entombed beneath the ice. The vast bulk even pushed down the crust beneath, slowly moving the underlying mantle aside.

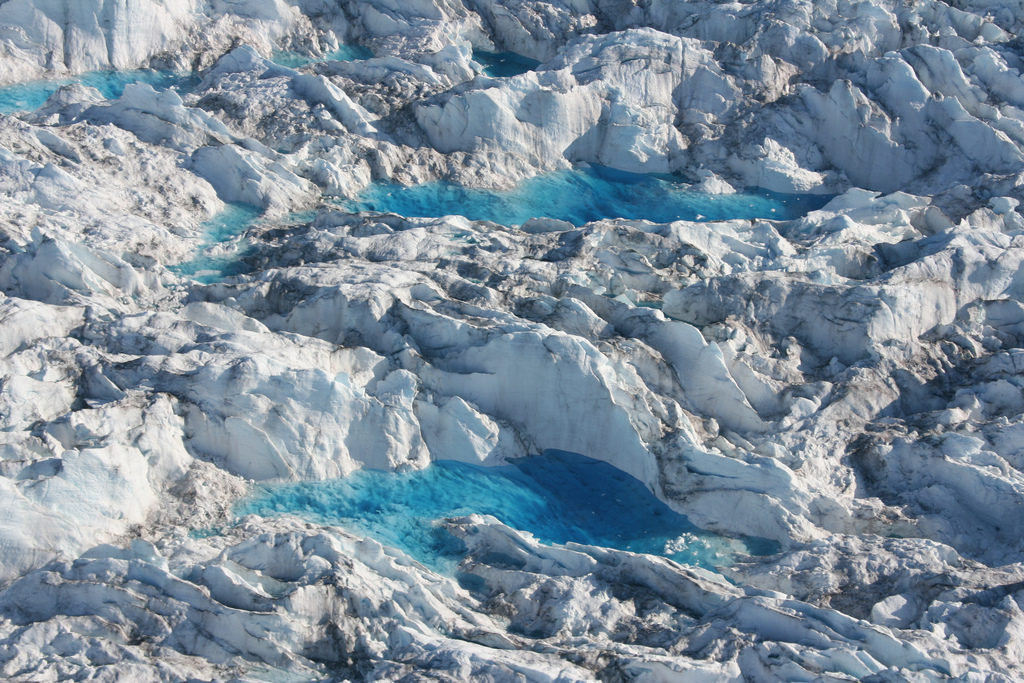
Melt pond on icesheet. Photo by Leif Taurer used under Creative Commons.

Melt pond on ice sheet. Photo by Leif Taurer used under Creative Commons.

The ice is constantly in motion. Snow falling on the ice sheet will eventually make its way to the sea, slowly flowing down and along.  Most is channelled into fast moving ice-streams.  This ice sheet is ‘marine-influenced‘, it sits partly on land, partly on the sea – most of its ice will end its days as an iceberg. The edges of the sheet can become undercut by the oceans, turning the edge into delicate ice shelves.

In the way it grows and flows, this ice sheet can seem almost alive. It will surely die, one day. Changing climate tips the balance between snow build-up and melting, the unstable ice shelves collapse and the ice-streams send ice to melt in the sea. In time the sheet thins to nothing and the world is transformed again.

BRITICE-CHRONO

My description of an ice sheet applies to the modern West Antarctic sheet. Scientists who study it worry about how, in the face of a rapidly changing climate, it might collapse, flooding cities across the globe. The IPCC identified this risk and highlighted how little we know about it.

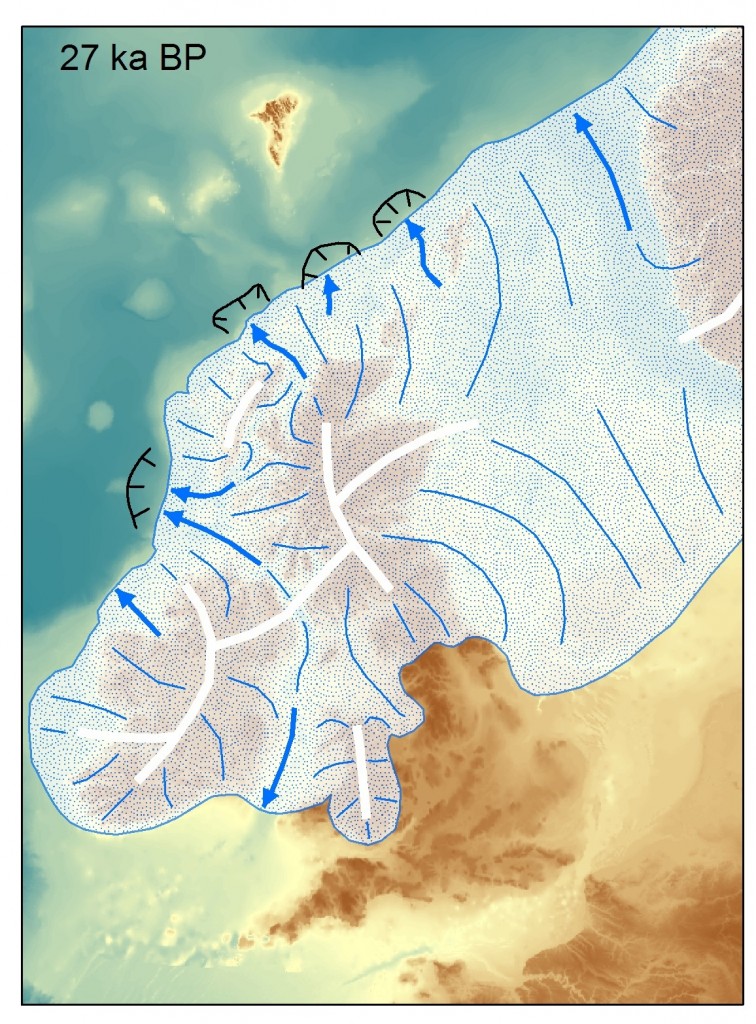
27,000yearsago (2)

The British & Irish ice sheet, 27,000 years ago. Image courtesy of Chris Clarke.

My description also applies to the ice sheet that sat over Britain & Ireland 25,000 years ago.. A multi-disciplinary consortium, called BRITICE-CHRONO will greatly improve our understanding of the death of this ice sheet. This will be of great local interest, but will also help us predict the potentially troubled and troubling future of both the West Antarctic and Greenland ice sheets. The ancient climate change that killed the ice sheet was natural, but modern human-made warming melts ice just the same.

BRITICE

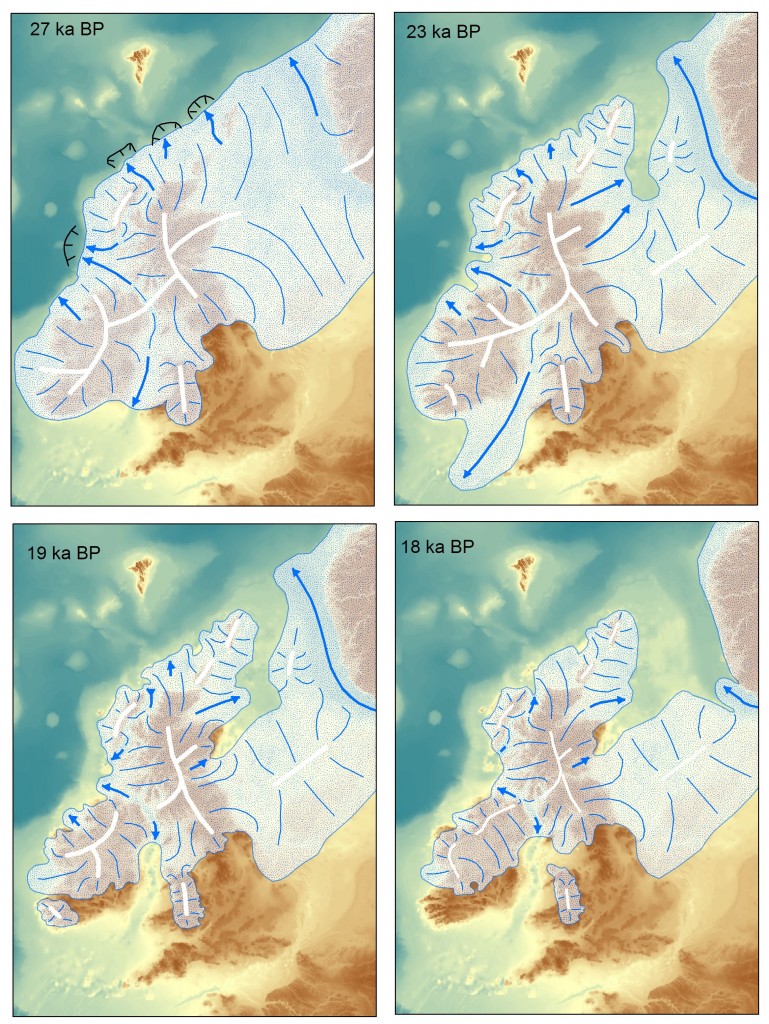
The physical traces of the death of the British ice sheet are easy to find: erratics, moraines and glacial lake deposits are just a few of the subtle but distinctive features to found over much of Britain. A now complete project called BRITICE, led by Professor Chris Clark of Sheffield University, mapped them all, focussing on traces of the final retreat of the ice sheet. Similar work in Ireland allows the pattern of retreat for the entire ice sheet to be inferred.

Maps showing the evolution of the British & Irish icesheet over time. Image from Chris Clark.

Maps showing the evolution of the British & Irish ice sheet over time. “19 ka BP” means 19,000 years before present. Image from Chris Clark.

CHRONO

BRITICE-CHRONO involves nearly 50 researchers from 8 universities plus the British Antarctic and Geological Surveys. A big part of the work of BRITICE-CHRONO is working out the age of various features. Familiar techniques such as radiocarbon dating are useful, but a new generation of dating techniques can do things that seem almost magical.

Optical stimulated luminescence (OSL) dates the last exposure of sunlight for individual quartz grains. Natural radioactivity traps electrons within defects in the crystal lattice of the quartz grains. If light comes through it frees them again and produces more light (the luminescence). Quartz exposed to sunlight at the surface does not show luminescence, but grains that have been buried in a sand bank for thousands of years do. Measuring luminescence in the lab allows an estimate how long they have been buried for and therefore when the sand was deposited.

Conversely, TCN (terrestrial cosmogenic nucleides) is a technique used for dating how long a surface has been exposed. Cosmic radiation is constantly streaming down on us and within minerals at the Earth’s surface it produces radioactive elements such as 10Be and 36Cl. The more of these we find, the longer the surface has been exposed to space. Apply this technique to a boulder dropped by a glacier and we can infer when the ice was last present.

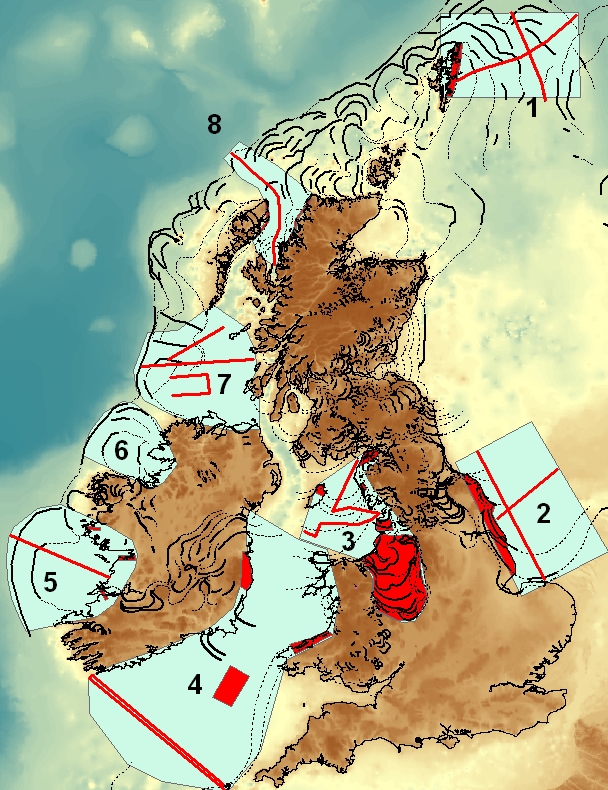
BRITICE-CHRONO's area of investigation. Image from Chris Clark

BRITICE-CHRONO’s  8 transects. Image from Chris Clark

As part of BRITICE-CHRONO people are collecting hundreds of samples from all over Britain and Ireland. Guided by the BRITICE work, they are sampling features tied into different stages of the death of the ice sheet. The goal is to build up a large and robust dataset to understand how quickly the ice sheet shrank.

To the sea

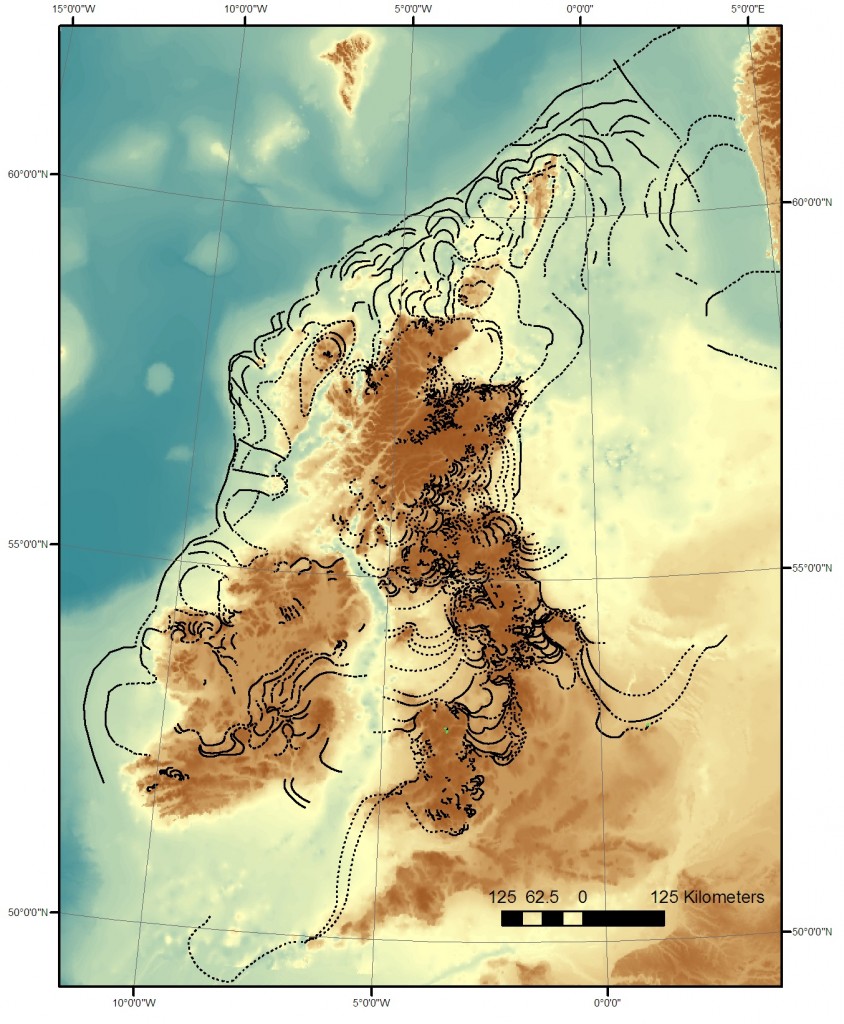
When the ice sheet was there, sea levels were much lower (because the water was in the ice) and the ice left many traces on what is now the seabed.  BRITICE-CHRONO is using geophysical techniques to understand the distribution of glacial sediment on the seabed (sometimes on land too). Collecting cores from the sediments on the seabed also provides samples for dating. Cores from far offshore contain large rock fragments. These show that floating icebergs melted overhead, dropping stones scraped from land that became entombed within the ice sheet. Marine fossils offer their own special insights.

Offshore features. Image from Chris Clark.

Ice retreat features, both offshore and on. Image from Chris Clark.

There is a lot of interest in understanding features on the sea-bed – construction of offshore wind-farms requires better knowledge of what is out there. Also we now understand the potential for archaeology under these shallow seas. The British-Irish ice sheet may be long dead, but that doesn’t mean people never saw it1.

Recreating the ice sheet ‘in silico’

We know a lot about the world in which the last British ice sheet died. Ice from this time still exists, buried deep in the central parts of the Antarctic and Greenland ice sheets. It contains bubbles of air that once blew over a colder world. From this and other evidence, we have a good record of the climate spanning the period in question.

Scientists have built up sophisticated computer models of how ice sheets grow and die, in part based on research in Antarctica. Take known parameters, such as climate and topography and its possible to recreate an ice sheet ‘in silico’, to build up layers of ice within a computer and watch them disappear as the climate warmed.

BRITICE-CHRONO will build up a robust 4-D dataset of how the ice sheet retreated over time. Combining this with computer modelling will create a positive feedback, increasing our knowledge of how ice sheets behave, both in the past and the future.

Scientific Aims

BRITICE-CHRONO will test three main hypotheses, all of which are relevant to the goal of predicting the fate of modern ice sheets:

  1. The portions on ice close to sea level  collapsed rapidly (in less than 1000 years) but the rate of decay was slower for ice on land. Just how catastrophic was the death of the British-Irish ice sheet?
  2. The main ice catchments draining the ice sheet retreated synchronously in response to climatic and sea-level change. Was the retreat of the ice controlled entirely by external factors, or did the response vary over the ice sheet? This helps us understand the significance of local rapid retreat of ice in Antarctica. Does seeing it in one place necessarily mean it is happening to the whole ice sheet?
  3. The volume of ice-rafted debris depends on changes in ice sheet mass balance. Finding large stones in layers of offshore sediment is a direct record of where melting icebergs were found in the past. How is this linked to changes in the ice sheet? Does the amount increase when ice sheets grow, or when they retreat?

BRITICE-CHRONO is less than half way through its 5 years so it is too early to draw any conclusions. The goal is to produce a robust set of data so individual dates will not be published until the full picture is know. Last year saw a massive sampling effort that will continue this year. Although the focus is dating, put experts in the field and they will find new features such as a whole new suite of moraines in Scotland.

The consortium has a blog and is active on Twitter so you can join me in following their progress as they bring an ice sheet back from the dead.

Granites and their space problem

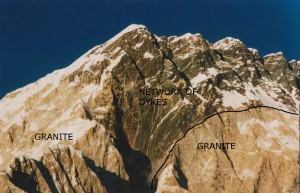
Look at a large-scale geological map and, provided the area is not covered in recent sediments, there will be large areas of red showing outcrops of granite. There are many ways in which rocks can be melted to produce granitic magma. But it’s long been recognised that there is a ‘space problem‘: how do those big red areas on a map form? How does the molten rock get there and where has all the rock that used to be there gone?

Nuptse south face geology annotated

How did all that granite fit into there?

The easy stuff

Let’s start with the easy explanations. First, intruding magma near the surface. There are a range of structures – sills, dykes1, laccoliths, and ring dykes – that are associated with intrusion of magma at shallow depths. All of these features involve magma moving along a plane of weakness (a fault or bedding in sedimentary rocks) and forming a relatively thin layer. Making the space is no problem – the magma can simply push the surface up. Satellite imaging of volcanoes often shows the surface rising up and down as magma moves about so no problem here.

Large areas of granite are more common at greater depth. If there is 10km of rock above, it is not obvious how the magma could push the surface up. Also a typical granite intrusion forms an oval shape on the surface – how does such a shape form?

Inadequate solutions

Papers on plate tectonics sometimes sketch out things in a cartoony way. For island arcs, where they want to show the extensive granite intrusions, people often draw as a blob, with a little tail at the bottom. It’s only a cartoon, but it conveys a popular but incorrect idea – that granite magma ascends as a diapir. 

In sedimentary basins it’s not uncommon for thick layers of salt to become unstable and for some to rise towards the surface as a blob-like diapir, like wax in lava lamp. For a long time it seemed plausible that light granite magma moved up through the crust in the same way. It would certainly explain the round shape of intrusions. However granite can only flow when it is hot. Unless it is in the lower crust (or perhaps in hotter Archaean crust), doing the maths shows that any granite diapir would cool and freeze long before it got anywhere.

Just say no to granite diapirs

Just say no to granite diapirs

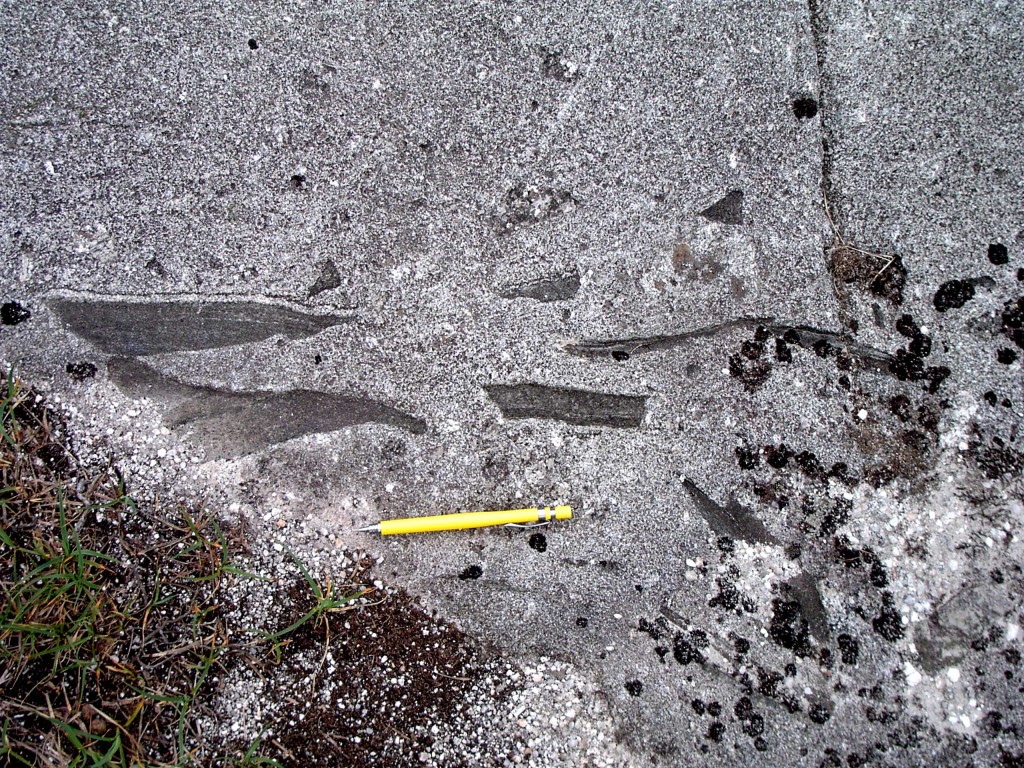
Another concept that doesn’t quite explain how granite intrusions form is stoping. This is the process where blocks of the surrounding ‘country rock’ fall into the granite and are sometimes melted. Granites are often rich in such fragments (called xenoliths), but it is only a marginal effect. The vast majority of a granite intrusion is granite brought in from elsewhere – stoping doesn’t help explain how space is made for it.

Granite from Donegal. Xenoliths in microgranite near Polcrovehy. Courtesy of Carl Stevenson.

Granite from Donegal. Xenoliths in microgranite near Polcrovehy. Courtesy of Carl Stevenson.

Modern ideas

Melting of rocks to form granite magma is more common in the lower crust (it’s hotter down there). This is a continuous process and it turns out that it is fairly easy to squeeze out the magma, even if it only forms a small percentage of the melting rock. Rock-melt mixtures are very soft and easily deformed. When this happens, the magma is easily squeezed out and being light and under pressure, it moves its way upwards.

Part of the reason for the popularity of the diapir model was the thought that granite magma was too sticky to flow up dykes the way basaltic magma does. Basaltic magma on the surface (where we call it lava) flows beautifully, whereas lava of granitic composition flows only reluctantly – instead it tends to get stuck in the volcano which eventually explodes2.

More modern studies of the viscosity of granite magma show that within the middle crust, granite magma can easily flow up vertical cracks. It can do this extremely quickly and it can happen with small volumes of magma.

It turns out therefore, that all these great big red areas on geological maps are actually made up of many small batches of magma joined together, either as separate sheets or by mixing within a magma chamber. This makes sense – it more closely matches the record of surface vulcanism – volcanoes don’t grow overnight but through a series of many eruptions.

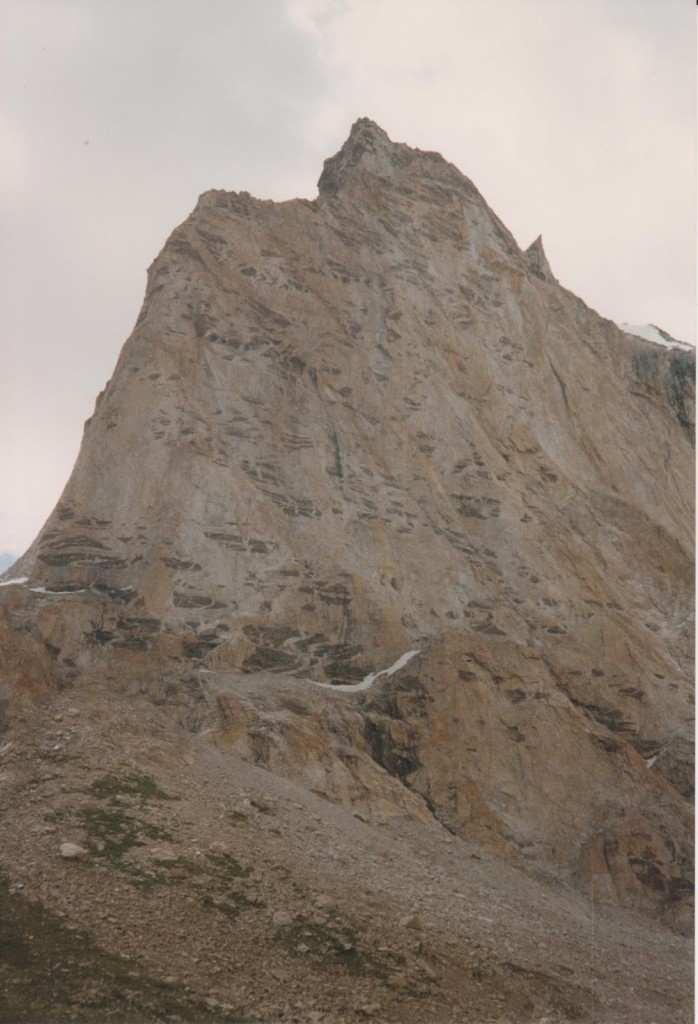
Gumbaranjon, Ladakh, India

Complex granite intrusion, with dark xenoliths. Gumbaranjon, Ladakh, India.

How do large intrusions form through multiple batches of magma? Just like shallow intrusions, they tend to make use of existing structures. Only in the middle crust these aren’t brittle structures and sometimes they are still moving as the granite arrives.

A good way of illustrating all this is to go to Ireland.

Irish men of granite

Before we get to the rocks – an interlude. For me the best granites are Irish for personal reasons. Much of the best research into granite emplacement has involved graduates of Queens University, Belfast. Donny Hutton, John Reavy, Ken McCaffrey and Carl Stevenson were all trained there and have worked on Irish granites. John Reavy taught me and I’ve encountered all the others in some way or other: for me granite is best pronounced with an Ulster accent.

To drift off on a tangent a little, a story John Reavy told me about being a trainee geologist in Northern Ireland during ‘the Troubles’. Belfast city centre was regularly bombed by terrorists during this time. Fancy buildings would be seriously damaged, their polished stone cladding (including granite) broken into pieces and flung about the shattered streets. Enterprising geologists would then pick up some nice samples, once the dust had settled. Life goes on, after all.

To Donegal

Back to the rocks.

Map of Donegal's granites. Taken from Stevenson et al. (2007)

Map of Donegal’s granites. Taken from Stevenson et al. (2007)

The granites of Donegal are classics. In the 1980s, a series of papers by Donny Hutton laid out the link between the granites and deformation of the surrounding rocks. A key finding was to show that the granite magma was intruded at the same time the surrounding rocks were being deformed. This was a neat trick, partly because at the time there was no way of dating deformation directly. Dating intrusions however, was possible.

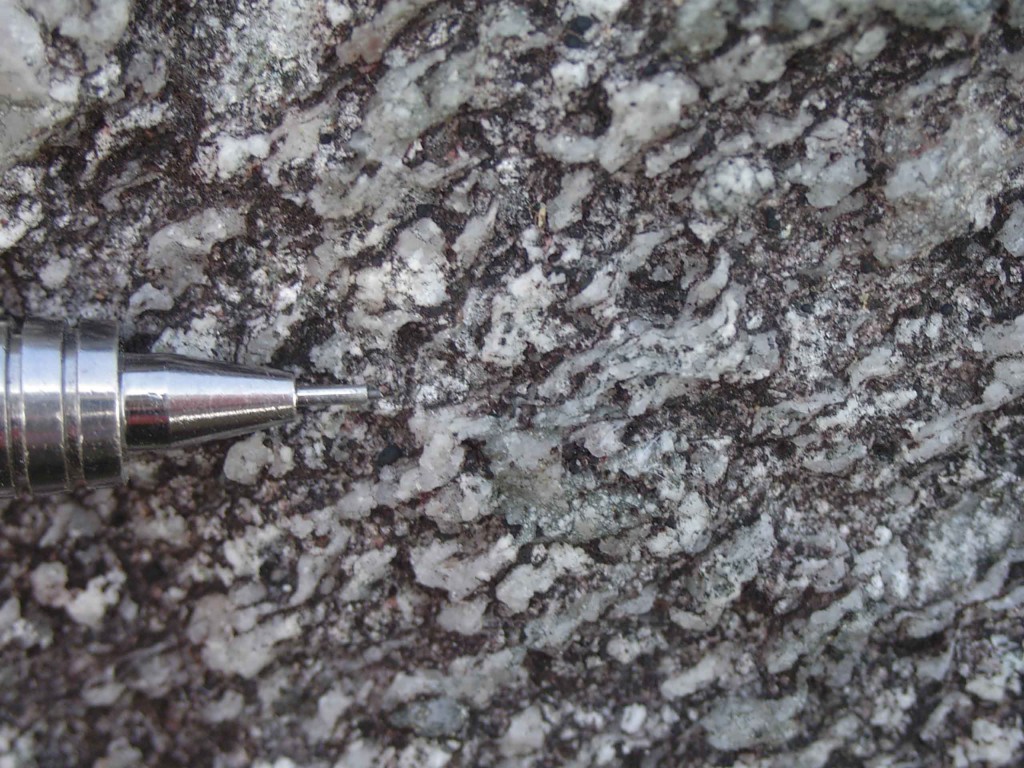
Sometimes the Donegal granites were deformed after they became solid rock. We can tell this because all mineral grains are affected and some have flattened shapes.

Dextral shear – strong solid state fabric from the quartz in Donegal granite. Photo courtesy of Carl Stevenson

Strong ‘solid state’ fabric in Donegal granite, note the flattened quartz grains indiciating deformation of solid granite. Photo courtesy of Carl Stevenson

Some of the granite was deformed while partly liquid. In this case all the mineral grains look perfectly normal, only some structures are aligned. Minerals that form early in the crystallisation process may be aligned but are themselves undeformed – they were rotated as a crystal-melt mush was squashed.

Using such techniques, Donny Hutton showed that the Donegal granite formed within an active shear-zone. This led to a period of 10 years where pretty much every granite pluton in the British Isles had its intrusion linked to active structures. If rocks are deforming there are lots of ways in which space can be made for granite intrusions to form.

State of the art

When I was doing my undergraduate mapping in Donegal, the easiest bits to map were the granites. Granite was granite, as far as I was concerned – easily identified and quickly marked on the map. This was fine for that level, but with enough work, it’s possible to distinguish between individual batches of magma by clocking subtle differences in mineralogy or grain size. There’s a beautiful example of this from El Capitan in Yosemite.

Another technique tells you more about the structures within the granite. Some granites are rich in structures – aligned minerals or composition variation, you can find examples in many places. However granites that look featureless may contain minerals that are aligned. A technique called “anisotropy of magnetic susceptibility” or AMS allows us to measure the orientation of magnetic grains within the granite.  This can pick up fabrics even in weakly deformed granite (or other materials).

Applying these techniques to the Donegal granites allows a detailed picture to be built up.

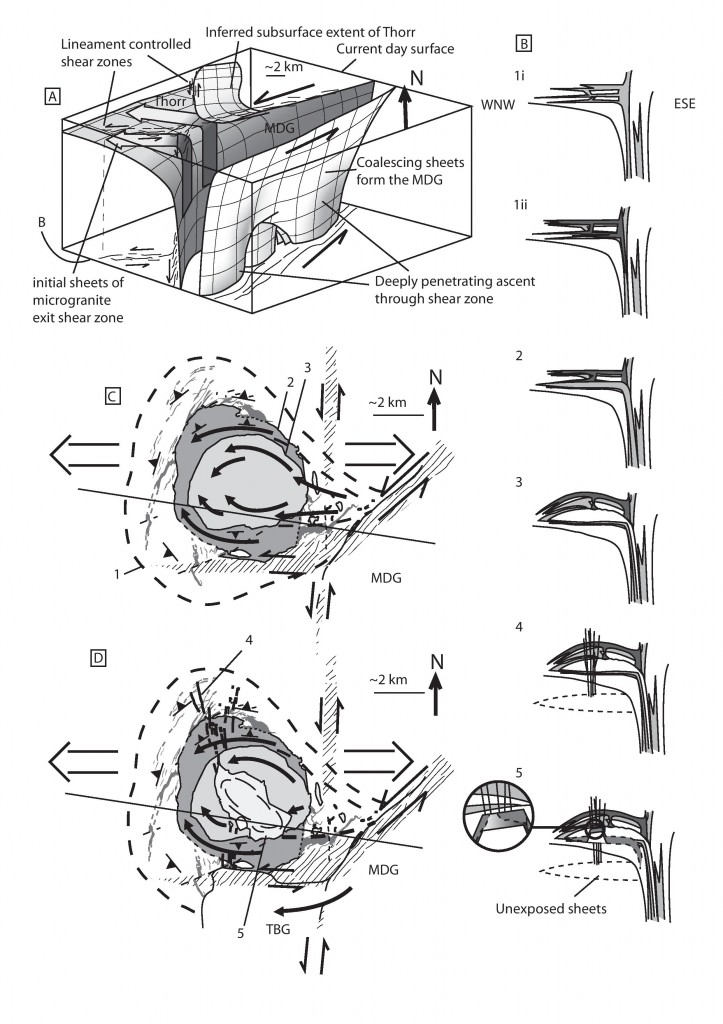
The Main Donegal Granite (MDG) marks the site of a major crustal shear zone that provided a route of ascent for multiple batches of granite magma. It now is filled by sheets of granite, often deformed, that entered space created by dilation of the shear zone. Some batches of granite that ascended this way ‘leaked out’ of the shear zone.

One of the leaked batches ‘ballooned’ out, pushing the surrounding rocks out to form the circular Ardara intrusion. Other leaking batches intruded less forcefully, forming horizontal sheets (called laccoliths) that thicken out in domes to various degrees.

Diagram showing interaction between ascent and emplacement of Donegal granites. From Carl Stevenson

Diagram showing interaction between ascent and emplacement of Donegal granites. From Carl Stevenson

The space problem solved

The Donegal granites demonstrate two processes that are of global significance: how granites ascend and how they are emplaced. Vertical structures allow granite magma to flow up in small batches. At a particular level in the crust they migrate sideways and are emplaced, often as horizontal sheets.

By using existing structures and building up intrusions via small batches, there is no need to massively deform the surrounding rocks, the way diapirs would have to. Looking at a map view of granites, a sea of red, it is hard to think where the rock that used to be there has gone. As often in geology, the answer is to think in 3 dimensions – the rock was either pushed up (and has since been eroded) or was pushed down under the granite. Thinking about the crust as a whole, moving granite magma from the lower crust into higher rocks doesn’t involve a significant change of volume. Material melted out of the depths creates a sheet in the middle crust, pushing down the intervening rocks.

A theme of granite intrusion studies from Ireland and Scotland is the importance of pre-existing structures, particularly active ones. In detail, two sets of structures are important – the main MDG shear zone and a nearly-N-S lineament, that is believed to be linked to a major crustal structure.

Work on the equivalent rocks in Scotland (by Jacques and Reavy) presents a regional model where the lower crust is made up of a series of ‘lozenges’ formed by the intersection of two sets of structures (one set related to contemporary plate tectonic movements, the other pre-existing). Granite intrusions are predominantly found where these structures intersect. Movements along them may have influenced the siting of melting, the ascent of the granite and also their emplacement.

The problem of how granite intrusions form has long been known of. The tale of how it was solved is a typically geological one, requiring the synthesis of many techniques and the application of ‘four-dimensional thinking’. A problem best seen in a geological map can be solved by thinking how rocks move vertically and change over time.

References

Stevenson C.T.E., Hutton D.H.W. & Price A.R. (2006). The Trawenagh Bay Granite and a new model for the emplacement of the Donegal Batholith, Transactions of the Royal Society of Edinburgh: Earth Sciences, 97 (04) 455-477. DOI:

Petford N., Cruden A.R., McCaffrey K.J. & Vigneresse J.L. Granite magma formation, transport and emplacement in the Earth’s crust., Nature, PMID:

Stevenson C. (2009). The relationship between forceful and passive emplacement: The interplay between tectonic strain and magma supply in the Rosses Granitic Complex, NW Ireland, Journal of Structural Geology, 31 (3) 270-287. DOI:

JACQUES J.M. & REAVY R.J. (1994). Caledonian plutonism and major lineaments in the SW Scottish Highlands, Journal of the Geological Society, 151 (6) 955-969. DOI:

Ireland: good terrain for terrane training

The word terrane has a very specific geological meaning. Usually short for tectonostratigraphic terrane, they’ve been defined as “fault-bounded crustal blocks that preserved a geological record distinct from that of adjacent terranes” (Jones
et al., 1983).

The concept was first coined as a way of understanding the rocks of the North America Cordillera. We know now this area is a collage of different terranes that were added (“accreted”) to the proto-North American plate (Laurentia). Some formed part of the core continental plate. Others formed within the vanished ocean, as pieces of volcanic arc, accretionary wedge or oceanic crust. Others are pieces of continental crust that came from further afield, such as Arctic Norway.

Getting around British Columbia or Alaska is hard and dangerous (think helicopters and grizzly bears). Doing geology in the West of Ireland is much easier (think mini-buses and pubs). This explains its popularity for university field trips. During the Ordovician, various pieces of oceanic and arc crust were scraped onto the Laurentian continent in what is now Ireland. This makes it good terrain for terrane training1.

Getting a handle on a complex jumble of terranes requires geologists to draw on a whole range of geological data. There are some specific concepts that relate to terrane analysis, all nicely illustrated in the west of Ireland.

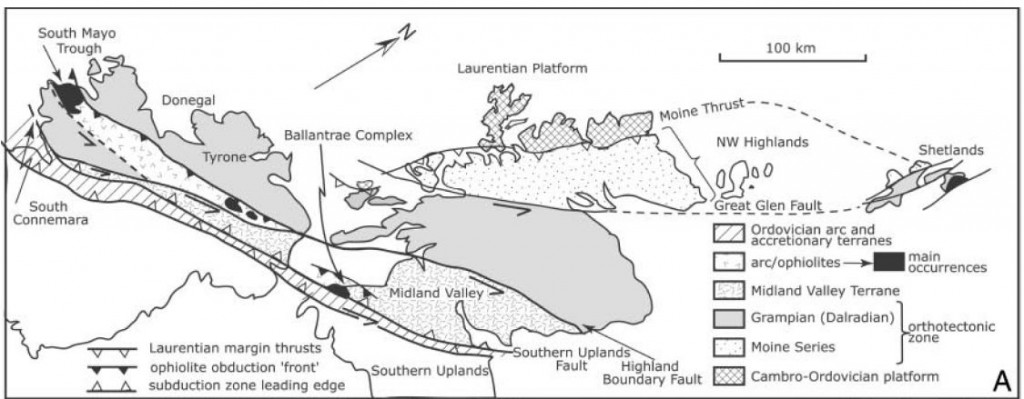
Terrane map of the British Isles. Figure 1a from Dewey 2005

Terrane map of the British Isles. Figure 1a from Dewey 2005

Fossil evidence

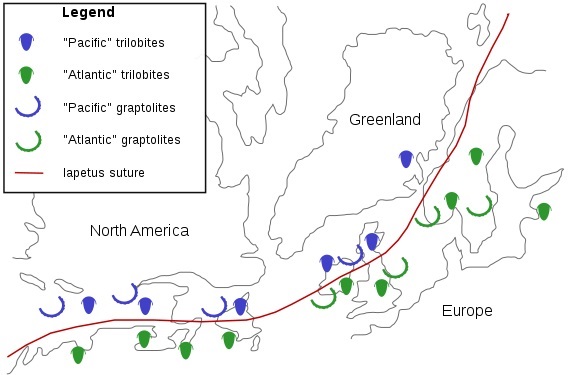
Fossils can be used to get a handle on whether particular terranes were near each other or not. A classic example of this comes from the British Isles. In the 1940s, Stuart McKerrow was a young man on the Atlantic convoys, constantly menaced by Nazi submarines while ferrying American materiel to a hungry Britain . While not winning medals for bravery2, he found time to ponder a mystery. Cambrian rocks in Newfoundland, one end of his dangerous journey, contained trilobites that closely matched fossils from his native Scotland. Oddly trilobites of the same age from England and Wales were very different. Surely it would have made more sense if the fossils from opposite sides of the Atlantic were different, in the same way modern animals are different across oceans.

dx

Diagram showing Iapetus suture as picked out by fossils. Image from Wikipedia

Of course now we understand that the Atlantic did not exist in the Cambrian. During his later career as a geologist at Oxford University, Stuart McKerrow joined others in showing that the line of a vanished ocean, Iapetus, can be traced across the British Isles. Wales and Scotland started off on opposite sides of this ocean. At certain times, species that live in the deep sea were the same, but shallow water (benthic) animals were different – something that requires an intervening body of deep water. His work involved detailed studies of fossils on both sides of the Atlantic, picking out the pattern of plates and terranes, showing how they moved during the closure of the Iapetus ocean.

Stitching pluton

A stitching pluton is an igneous intrusion that joins two or more terranes together. Simple field relationships will show that the intrusion cuts into the rocks of the terranes. The intrusion is therefore younger than them, plus the terranes were adjacent when the magma was intruded. Dating the age of intrusions is relatively simple which means stitching plutons are a simple way to constrain when two terranes were joined.

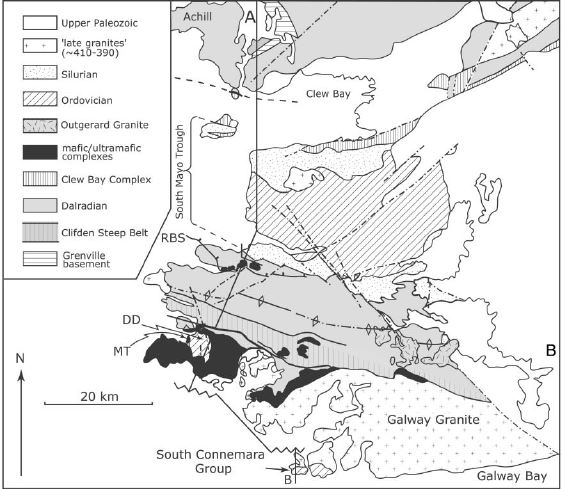
Diagram of Connemara and surround regions. Figure 1b from Dewey 2005

Diagram of Connemara and surround regions. Figure 1b from Dewey 2005

The Galway Granite is a large batholith found on Connemara’s south coast. To its north are the metamorphic rocks of the Dalradian Supergroup. Formed on the Laurentia continent, these rocks were deformed by the Caledonian/Taconic orogeny around 475-460Ma. To the South of the Galway Granite, the South Connemara group is a tectonic melange including abyssal cherts and mafic volcanics with chemistry suggesting they formed at a mid-ocean ridge. These rocks formed at a Ordovician subduction trench.

These two terranes formed in very different tectonic environments, but by 420 million years ago they were next to each other, ready to be permanently stitched together by the Galway granite.

Sedimentary linkages and overlap assemblages

Another way of showing two terranes have become close to each other is to show that pieces of one were eroded into a sedimentary basin on the other. For example conglomerates in the trench rocks of the South Connemara group contain distinctive rock-types common in the Connemara Dalradian terrane to the north. This would suggest the two terranes were nearby while the South Connemara group was forming – that the subduction trench lay along a line now obscured by the Galway Granite.

In a similar way, detailed studies of heavy minerals in the South Mayo Trough  and samples of distinctive igneous rock types can be used to date when the Connemara terrane moved close by. Connemara is the only piece of Dalradian found to the south of the Iapetan arc terranes. For this reason it is thought to have been shifted into its current position by strike slip faulting during the Ordovician.

There is a sedimentary linkage between Connemara and the South Mayo rocks – a set of Silurian rocks that lie unconformably on both terranes. This puts a upper limit on the timing of relative movement. Unfortunately it also obscures the actual contact. The details of how Connemara arrived in its current location remain a mystery.
The concept of terranes is extremely important. Terranes form a vital bridge between the bewildering detail that a field geologist has to deal with and the simple concepts of plate tectonics.

References

Jones, D.L., Howell, D.G., Coney, P.J., and Monger, J.W.H., 1983, Recognition, character and analysis of tectono-stratigraphic terranes in western North America, in Hashimoto, M., and Uyeda, S., eds., Accretion Tectonics in the Circum-Pacific
Region: Terra, Tokyo, p. 21–35.

Dewey J.F. (2005). Inaugural Article: Orogeny can be very short, Proceedings of the National Academy of Sciences, 102 (43) 15286-15293. DOI:

Brown D., Ryan P.D., Ryan P.D. & Dewey J.F. (2011). Arc-continent collision in the Ordovician of western Ireland: stratigraphic, structural, and metamorphic evolution, Arc-Continent Collision, 373-401. DOI: