Gas, not ice, makes subglacial rhyolite explode

A recent study by Jacqui Owen (Lancaster University), Hugh Tuffen and Dave McGarvie shows that the explosivity of a subglacial rhyolite eruption is determined while the magma is still deep beneath the ground. Rhyolite is a particularly thick and gloopy (viscous) type of magma that is especially prone to explosive eruptions.  I’m really pleased to see this study published because I worked on subglacial rhyolite eruptions for my PhD. Where I mapped and measured pumice deposits to show that whether an eruption is explosive or not is not controlled by the ice, Jacqui has used geochemical methods to show what does control it: dissolved volcanic gases.

Explaining how she found out is also a good excuse to discuss a key question in volcanology: Why do volcanoes explode?
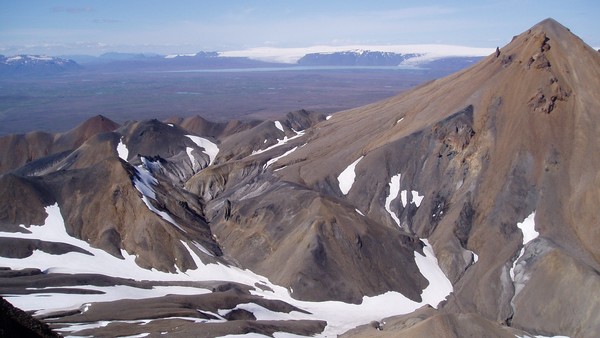
Subglacial rhyolite at Kerlingarfjöll

Part of the subglacial rhyolite volcano of Kerlingarfjöll, Iceland. Steep mountains like this, dominated by scree, pumice and ash were formed by explosive volcanic eruptions at times when all of Iceland was buried by ice up to 1000 m thick. Water from melting ice is known to make volcanic eruptions more explosive, but recent findings show that the effect is minor in subglacial rhyolite eruptions. Click to enlarge. Copyright: John Stevenson, 2012.

Volcanoes, explosions and ice

Why do volcanoes explode?

During an explosive eruption, pumice, ash and rock fragments (collectively known as tephra) are blasted from the volcano at high speed, driven by hot, expanding gases. The gases, mainly steam (i.e. water; H2O), have come from within the magma itself. Down in the magma chamber, deep beneath the volcano, the pressure of the weight of the rocks above keeps the gases dissolved, but when the liquid magma rises to the surface, the pressure that it feels decreases. The gases come out of the liquid and form bubbles, just as bubbles appear when you open a bottle of Irn Bru (other, less region-specific, fizzy soft drinks are available). The closer to the surface the magma gets, the more gas comes out, changing the magma from a thick, gloopy liquid, to a thick, gloopy, bubbly liquid, then to a thick, gloopy foam.

Imagine that the conduit (or pathway) through the rocks from the magma chamber to the surface is a rigid pipe, where the same mass of material that enters that bottom (as magma with gas dissolved inside) has to come out at the top (as magma + gas bubbles). This is a closed system. If the volume of a parcel of magma is doubled by forming bubbles, then the speed that it comes out the top must also double. Thus the magma accelerates. Triple the volume, triple the speed.  Quadruple the volume, quadruple the speed. The formation and expansion of gas bubbles drives the magma faster and faster to the surface.

This type of acceleration by expansion is perfectly illustrated by Diet Coke and Mentos eruptions, but volcanoes take things a step further. Once the magma reaches about 70% bubbles, the forces due to acceleration within the conduit become too much for the foam, which rips or shatters into fragments of pumice and ash. The full power of the gas expansion is now unleashed, no-longer limited by the flow rate of the thick, gloopy magma; the mixture accelerates ferociously. When it comes thundering out at the surface, it is travelling at speeds of over 300 metres per second (~1000 km/h, 670 mph).

Explosive eruptions are most common where the magma is so thick and gloopy (viscous) that gas bubbles cannot escape. This is most common with andesite, dacite and rhyolite magma types. The duration of these explosive eruptions depends on the availability of gas-rich magma in the magma chamber.

How does ice affect eruptions?

It is possible to make an eruption become explosive by adding water. The boiling point of water is well below that of magma (800-1000°C) and turning water into steam at atmospheric pressure involves a 1000x increase in volume. This can drive an explosive expansion that fragments magma into pumice and ash. The formation of the island of Surtsey, which grew out of the North Atlantic in 1963-1967, is a good example of an eruption of runny basalt magma that has explosive phases only when water mixed with magma at the vent.

In Iceland, most subglacial eruptions are basaltic. Melting ice adds water to the magma, turning the eruptions explosive.  The eruptions often take place within ice-dammed meltwater lakes.  If the volcano builds above the water surface, Surtsey-like, or if the lake level drops below the vent, then the eruption switches from explosive to effusive (lava-producing). Ice and meltwater therefore control the explosivity of subglacial basalt eruptions and the duration of the explosive phase of an eruption depends on the access of water to the vent.

More recently, researchers have investigated whether the same is true for rhyolite.

Subglacial rhyolite and volcanic gas

Magma chamber water content

Owen and coworkers sampled 5 different subglacial rhyolite mountains in Torfajökull, Iceland.  The first two were piles of pumice, ash and scree up to 1 cubic kilometre in volume, so we know that they formed in large, explosive eruptions. Two were made of lava and were formed in effusive eruptions, and the fifth one was produced by an eruption with both explosive and effusive parts.  The samples contained big crystals (called phenocrysts) that formed in the magma chamber. Some of these had grown in a way that trapped little blobs of melt inside them. These are called melt inclusions and they act as a record of the magma composition before the eruption.

Owen analysed how much water was dissolved in the magma within the melt inclusions.  She found that the samples from the explosive eruptions contained the most (up to 3.9 wt%).  A sample from the explosive part of the mixed eruption had the highest water content ever measured in Icelandic rhyolite (4.8 wt%). Melt inclusions from the effusive eruptions contained the least dissolved water (up to 1.8 wt%). Dissolved melt inclusion gas content therefore correlates with the explosivity of the resulting eruption. The magma “knows” whether it will be an explosive eruption or not while it is still in the magma chamber.
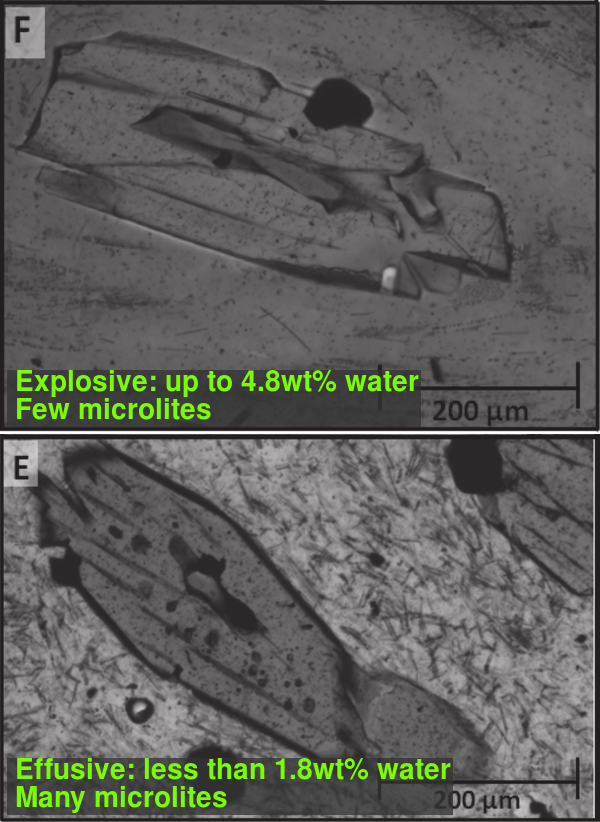
Microscope images of explosively and effusively erupted subglacial rhyolite.

Microscope images of subglacial rhyolite ash from explosive and effusive eruptions. Owen and coworkers found pockets of frozen melt trapped within the big crystals. These could be analysed to see how much magmatic water was in the magma chamber. Tiny crystals, called microlites, are found in samples from effusive eruptions. They formed as magma moved slowly to the surface, losing gas on the way. Image modified from article in Geology.

Gas leaks prevent explosions

It might seem strange, given the huge volume changes and accelerations, that a reduction of just 1-2 wt% in dissolved water content could be the difference between an explosive and effusive eruption, but Owen and coworkers also found differences in what happens to the gas on the way to the surface. The samples from the effusive eruptions showed evidence for ‘open system’ degassing.

Open systems (as opposed to the closed system described previously) allow gas to separate from the magma and to escape along the conduit or through cracks in the rocks. It’s the equivalent of opening the Irn Bru bottle slowly and carefully. SKSSSSSSCH! Sksssssch. Tssssssssssss…

Degassing the magma this way encourages tiny crystals (called microlites) to form. The samples from the effusive eruptions were full of them, while the ones from the explosive eruptions were not. If the gas can leak, then the force for acceleration is lost.  As the  effusively-erupted magmas began with less dissolved gas, they formed bubbles later and more slowly than the explosively erupted ones. This slowed the expansion of the foam, which slowed the rise to the surface, giving the gas time to escape from the magma.  Slower decreases in pressure slowed the release of more gas, which allowed even more time for escape and so on and so on until, instead of exploding, the magma was squeezed from the vent like steaming-hot, rocky toothpaste.

What does it mean?

No-one has ever witnessed a subglacial rhyolite eruption so our best way of working out how one would look, how much ash it would produce, or how long it would last is by looking at what remains of past eruptions.

The work on the pumice, ash and scree mountains of Iceland told us that adding meltwater to already-exploding rhyolite will produce lots of very fine ash, capable of being carried vast distances. This is bad news for aeroplanes. It also shows that the water will make the ash sticky, so the grains clump together and fall to the ground near the volcano. This is good news for the aeroplanes. Including this information in the computer models that predict where ash clouds will go will make their results more accurate.

The new evidence that gas is the main control on explosivity is probably also good news for aeroplanes. It means that subglacial rhyolite eruptions are much like rhyolite eruptions elsewhere. These produce most ash right at the start of an eruption, probably in less than 48 hours. Although the initial disruption may be large, the chances that it lasts more than a few days are small. This is similar to the Puyehue eruption in Chile, whose initial explosive phase produced an ash cloud that went round the world, but quickly settled down to many months of lesser activity.


Reference

  • Owen J, Tuffen H, McGarvie DW (2012) Explosive subglacial rhyolitic eruptions in Iceland are fuelled by high magmatic H2O and closed-system degassing. Geology. doi: 10.1130/G33647.1

Follow the authors

Jaqui Owen (@JaquelineOwen), Hugh Tuffen (@HTuffen) and Dave McGarvie (@subglacial) are all on Twitter. Follow them to find out more about rhyolite eruptions, with or without ice, in Iceland and Chile.

Further reading

To learn more subglacial rhyolite, check out these totally awesome papers. 😉

Pumice, ash and lava deposits reveal the mechanisms of explosive subglacial eruptions:

  • Stevenson, J. A., J. S. Gilbert, D. W. McGarvie, and J. L. Smellie (2011), Explosive rhyolite tuya formation: Classic examples from Kerlingarfjöll, Iceland. Quaternary Science Reviews, 30(1-2), 192-209, doi:10.1016/j.quascirev.2010.10.011.

Effusive rhyolite eruption beneath thick ice produces subaqueous-looking deposits:

  • McGarvie, D., J. A. Stevenson, R. Burgess, H. Tuffen, and A. Tindle (2007), Volcano-ice interactions at Prestahnúkur, Iceland: Rhyolite eruption during the last interglacial-glacial transition, Annals of Glaciology, 45, 38-47, doi:10.3189/172756407782282453.

Subglacial dacite and andesite produce pillows and hyaloclastite if the ice is thick enough:

  • Stevenson, J. A., J. L. Smellie, D. W. McGarvie, J. S. Gilbert, and B. I. Cameron (2009), Subglacial intermediate volcanism at Kerlingarfjöll, Iceland: Magma-water interactions beneath thick ice, Journal of Volcanology and Geothermal Research, 185(4), 337-351, doi:10.1016/j.jvolgeores.2008.12.016.

Iceland’s largest volcano records ice conditions during eruptions of different magma types:

  • Stevenson, J. A., D. McGarvie, J. Smellie, and J. Gilbert (2006), Subglacial and ice-contact volcanism at the Öræfajökull stratovolcano, Iceland, Bulletin of Volcanology, 68(7-8), 737-752, doi:10.1007/s00445-005-0047-0.
Categories: Uncategorized

UK Environment Advisor’s talk on climate change

If you are in any doubt that climate change is the biggest issue of our time, then I highly recommend watching the talk given by Prof Robert Watson, the former Chief Scientific Advisor to the UK’s Department for Environment, Food and Rural Affairs (DEFRA), at the American Geophysical Union (AGU) conference last week.

The talk is not too technical, so is understandable to a wide audience.  In it, he summarises the latest scientific data on climate change.  He covers current trends, future projections and the ways that we must adapt to limit its effects.  The outlook is grim.  The main points are that global temperatures will almost certainly rise by more than 2°C and so we must plan for increased droughts and storms, sea level rises, reduced crop yields, displaced people and widespread extinction of many species.  The way we live is going to look very different in 30-50 years time.

The full video is 1 hour long.  You can watch it below, or on the AGU website, where there is discussion on the comments.  If you have less time, I have made links that skip to the various sections (see below).  Of these, the two that you must watch are the sections on observations and projected changes (less than 7 minutes; 05:00-11:22) and on the 2°C limit and how we will miss it (5 and a half minutes; 30:05-35:22).

Academics see talks like this all the time, but for non-academics watching the video, I hope that you will also take away the following points:

  • This is a scientist talking to a load of other scientists.  There is no hype, no dramatic music, and no cute baby polar bears.  There are only data, graphs and trying to understand what they all mean.
  • There has been a huge amount of research into climate change.  Each of those graphs represents months, years, or decades of painstaking work.  The headlines that make the mainstream news gloss over how incredibly detailed our knowledge of current and past climates is.
  • Where there is uncertainty in our understanding, it is acknowledged and discussed.  We do not know if the Earth will heat by 3°C or 5°C.  But there is very little doubt that man’s activities are the main drivers in the current changes.

Glossary

Some technical terms are used in the talk.  You can look most of them up on Wikipedia or Google.  The following definitions may help understanding the two key sections of the video.

  • IPCC – The Intergovernmental Panel on Climate Change is a body set up by the United Nations to create reports summarising our latest knowledge on climate change.  The last report came out in 2007, the next one is due in 2014.
  • Scenarios – The climate of the future depends on changes in economies and populations.  We do not know what those will be.  So the IPCC reports include estimates for a number of possible scenarios and compare the differences.  Those beginning with A represent more human activity and pollution.
  • Peer review – The process where studies are sent to other scientists before publication.  They check that methods were good and that the conclusions are correct.
  • Aerosols – Tiny particles floating in the air.  These are pollution, and cause acid rain and breathing problems, so we are trying to get rid of them.  But they also reflect sunlight back into space and have kept the climate of the last century lower than it would have been.  Temperatures will rise as we clean them up.

Edit 04 Feb 2013:  if you found this video interesting/useful, here are links to two others.

    Index

    * These are the key sections to watch if you have limited time.

    Thanks to Simon Carn (@simoncarn) for tweeting the link to the talk.

    Categories: Uncategorized

    Easily change coordinate projection systems in Python with pyproj

    Python is an easy-to-use programming language which, thanks to a growing number of cool extension modules, is really taking off in the world of scientific data handling.  The Proj4 libraries are a set of programs for performing coordinate system transformations.  Both are open source, so you are free to install them on as many computers as you want and to share them with your friends.  I had been using both for a while but only recently discovered the pyproj module that performs coordinate transformations inside Python itself.  It makes life very easy.

    Pyproj can be installed via the pip package manager (pip install pyproj).

    1.) Setting up coordinate systems

    The first step is to define pyproj ‘objects’ to represent the coordinate systems that you want to use.  These can be defined using the Proj notation (see Proj4 documentation for details) but it is easier to set up commonly-used projections by referring to their standard code numbers.  These are called EPSG codes and can be looked up on spatialreference.org.

    import pyproj # Import the pyproj module 
     
    # Define a projection with Proj4 notation, in this case an Icelandic grid 
    isn2004=pyproj.CRS("+proj=lcc +lat_1=64.25 +lat_2=65.75 +lat_0=65 +lon_0=-19 +x_0=1700000 +y_0=300000 +no_defs +a=6378137 +rf=298.257222101 +to_meter=1") 
     
    # Define some common projections using EPSG codes 
    wgs84=pyproj.CRS("EPSG:4326") # LatLon with WGS84 datum used by GPS units and Google Earth 
    osgb36=pyproj.CRS("EPSG:27700") # UK Ordnance Survey, 1936 datum 
    UTM26N=pyproj.CRS("EPSG:32626") # UTM coords, zone 26N, WGS84 datum 
    UTM27N=pyproj.CRS("EPSG:32627") # UTM coords, zone 27N, WGS84 datum 
    UTM28N=pyproj.CRS("EPSG:32628") # ... you get the picture  
    

    Note: older versions of pyproj use pyproj.Proj("+init=EPSG:4326") syntax and return coordinates in lon, lat order.

    2.) Changing between different coordinate systems

    In most cases, you will want to change between coordinate systems.  This is even the case with GPS or GoogleEarth data, which use the specific WGS84 datum.  Coordinate system changes are done with the transform function.

    pyproj.transform(wgs84, isn2004, 63.983, -19.700)                                                                                             
    # (1665725.2429655408, 186813.3884751596)
    

    And when you have lots of data, transformations can be done with lists/tuples/arrays:

    lon = [-19.5, -19.7, -19.9] 
    lat = [63.183, 63.583, 63.983] 
    xx, yy = pyproj.transform(wgs84, isn2004, lat, lon)                                                                                          
    xx                                                                                                                                           
    # [1674812.314071126, 1665231.44553604, 1655933.043340466]
    yy                                                                                                                                           
    # [97526.59264212535, 142220.3063699659, 186937.313488422]
    

    It’s a simple as that.

    For other systems, check out the pyproj website.  If you are playing with coordinate transforms, then it is likely that at some point you are going to want plot stuff on a map.  Python can do maps, too;  check out the Cartopy, Fiona and Shapely libraries.  Taking things even further, see the following of how to do GIS analysis using only Python with the Geopandas library: https://github.com/BritishGeologicalSurvey/geopandas-demo

    British National Grid and the OSGB36 datum.

    People working in the UK may have to go through another step to convert their data into the British National Grid format (BNG), which uses two-letter codes to define 100km-wide square regions instead of presenting the full 13-figure coordinates.  Thus Arthur’s Seat, an extinct volcano in the centre of Edinburgh, has a BNG grid reference of NT2755072950.

    The original version of this blog post contained a code snippet that converted between alphanumeric grid references and OSGB36 coordinates.  It has since been converted into a standalone Python module.  For instructions on how to install and use it, see https://pypi.org/project/bng/.

    Happy mapping!

    Update 2019-02-26 to use pyproj version 2.5.0 syntax.

    Categories: Uncategorized

    A visual estimate of the proportions of mixtures: pumice vs. lithics

    When a volcano erupts explosively, the tephra that comes out is a mixture of material that was molten at the time and bits of other old, cold rock that happened to get caught up in the blast.  These are referred to as the juvenile and the lithic components and consist of bubbly, pumice-like fragments and of chunks of lava and hydrothermally-altered material, respectively.

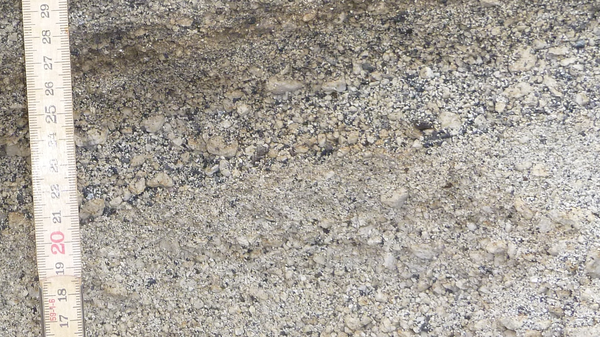
    Lithic-rich deposits from the explosive Hekla 4 eruption. The yellow-grey-white grains are juvenile pumice, the dark grains are lava lithics that were caught up in the eruption. I reckon that there are up to 40% lithics here. How about you? Click to enlarge.

    The relative proportions of juvenile and lithic grains can tell us something about the eruption.  For example, if the deposits are full of lithics, it might indicate that the vent where the material was erupting was getting wider or that underground water was coming into contact with the magma and turning explosively into steam, breaking up the surrounding rocks in the process.

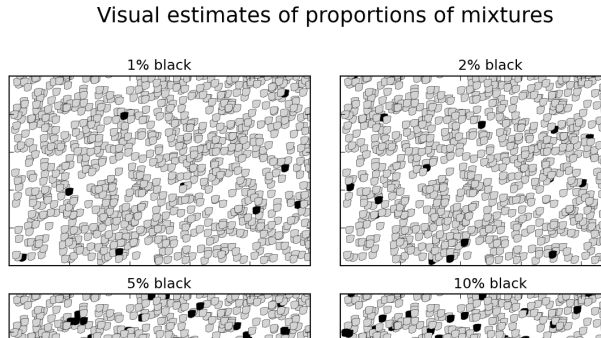
    The best way to measure the relative proportions of juvenile and lithic grains in a sample is to get out the tweezers and separate them by hand, but this is often impractical, and a lot of time a visual estimate is sufficient.  Visual estimates are a lot better if you have some known values to compare them with.  That’s where the chart comes in.

    Visual estimates of the proportions of mixtures

    The following chart gives examples of what mixtures of different proportions look like.  Download it, print copies, use it whenever you need to make visual estimates of proportions of mixed materials.

    A chart demonstrating the visual appearance of mixtures of different proportions. Click to see the full-size version, or use 'Right-click, Save As...' to download a copy.

    Make your own charts

    The charts were made using the Python programming language.  The source code is given below so that you can make and customise your own plots.  If you are learning Python, try messing around with the code.  First try changing the numbers and sizes of grains; next change the number of plots and give the grey grains different shapes to the black ones; finally, try plotting mixtures of 3 different grain types, each with different size distributions.  Happy hacking!

    import numpy as np
    import matplotlib.pyplot as plt
    
    number=1000
    x = np.random.rand( number )
    y = np.random.rand( number )
    percentages=[1, 2, 5, 10, 20, 30, 50, 75]
    fig = plt.figure(figsize=(8.27,11.69))
    
    for i in range(8):
        percent=percentages[i]
        black = np.round( percent*(number/100.0) )
        color = np.array( black*['black'] + (number-black)*['lightgrey'] )
        np.random.shuffle(color) #randomise so black aren't all at the bottom
        # define a marker shape here to make something that looks more like rocks
        marker=[(0.17,0.12),(0.15,0.42),(0.14,0.75),(0.35,0.87),(0.68,0.90),
                (0.98,0.86),(0.90,0.29),(0.72,0.14),(0.45,0.05),(0.17,0.12)]
        ax=plt.subplot(4,2,i+1)
        plt.scatter(x, y, color=color, s=60, linewidth=0.25, edgecolors='black',
                    marker=(marker,0))
        plt.xlim(0,1)
        plt.ylim(0,1)
        plt.title('%i%% black' % (percent), fontsize=12)
        ax=plt.gca()
        ax.xaxis.set_ticklabels([])
        ax.yaxis.set_ticklabels([])
    plt.subplots_adjust(left=0.05, right=0.95, bottom=0.05, hspace=0.15, wspace=0.1)
    plt.suptitle('Visual estimates of proportions of mixtures', fontsize=18, y=0.97)
    plt.suptitle('http://all-geo.org/volcan01010/2012/09/pumicelithicsproportions',
                 x=0.95, y=0.045, horizontalalignment='right',
                 verticalalignment='top', fontsize='x-small')
    plt.savefig('PumiceLithicsProportions.png', dpi=150)
    plt.ion()
    plt.show()
    
    Categories: Uncategorized

    Ten swimming pools of travel chaos

    An article published this week reveals the volume, grainsize and eruption rate characteristics of the tephra (volcanic ash, pumice and other materials) erupted during the eruption of Eyjafjallajökull in 2010.  This information is important because these are the inputs needed by computer simulations to predict where ash from an eruption is likely to be dispersed.  It is also interesting because the volume of ash that caused all that travel chaos in Europe turns out to be surprisingly small.

    Ten swimming pools?

    The group of scientists, led by the University of Iceland, combined measurements of tephra deposited on the ground, meteorological data, satellite data and theoretical models of ash dispersion to work out how much tephra was produced at the volcano at different times during the eruption, and to where it was dispersed.  I helped out with measurements of ash deposition across Europe.  The results were published as open access, so you can download the article and read them for yourself here.

    The total mass of erupted tephra was 480 million tonnes.  Most of this landed in Iceland, however, and only a tiny fraction (0.02%) of this made it as far as mainland Europe.  This ash consisted of tiny grains of pulverised rock between 1 and 50 millionths of a metre (microns) across.  For comparison, an individual red blood cell is about 6-8 microns in diameter.

    Now, a cubic metre of dense Eyjafjallajökull magma would have a mass of about 2.6 tonnes.  It would look like rocky grey washing machine, but with no door.  So if you compacted all the ash in Europe back into a single lump, it would have a volume of 36,000 cubic metres.  This would form a cube with 33 metre sides.  It would look like a rocky grey 11-storey building, but with no windows.

    To continue in the Olympic spirit, we can calculate how many swimming pools this would fill.  The standard competition pool is 50 x 25 x 2 m, but the one in London was actually 3 m deep, so that waves would be reduced and the swimmers could go faster.  The volume is therefore 3750 cubic metres.

    This means that, theoretically, all the travel chaos of Eyjafjallajökull was caused by magma with a volume of only ten Olympic-sized swimming pools.

    This seems unbelievable, but remember that huge volumes of air get sucked through jet engines, so even low ash concentrations can quickly add up to trouble.  Airlines now have to take special measures if the concentration exceeds two thousandths of a gram per cubic metre, so to keep aeroplanes out of your swimming pool needs only 7.5 grams of tephra.  That’s about a quarter of a teaspoon.

    EDIT (30 Aug 2012): Of course, the chaos wasn’t caused by the ash itself, but by the rules that stopped planes from flying where the ash might be.  These were changed as the Eyjafjallajökull 2010 eruption was ongoing, and the 2 milligrams per cubic metre limit was introduced.  This means that you can now have a much more powerful eruption in Iceland, but with much less disruption.

    In fact, we already have: http://all-geo.org/volcan01010/2012/04/an-icelandic-eruption-100-times-more-powerful-than-eyjafjallajokull/

    Categories: Uncategorized

    Iceland horse fun

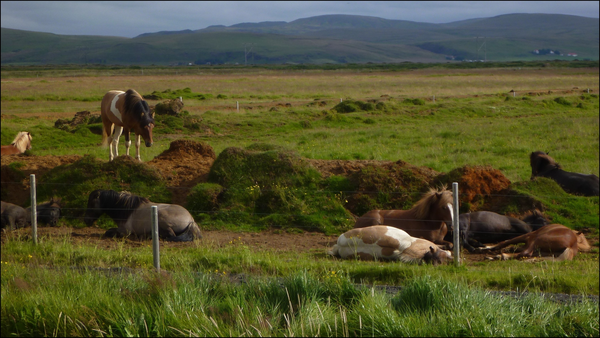
    Ever the practical joker, Dobbin thought it would be hilarious to rohypnol the water trough…

    Iceland horse fun

    Click for large version

    Comments Off on Iceland horse fun
    Categories: Uncategorized

    Fieldwork update: Progress map, river crossings and bulldozers

    This is a quick post to let you know how the fieldwork is going so far.

    Sampling the distal deposits of Hekla’s largest eruptions since the ice age

    The aim of my project is to sample the deposits of the two largest explosive eruptions from Mt Hekla since the end of the ice age.  The tephra (pumice + ash) from these eruptions is found all over Iceland, as well as across mainland Europe.  The measurements made this summer will be combined with analysis of the samples to give us a much better idea of what these eruptions were like (e.g. how high the plume reached, how much very fine ash was produced).  Then we can work out the likely results if it happens again.

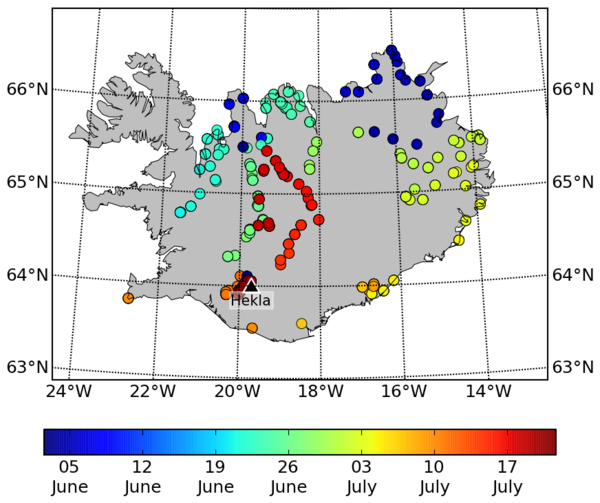
    Because the ash is all over Iceland, I have had to go all over Iceland, as the map shows.

    Photo locations for the first 7 weeks

    The map was created using the information stored in 'geotagged' photos. The colour of the dots tells when the photo was taken, and the map shows everywhere that I have been in the first 7 weeks. Click to enlarge.

    The first two months were very successful, as Iceland has had record-breakingly good weather.  I’ve had a number of babysitters who have come and looked after me along the way, including Al Monteith, who blogged about his time here.  His blog has lots more detail and photos of what we have been up to: http://alasdairmonteith.blogspot.com/2012/07/iceland-round-up.html

    Iceland by converted ambulance

    My home for my time in Iceland is a Volkswagen T4 Synchro van. It used to be an ambulance, and still has medicine cabinets, a bracket for hanging a saline drip, and the switch to turn on the siren (which has disappointingly been disconnected).  The daily routine of wake, eat, drive, dig, drive, dig, eat, drive, dig, drive, dig, cup of tea, drive, dig, eat, computer, whisky, sleep is a very efficient way of covering the ground.  Additional buy food, buy petrol, hot tub! mixes things up a bit.

    As well as being fairly large and very comfortable, the van is also very capable, as the video beneath shows.

    Pumice, pumice, pumice

    The aim of the first part of the summer was to check that the ash covers as much of Iceland as was previously thought (it does), and to collect lots of samples of it (248 so far).  I had a few days at home this week, where I had my only 3 nights sleep under a roof since late May, and a few days in Reykjavik sorting out repairs and supplies.  Now we are all set to head back out to the field tonight.

    This time the aim is to sample material closer to the volcano.  This is where most of the material fell, including thick deposits of pumice.  It’s hard work digging the holes to find the bottom when there is so much material, but if you ask nicely, sometimes you can get a helping hand.

    Categories: Uncategorized

    Glacier of the mountains of the islands

    Everyone has heard of Eyjafjallajökull. Not everyone can pronounce it.

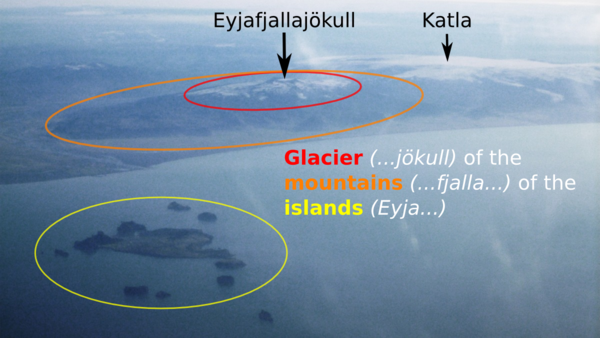
    It is almost as infamous for its long name than for the travel disruption that it caused. But the name is much easier when you break it down into its component parts. These are Eyja (islands), fjalla (mountains) and jökull (glacier). The origin of each part is clear when you see the volcano from the air.

    Eyjafjallajökull from above

    Eyjafjallajökull's name comes from the islands offshore, as seen in this view from above. Click for larger version.

    The islands after which the volcano is named are the Vestmannaeyjar (or the Westman Islands). The largest is Heimay, where an eruption in 1973 partly buried a small town and the residents famously pumped seawater onto advancing lava flows in an attempt to divert their course. Out of view, below the bottom of the picture is the island of Surtsey, which was born out of the Atlantic during an eruption from 1963-1967.

    In the upper right of the picture is the Myrdalsjökull glacier that covers Katla volcano. Since 2010, Katla has been more widely known as ‘that-volcano-next-door-that’s-even-bigger-than-the-unpronounceable-one’. Katla gets restless every summer, and is rumbling again now. You can see plots of earthquakes at the volcano over the last 48 hours (Icelandic Met Office) and over the last 2 years (Edinburgh University). It might erupt.  Or it might not.  The eruption might be bigger, but the disruption in Europe will probably be less than Eyjafjallajökull 2010, mainly because of changes to aviation rules.

    Aeroplane-window geology

    A tip for those flying from Iceland to the UK is to take a left-hand side window seat. If it is clear (if….), then you get spectacular views of lava flows, rivers, fault lines, glaciers and volcanoes all along the south coast of the country. Equally, chose a right-hand seat for flights from the UK. On summer evenings, these also provide the rare experience of seeing the sun rise in the (north) west.

    This photo was taken in August 2011, on a flight from Keflavik to Glasgow. Erik Klemetti’s recent aeroplane-window pictures of Californian volcanoes on the Eruptions blog were the inspiration to post it now. I also wrote another aeroplane-geology-based post, On Transatlantic Flight, about a year ago.  It explains how the Atlantic ocean is actually younger than the fuel burned to cross it.

    Categories: Uncategorized

    On the geology of Prometheus

    Contrary to the advice of pretty much everyone that has seen it, I went to see Prometheus at the weekend. A big reason for going was that I knew they had filmed part of it in Iceland. I had seen the film crews when I was working in the Hekla area last summer and I was curious to see how it looked on the big screen.

    In the film, a spaceship lands upon the black rocky surface of a distant planet. The door opens and the crew drive off across the dusty waste to the alien base, with huge mountains towering above them on all sides.

    How much of this is Iceland?

    Futuristic all-terrain vehicles race across the dusty landscape of a distant and unfamiliar planet. Steep, dark peaks rise menacingly in the background.

    Answer: The soil.

    Only the soil is Iceland. A jagged lava flow (aa, or slabby-pahoehoe) covers the floor of the valley, and has since been partly-buried by repeated eruptions of ash and pumice from Hekla.

    Everything above the flat plain is computer trickery.

    A real-life active volcano

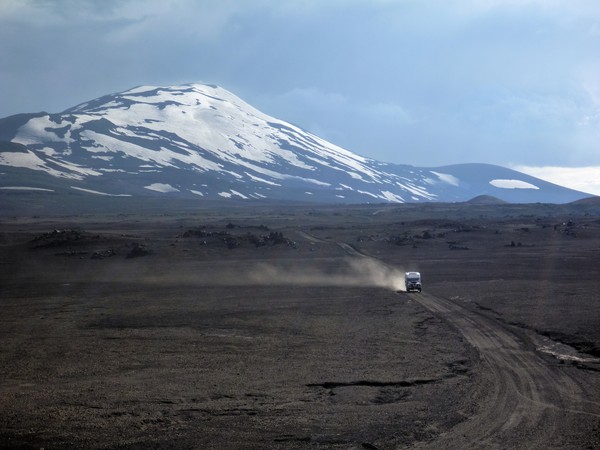
    An old landrover races across the dusty landscape of our very own planet, Earth. Hekla rests peacefully in the background.

    A look at real-life Hekla shows the part-buried lava landscape. It looks like the dust clouds from the vehicles that they used in the film were probably real. It looks like the mountains of Iceland, however, were not dramatic enough to make it into the film.

    Hekla is one of Iceland’s most active volcanoes, with recent eruptions in 1947, 1980, 1991 and 2000. Each of these began explosively, producing pumice and ash (also called tephra), but quickly switched to producing lava. There have also been much larger explosive eruptions in the past, such as in 1104, which destroyed local farms, and two prehistoric eruptions about 3000 and 4000 years ago which covered most of the country in ash. Ash grains from these eruptions can be found in Scotland and Scandinavia.

    Further reading

    When Googling an image for this post, I came across an article on Alien Prequel News reporting that the Prometheus crew had also been filming in north Africa and the Middle East. It seems that the distant mountains, with their horizontal sedimentary layers, are sandstones from Wadi Rum, Jordan.

    The Science Punk blog has a nice article (The Science of Prometheus) highlighting the logical flaws and plot holes of the film. There are many, including the one that annoyed me the most: how did the facehugger grow to giant size with no obvious food source?

    See a bit more of Hekla, including the huge scale of the prehistoric eruptions, in a post I wrote about them during my fieldwork last year.

    Categories: Uncategorized

    Insight into climate debate at the Volcanism and the Atmosphere conference

    Last week was the American Geophysical Union (AGU) Chapman Conference on Volcanism and the Atmosphere in Selfoss, Iceland. It covered topics such as explosive eruptions, satellite detection of volcanic ash, aviation hazards and climate modelling. Unlike larger meetings, where sessions run in parallel like the stages at a music festival, all the presentations happened in one room and everyone went to all of them. This way, instead of sticking to the geology sessions (normally filled with pictures of hammers in exotic locations), I saw a lot of talks from other fields. These included a lively debate about how the effects of volcanic eruptions are preserved in the tree ring climate record, which is the subject of this post.

    Live tweeting from the conference

    Much of the conference was reported live on Twitter.  You can find the conversation by searching for the hashtag #AGUVolcAtm.   After the speakers have agonized over their presentations in order to fit them into the 15 minute time slot, it’s fun to see them subsequently mashed into less than 140 characters by the audience. There are also 300 word summaries (abstracts) of the presentations available online here.

    Volcanic eruptions and climate

    The connection between volcanoes and climate is a result of the gases produced during eruptions.  These include sulphur dioxide and carbon dioxide. It is the sulphur dioxide (SO2) that provides the main influence on climate, as it reacts in the atmosphere to form sulphuric acid aerosol (H2SO4). An aerosol is a suspension of tiny solid or liquid particles in a gas. The sulphuric acid particles reflect incoming radiation from the Sun back into space. If the gas is injected into the stratosphere, the aerosol can remain aloft for years. In this way, large volcanic eruptions cool the surface of the Earth.  Of course, it’s a bit more complicated than I have just explained, and many of the presentations explored the details of the process.

    Climatically speaking, volcanic carbon dioxide (CO2) is of minor importance, as the amount of gas that volcanoes emit is dwarfed by human emissions; the average annual global volcanic CO2 emission rate is equivalent to that of a moderately-sized country such as Poland. Other volcanic gases such as chlorine and fluorine have atmospheric effects such as breaking down ozone in the stratosphere.

    Genuine climate debate

    A highlight of the conference was a pair of consecutive talks by Michael Mann and Rosanne  D’Arrigo about the signals from past volcanic eruptions in the tree ring record. As a geologist, the exchange gave insight into the topics being debated at the cutting edge of climate science.

    That debates exist between climate scientists is sometimes reported as an indication that the foundations of the whole field are unsteady, but this is a misunderstanding of how science works. Arguments over details are common, and indeed necessary to refine our understanding, but often reflect just a fragment of a bigger picture. Two palaeontologists may argue over whether Tyrannosaurus Rex had feathers, but both would agree on the bigger point that they share a common ancestor with the beast.

    Here, both Mann and D’Arrigo agree on long term trends in the tree ring record (they must, because Mann’s study uses data produced by D’Arrigo) and that the Earth is warming. But each scientist’s passionate defence of their own ideas shows that consensus on the short term effects of volcanic eruptions on the tree ring record is yet to be reached. Both talks were clear, logical, detailed, and absorbed everyone in the room. This is genuine climate debate and it is fascinating to watch.

    Underestimation of Volcanic Cooling in Tree-Ring Based Reconstructions of Hemispheric Temperatures

    The <140 character version of Michael Mann’s talk is:

    .@MichaelEMann: Tree rings miss volcanic cooling spikes. Cold limits growth, but diffuse light from atmos aerosol boosts it. #AGUVolcAtm

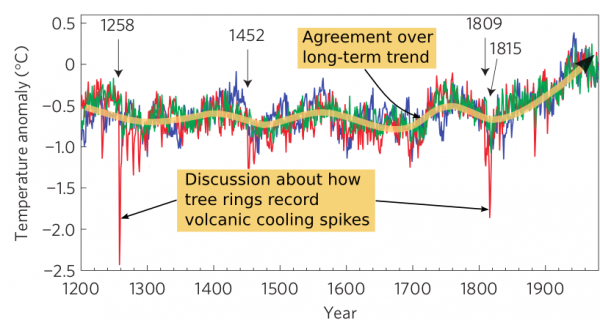
    It described his recent paper that suggests that tree rings underestimate volcanic cooling. Mann used a computer simulated climate, which he had shown to do a good job of estimating the cooling effect of recent eruptions, to calculate global temperature from 1200-1980 (red line below). It shows clear spikes associated with eruptions in 1258, 1452, 1809 and 1815. He also plotted temperatures from the same period as estimated from studies of tree ring widths (blue line). The spikes are missing. The new study tried to explain why the tree ring data were underestimating the cooling and missing the spikes.

    Figure from the Mann et al paper

    Modified version of Figure 2d from the paper by Mann and coworkers published in Nature. Click to visit the journal.

    The tree ring width data came from forests that are so high up mountains or so close to the poles that the trees are clinging on to life at the very edge of where trees can survive. The growth of such trees has been shown to respond more to temperature changes than to other effects e.g. rainfall. Mann and colleagues used equations describing tree growth at different temperatures to predict what the trees would record given the temperatures in the computer-simulated climate (green line). They included a threshold temperature below which growth stops, a description of how diffuse light caused by atmospheric aerosols can help trees grow, and random local variations in weather conditions.

    The result is that the recorded cooling is reduced and, because the no-growth threshold resulted in some years with missing rings, the cooling appears delayed relative to the eruption. The calculated tree rings now show good agreement with the measured ones, leading Mann to conclude that his equations are describing real effects.

    Volcanic Signals in Tree-ring Records for the Past Millennium

    Next, Rosanna D’Arrigo took to the podium in defence of dendrochronology (tree ring dating) and launched into a point-by-point rebuttal of a number of Mann’s arguments. In 140 characters, it goes like this:

    D’Arrigo: BOOM! Tree ring widths aren’t as good as density and diffuse effect was measured on different forest type to rings. #AGUVolcAtm

    Her main point was that Mann’s use of tree ring width data was inappropriate, because tree ring width data are best suited to measuring longer-term trends in temperature. To look at volcanic cooling spikes, they should have used tree ring density data (maximum latewood density: MXD), which is more sensitive to short term changes. She described a study by Briffa and co-workers that picked up the cooling following the Tambora eruption in 1815. Mann had not mentioned this study in his paper.

    D’Arrigo said that the diffuse effect was recorded in forests with a thick canopy, which is unlike the areas where the tree rings were measured. She also pointed out studies showing the trees can grow at temperatures below Mann’s threshold, and that the missing rings were less common than he had suggested.

    The discussion continues

    D’Arrigo and her fellow dendrochronologists have prepared a formal response, so the debate will continue, in full public view, in the pages of scientific journals. At the meeting, it spilled over onto Twitter, with Mann agreeing that tree ring density (TRD) measurements are better than widths (TRW), but that “TRW dominate tree-ring temp recons”. Unfortunately, tree ring density data is more difficult and expensive to collect.

    From the sidelines, it doesn’t seem that the scientific problems are so serious. In time, more density measurements will be collected and the reconstructions will be improved.  Meanwhile, Mann’s ideas can be tested further and accepted or discarded depending on how well they stand up.  The real heat of the argument appears to result from Mann’s failure to emphasise that that tree rings CAN measure volcanic cooling spikes.  His study used tree ring widths because the data were most abundant, even though better methods exist. In the wider media, this made tree ring dating sound less useful than it is, which understandably annoyed the dendrochronologists.

    Other highlights in 140 characters or less

    Here are Twitter-sized summaries of some of the other talks at the meeting:

    • .@volcanofile: tropospheric volcanic sulphate -> whiter clouds -> global cooling. Better estimates of past emissions needed. #AGUVolcAtm
    • Alan Robock, Rutgers: 2011 eruption of Nabro, Eritrea, was largest sulfate producer since 1991’s Pinatubo. #AGUVolcAtm (sent by @alexwitze)
    • Foelsche: GPS signals between satellites bend as pass thru atmosphere; temperature controls bending -> can calculate atmos temp. #AGUVolcAtm
    • Foelsche: Now we need a big eruption to see if we can detect the effects. #AGUVolcAtm
    • Thor Thordarson: 560 cubic km of magma erupted in Iceland in last 11,000 years, since ice age ended. (That’s a lotta magma.) #AGUVolcAtm (sent by @alexwitze)
    • Miller: Baffin glaciers retreating -> 14C-date newly uncovered moss -> shows rapid lowering of snowline in 1450s -> LittleIceAge #AGUVolcAtm
    • Lavigne: named the 1257 (1258) ‘mystery’ #eruption but can’t reveal name due to ’embargo’ I suspect … #AGUVolcAtm (sent by @volcanofile)
    • Lavigne misunderstands journal embargoes. Nature & Science v clear. Talks allowed. http://bit.ly/qD1lt3 http://bit.ly/KXcqEo #AGUVolcAtm (sent by @alexwitze)
    • Prata: If ash conc < 200 microns/m3, can’t really detect w/satellite, but that’s OK b/c it’s not that dangerous to planes. #AGUVolcAtm (sent by @alexwitze)
    • Prata: #Eyjafjallajokull yielded some 10 sci papers per teragram of ash emitted. #AGUVolcAtm (sent by @alexwitze)
    • Krueger: Strong eruption -> increased winds in Southern ocean -> limits transport to Antarctica -> reduced sulphate in ice core. #AGUVolcAtm
    • Elkins-Tanton: Siberian Traps magma chambers in hydrocarbon+evaporite basin -> adds extra S+Cl+F. To 3000000km3 basalt! Nasty! #AGUVolcAtm
    • Brian Toon: ‘noctilucent #clouds after large #eruptions could indicate that water was injected in stratosphere’ #AGUVolcAtm (sent by @volcanofile)
    • Graf: ‘romantic sunsets after big #eruptions … Need to watch birth rates … with implications for geo-engineering’ #AGUVolcAtm (sent by @volcanofile)

    Other reports from the conference

    Categories: Uncategorized