Ever since European airspace was temporarily shut down during the 2010 eruption of Eyjafjallajökull, aircraft in the region have been allowed to fly through parts of volcanic ash clouds where the concentration is low. Satellite-based infrared sensors can be used to estimate ash cloud concentration, as well as other parameters such as grain size and height, in a process called a retrieval. Last month’s How do satellites map volcanic ash clouds? post explains how it works. The retrieved information, as well as data from computer simulations and other satellite- and ground-based sensors, is used to map the likely concentrations of airborne volcanic ash. The results inform decisions about where aircraft can fly.
There are few direct measurements from within ash clouds, so we must look for other information in their deposits on the ground. At large distances from a volcano (over 500 km) these exist as cryptotephra (hidden ashes) that are extracted from peat bogs and lakes. These grains were some of the largest particles within the cloud from which they fell, so are not representative of the average size at that point. However, they must be a significant component of the ash clouds closer to their source.
This week we published a paper showing that Icelandic cryptotephra deposited in the UK and northwest Europe are much bigger than satellite infrared retrievals would suggest. Investigating the difference in results between measurement types, we found that this is partly because current satellite retrieval algorithms are biased towards smaller sizes. Our results will help quantify the uncertainty in estimates of volcanic ash cloud properties. This is important because if aircraft are to fly through low concentrations of ash, you need to know how sure you are that the concentration really is low. They also suggest that incorporating the irregular shapes of volcanic ash grains in computer simulations and satellite infrared measurements will lead to improved results.
The main findings are explained below.
Understanding the discrepancy between tephrochronology and satellite infrared measurements of volcanic ash
The paper was divided into three sections, reflecting three areas of study: tephrochronology, ash transport computer models and satellite-based infrared retrievals. Each section reports a new result. Another aim of the paper was to increase understanding between these different fields.
Big grains go far…
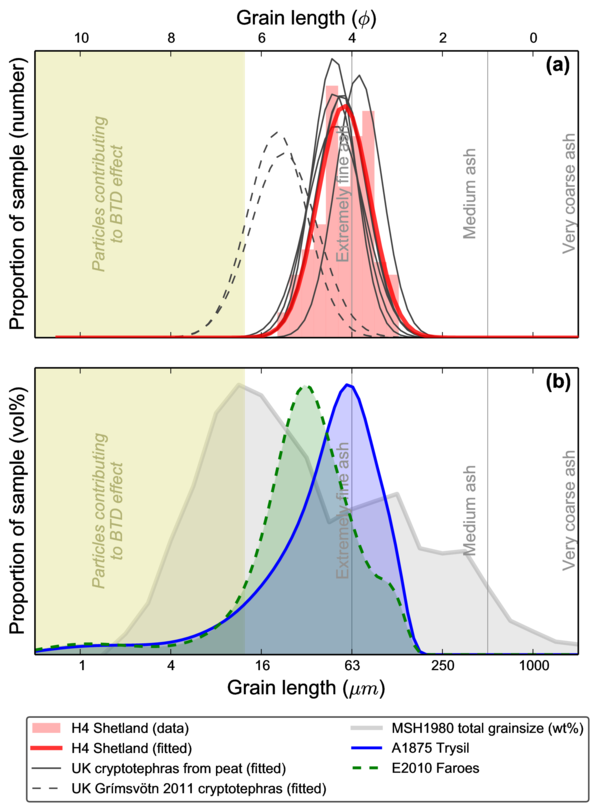
The graphs below show the size distributions of Icelandic ash grains from across the UK, including samples collected by the public during the Eyjafjallajökull 2010 and Grímsvötn 2011 eruptions. The top graph has results obtained by measuring grains down a microscope, the bottom results were collected by a laser technique. The microscope method misses grains <10 microns diameter, but both methods give similar peaks showing that the smallest grains are a minor component.

The size of cryptotephra grains from the UK and northwest Europe. Image from Stevenson et al. (2015), Atmos. Meas. Tech. doi:10.5194/amt-8-2069-2015. See paper for full caption and details.
The median length of the cryptotephra grains ranges from 17-70 microns, with 5% of grains coarser than 45-125 microns (similar to the width of a human hair). These are similar to the lengths of individual grains reported elsewhere. In comparison, published median diameters retrieved from satellite infrared data are less than ~6 microns (similar to the size of a red blood cell) and represent size distributions that contain tiny numbers of grains larger than 30 microns.
…in agreement with model predictions…
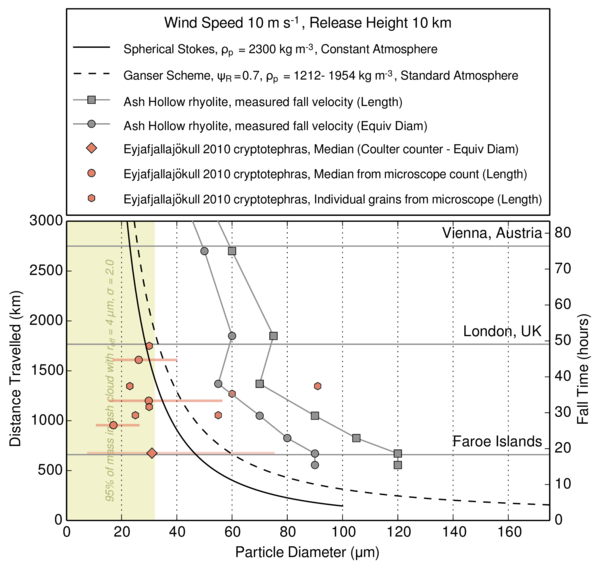
Imagine dropping a handful of volcanic ash particles from 10 kilometers high. This is similar to the height of the 2010 Eyjafjallajökull plume, but a big eruption could carry material two or three times higher. The next graph shows how far ash grains of different sizes falling in a constant wind would be carried before they reached the ground. It represents a very simplified scenario, with no weather or particle-particle interaction, but gives an idea of the sizes of particles that can be expected at different distances. The different lines represent different particle shapes. Data from Eyjafjallajökull are shown for comparison; many of these particles were erupted when the plume was low.

Calculated travel distances for ash grains of different sizes and shapes. Image from Stevenson et al. (2015), Atmos. Meas. Tech. doi:10.5194/amt-8-2069-2015. See paper for full caption and details.
Even under the modest conditions simulated here, ash grains with simple,
spherical, shapes up to 41 microns diameter can be airborne for 24 hours, and those up to 29 microns could reach London. Using more complex and realistic shapes increases the travel distance, sometimes by up to a factor of three.
…and satellite infrared retrievals underestimate their size.
To understand how coarser-grained ash clouds would appear in satellite retrievals, we created a series of virtual clouds with different grain size distributions in the Met Office computers. Then we calculated simulated satellite images that showed how they would appear to satellite-based infrared sensors. Finally, we fed that information into the ash-detection software and ‘retrieved’ ash cloud properties such as grain size and concentration. The assumptions used to simulate the ash clouds are the same as those used in the retrieval, so this is a test of the algorithm and not of the physics of ash detection.
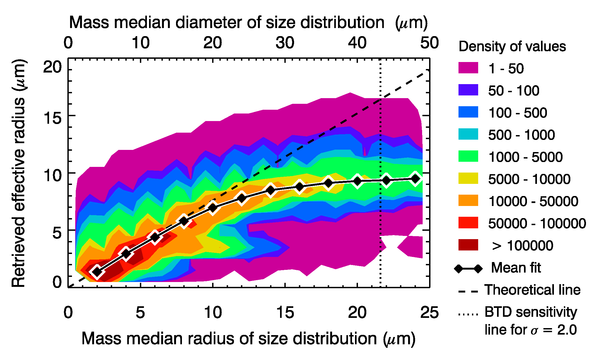
In the graph below, the x-axis is the size that we put in and the y-axis is the retrieved particle size. It is given in terms of the effective radius, which describes a distribution of particle sizes. The dotted line shows the answer that we would expect for a perfect retrieval. The diamonds mark the mean retrieved effective radius value.

Comparison between input and retrieved particle sizes from simulated satellite images. Image from Stevenson et al. (2015), Atmos. Meas. Tech. doi:10.5194/amt-8-2069-2015. See paper for full caption and details.
The retrieval algorithm uses various measurements, including the brightness temperature difference (BTD) caused by particles with a radius of less than 6 microns, to identify pixels in the images that contain volcanic ash. It then looks for the combination of ash cloud grainsize, concentration and height that would give the best match to the observations (including the BTD) based on the assumption that the grains are all dense spheres.
When the grainsize of the simulated ash cloud increases, the algorithm begins to miss more and more ash-containing pixels. This happens because the BTD effect gets weaker as the proportion of particles smaller than 6 microns decreases, so the cloud becomes harder to detect by this method. Trained forecasters may still be able to identify contaminated airspace by using other data, but retrievals of ash properties in these regions are not possible.
The graph shows that the mean effective radius is retrieved correctly for small particles, but reaches a maximum of around 9 microns for larger particles. This result is interesting because an ash cloud with an effective radius of 16 microns could contain a significant proportion of cryptotephra-sized grains. However, those values are rarely reported and published values are always 9 microns or less.
At larger grainsizes, it becomes harder to find a combination of parameters that give a good match to the observations. The retrieval becomes more strongly influenced by where you tell it to start looking. The influence of our chosen value of 3.5 microns, which is similar to airborne measurements of dilute ash clouds, is visible on the plot. Retrievals of the mass of volcanic ash also show deviations of over 40% from the input values.
Moving on from spherical grains?
Our results demonstrate that the grains in a volcanic ash cloud, hundreds of kilometers from the source, are up to several tens of microns in diameter. The proportion that these cryptotephra-sized grains represent within the airborne cloud is still unknown. Bias towards small grain sizes by retrieval algorithms may explain differences between cryptotephra- and satellite retrieval-based size distributions in such locations.
However…
Retrievals have also been made of ash clouds close to their source volcano. Here, the deposits contain grains with diameters of hundreds of microns. Again, the retrieved sizes are very low. This suggests two things about satellite retrievals:
- They are able to recognise a wider range of grain sizes than the current theory suggests should be possible.
- The underestimation of grain size is even more significant close to the source volcano.
We suggest that this is a consequence of the assumption that volcanic ash grains are dense spheres. This forces any ash cloud exhibiting a BTD to be interpreted as being dominated by fine-grained particles.

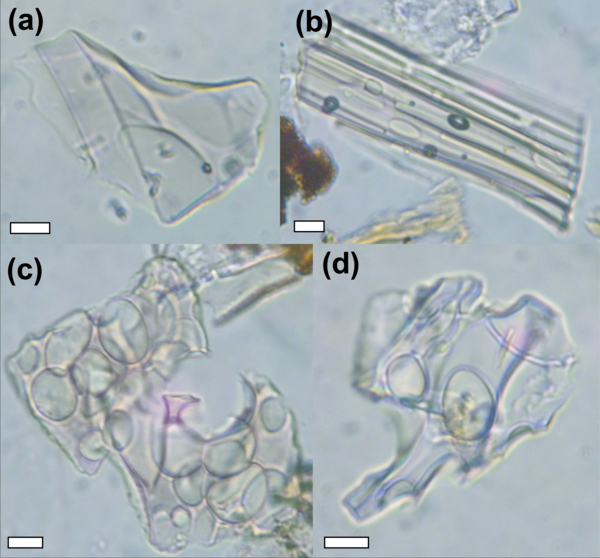
Photographs of cryptotephra grains. The scale bar is 10 microns long. These are not dense spheres. Image from Stevenson et al. (2015), Atmos. Meas. Tech. doi:10.5194/amt-8-2069-2015. See paper for full caption and details.
Cryptotephra grains are extremely irregular and bubbly, as demonstrated in the image above. If it is possible for bubbly particles to cause BTD effect at larger particle sizes, as was suggested by a recent study, then ash cloud size distributions could be much coarser than current interpretations suggest. Developing alternatives to the dense spheres approximation is therefore likely to improve agreement between ash cloud retrievals and the deposits on the ground.
Further reading
Our study was published in Atmospheric Measurement
Techniques, which is an open access journal. This means that anyone can download and read the full article for free by clicking on the link below:
- Stevenson JA, Millington SC, Beckett FM, Swindles GT, Thordarson T (2015) Big grains go far: understanding the discrepancy between tephrochronology and satellite infrared measurements of volcanic ash. Atmos Meas Tech 8:2069–2091. doi: 10.5194/amt-8-2069-2015
Atmospheric Measurement Techniques has an interactive peer review system, so the original version of the paper is also online, as a discussion manuscript, along with the reviewers’ comments. You can read those here:
- Stevenson JA, Millington SC, Beckett FM, Swindles GT, Thordarson T (2015) Big grains go far: reconciling tephrochronology with atmospheric measurements of volcanic ash. Atmos Meas Tech Discuss 8:65–120. doi: 10.5194/amtd-8-65-2015
There are many other blog posts on volcan01010 about ash clouds and Icelandic eruptions, such as Ash cloud closes UK airports: what are the chances?, Grímsvötn 2011 UK ash deposition and A history of ash clouds and aviation. There is a full list on the Every post ever page.


Pingback: A sedimentologist’s guide to volcanic particle grain size (and foetal development) | Volcan01010