Explosive eruptions can spread volcanic ash across continent-scale distances. Ash from the 2011 eruption of Chile’s Puyehue-Cordón Caulle volcano went right around the globe. The only realistic way of monitoring them is from space. Most people are familiar with the beautiful photos (visible light images) that satellite-based sensors can take but the most useful information for mapping volcanic ash clouds actually comes from invisible infrared light. This can be used to see ash clouds in the dark, to measure their altitude and even to give an indication of their grainsize and concentration. This post uses images from a spectacular eruption at Chile’s Calbuco volcano last week to explain how.
Visible light images
Imagine you are in charge of mapping the Calbuco ash cloud. Where is the atmosphere contaminated by ash? The middle of the cloud is obvious, as the tan-coloured ash is clear to see. But how can you define the edges? Do those wispy, white clouds in the southeast corner contain volcanic ash or are they just water droplets? Is there ash in that hazy region to the southwest?
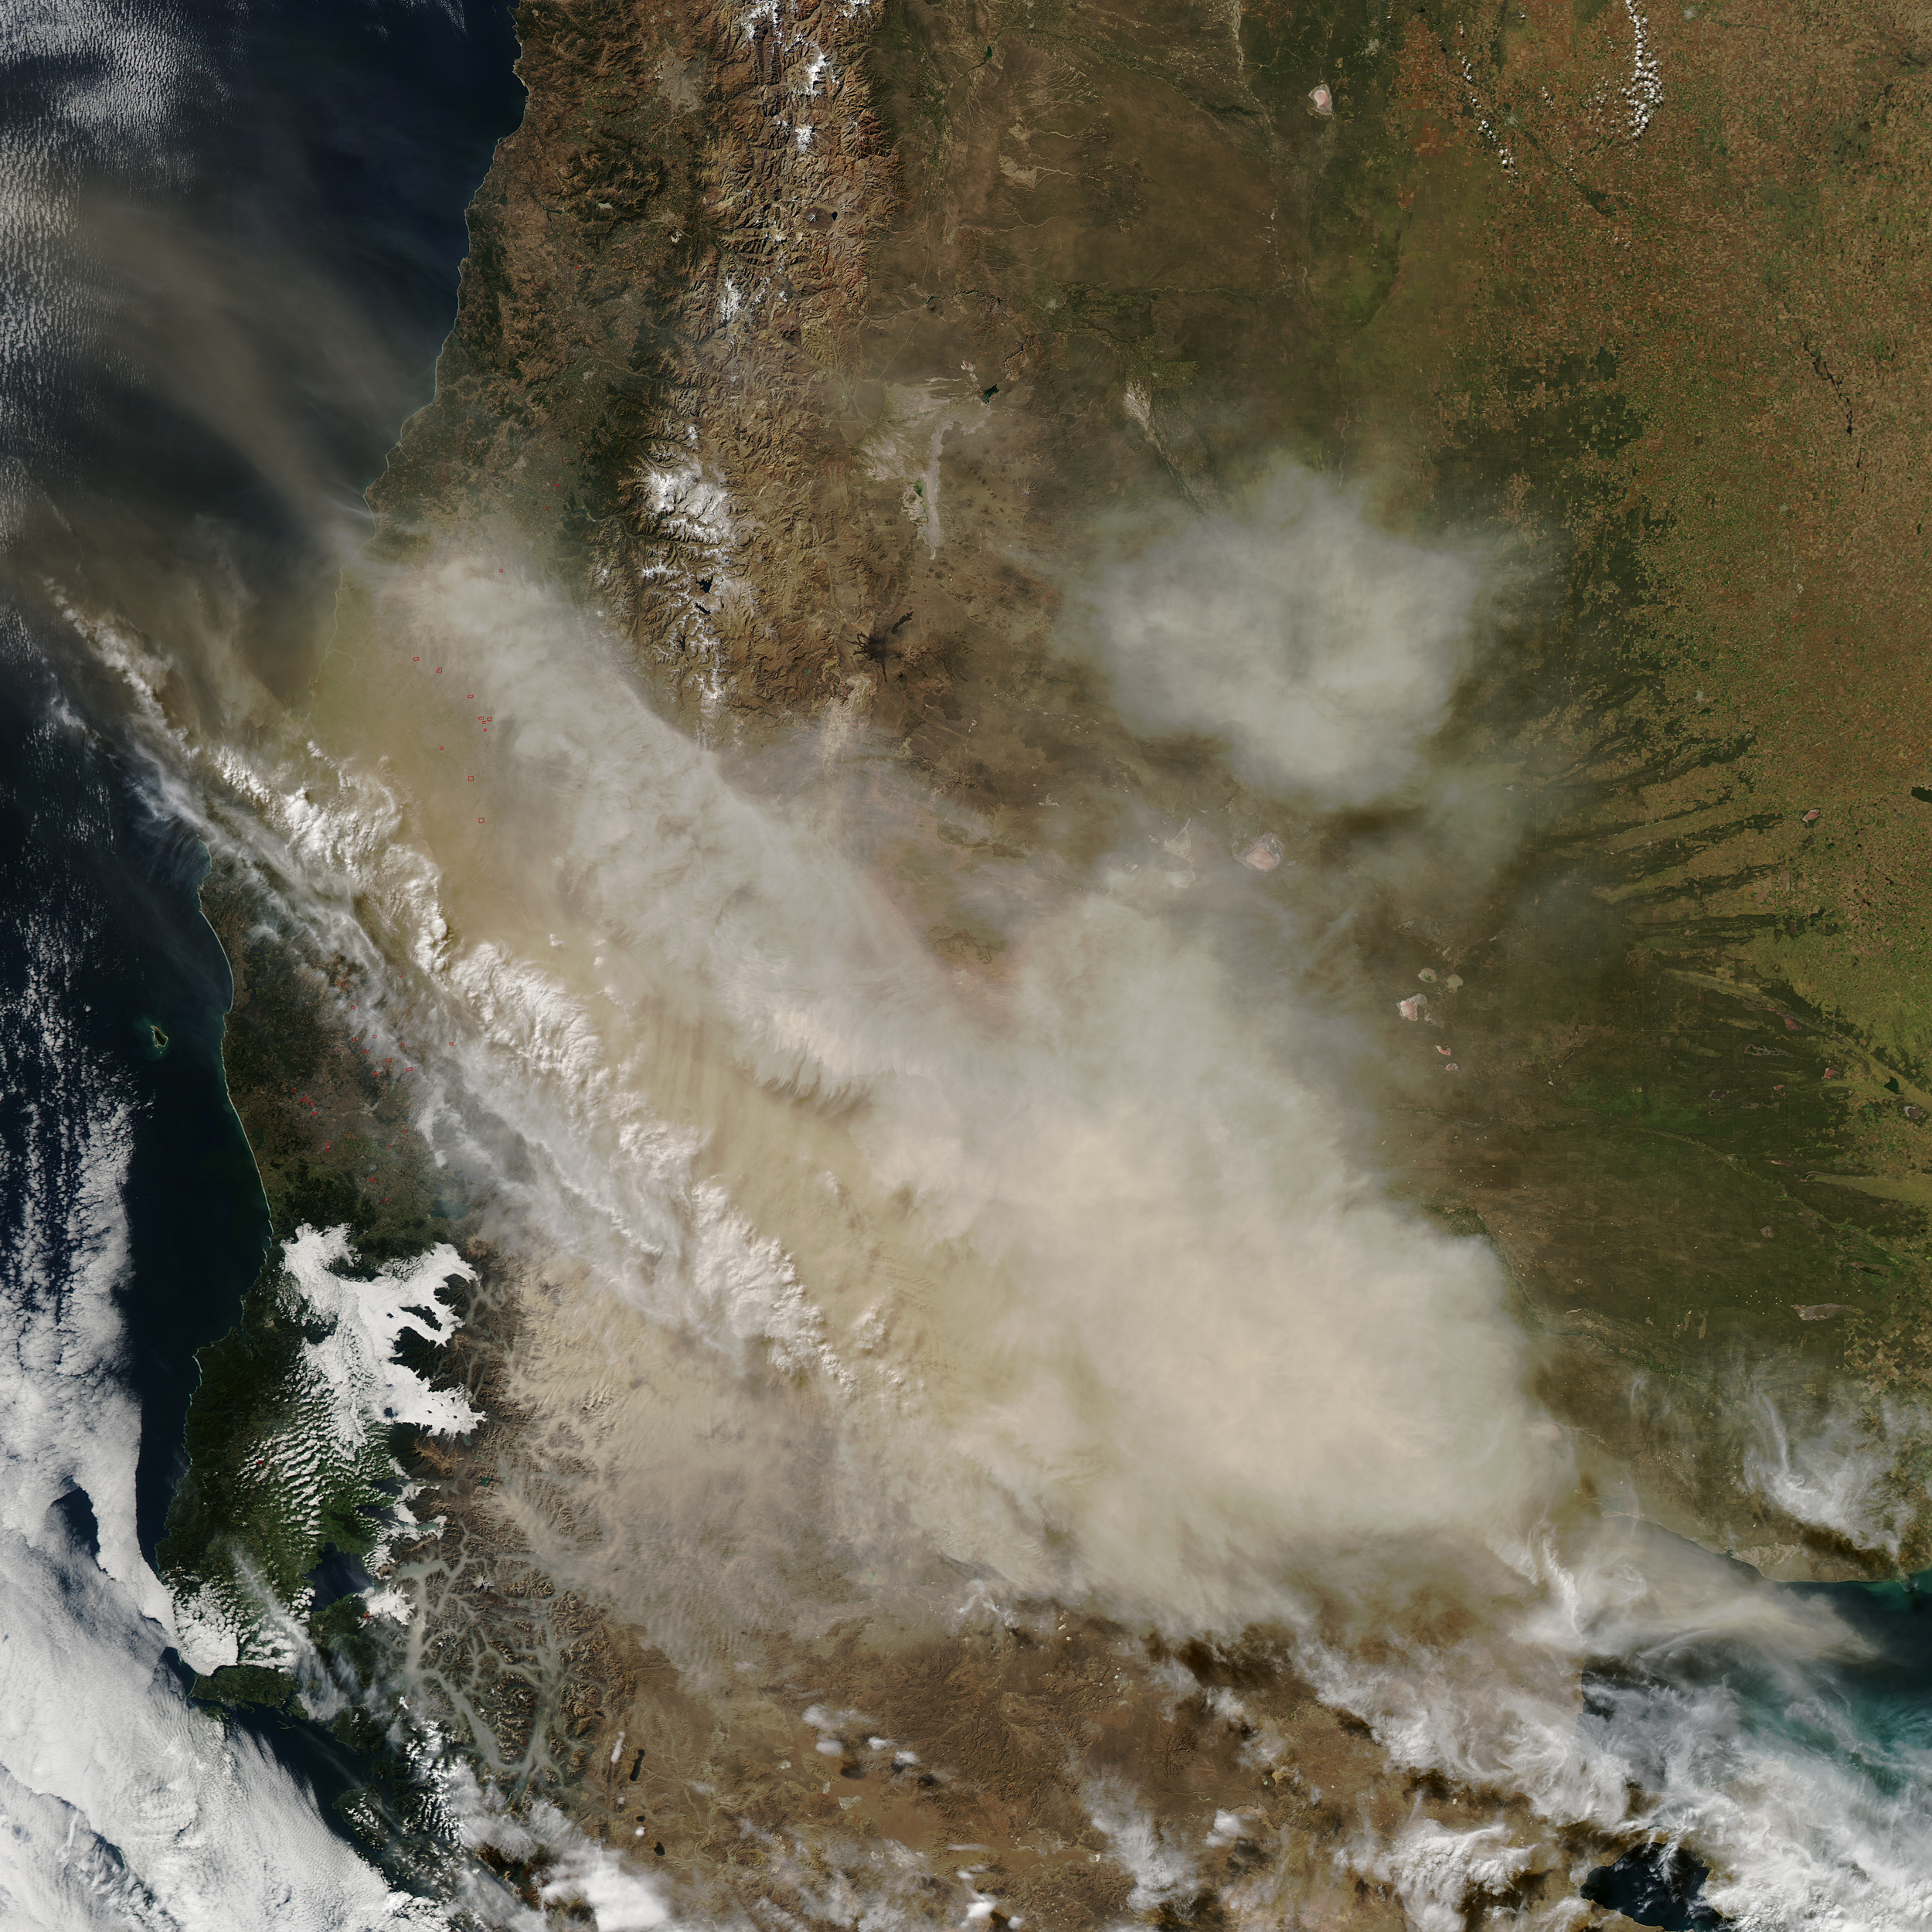
Natural-colour image of the Calbuco ash cloud, taken at 18:35 UTC on 23 April by the MODIS instrument on NASA’s Aqua satellite. Source: NASA Earth Observatory. Click the image to enlarge.
These questions can be tricky, but they aren’t your biggest problem. The airline industry needs updated maps every six hours, but night is coming soon. Visible light images rely upon reflected sunlight so they are only useful during the day. You cannot map ash clouds using satellite photos alone.
Infrared images
Everything in the Universe emits energy as electromagnetic radiation (e.g. heat, light, x-rays). Hotter objects radiate more energy, and at shorter wavelengths. You can calculate the amount of energy radiated at different wavelengths, by an object of a given temperature, using Planck’s law, which is just a way of saying that white hot is hotter than red hot, but with maths.
Most of the radiation emitted by the things around us e.g. clouds, hills, trees, buildings, students, traffic cones, is in the infrared region of the electromagnetic spectrum. It’s invisible to our eyes, but satellites have sensors that are very sensitive to it. Radiation is emitted all the time, so infrared measurements can be made during the day or the night. Furthermore, the amount of energy can tell us about the temperature, because hot things radiate more.
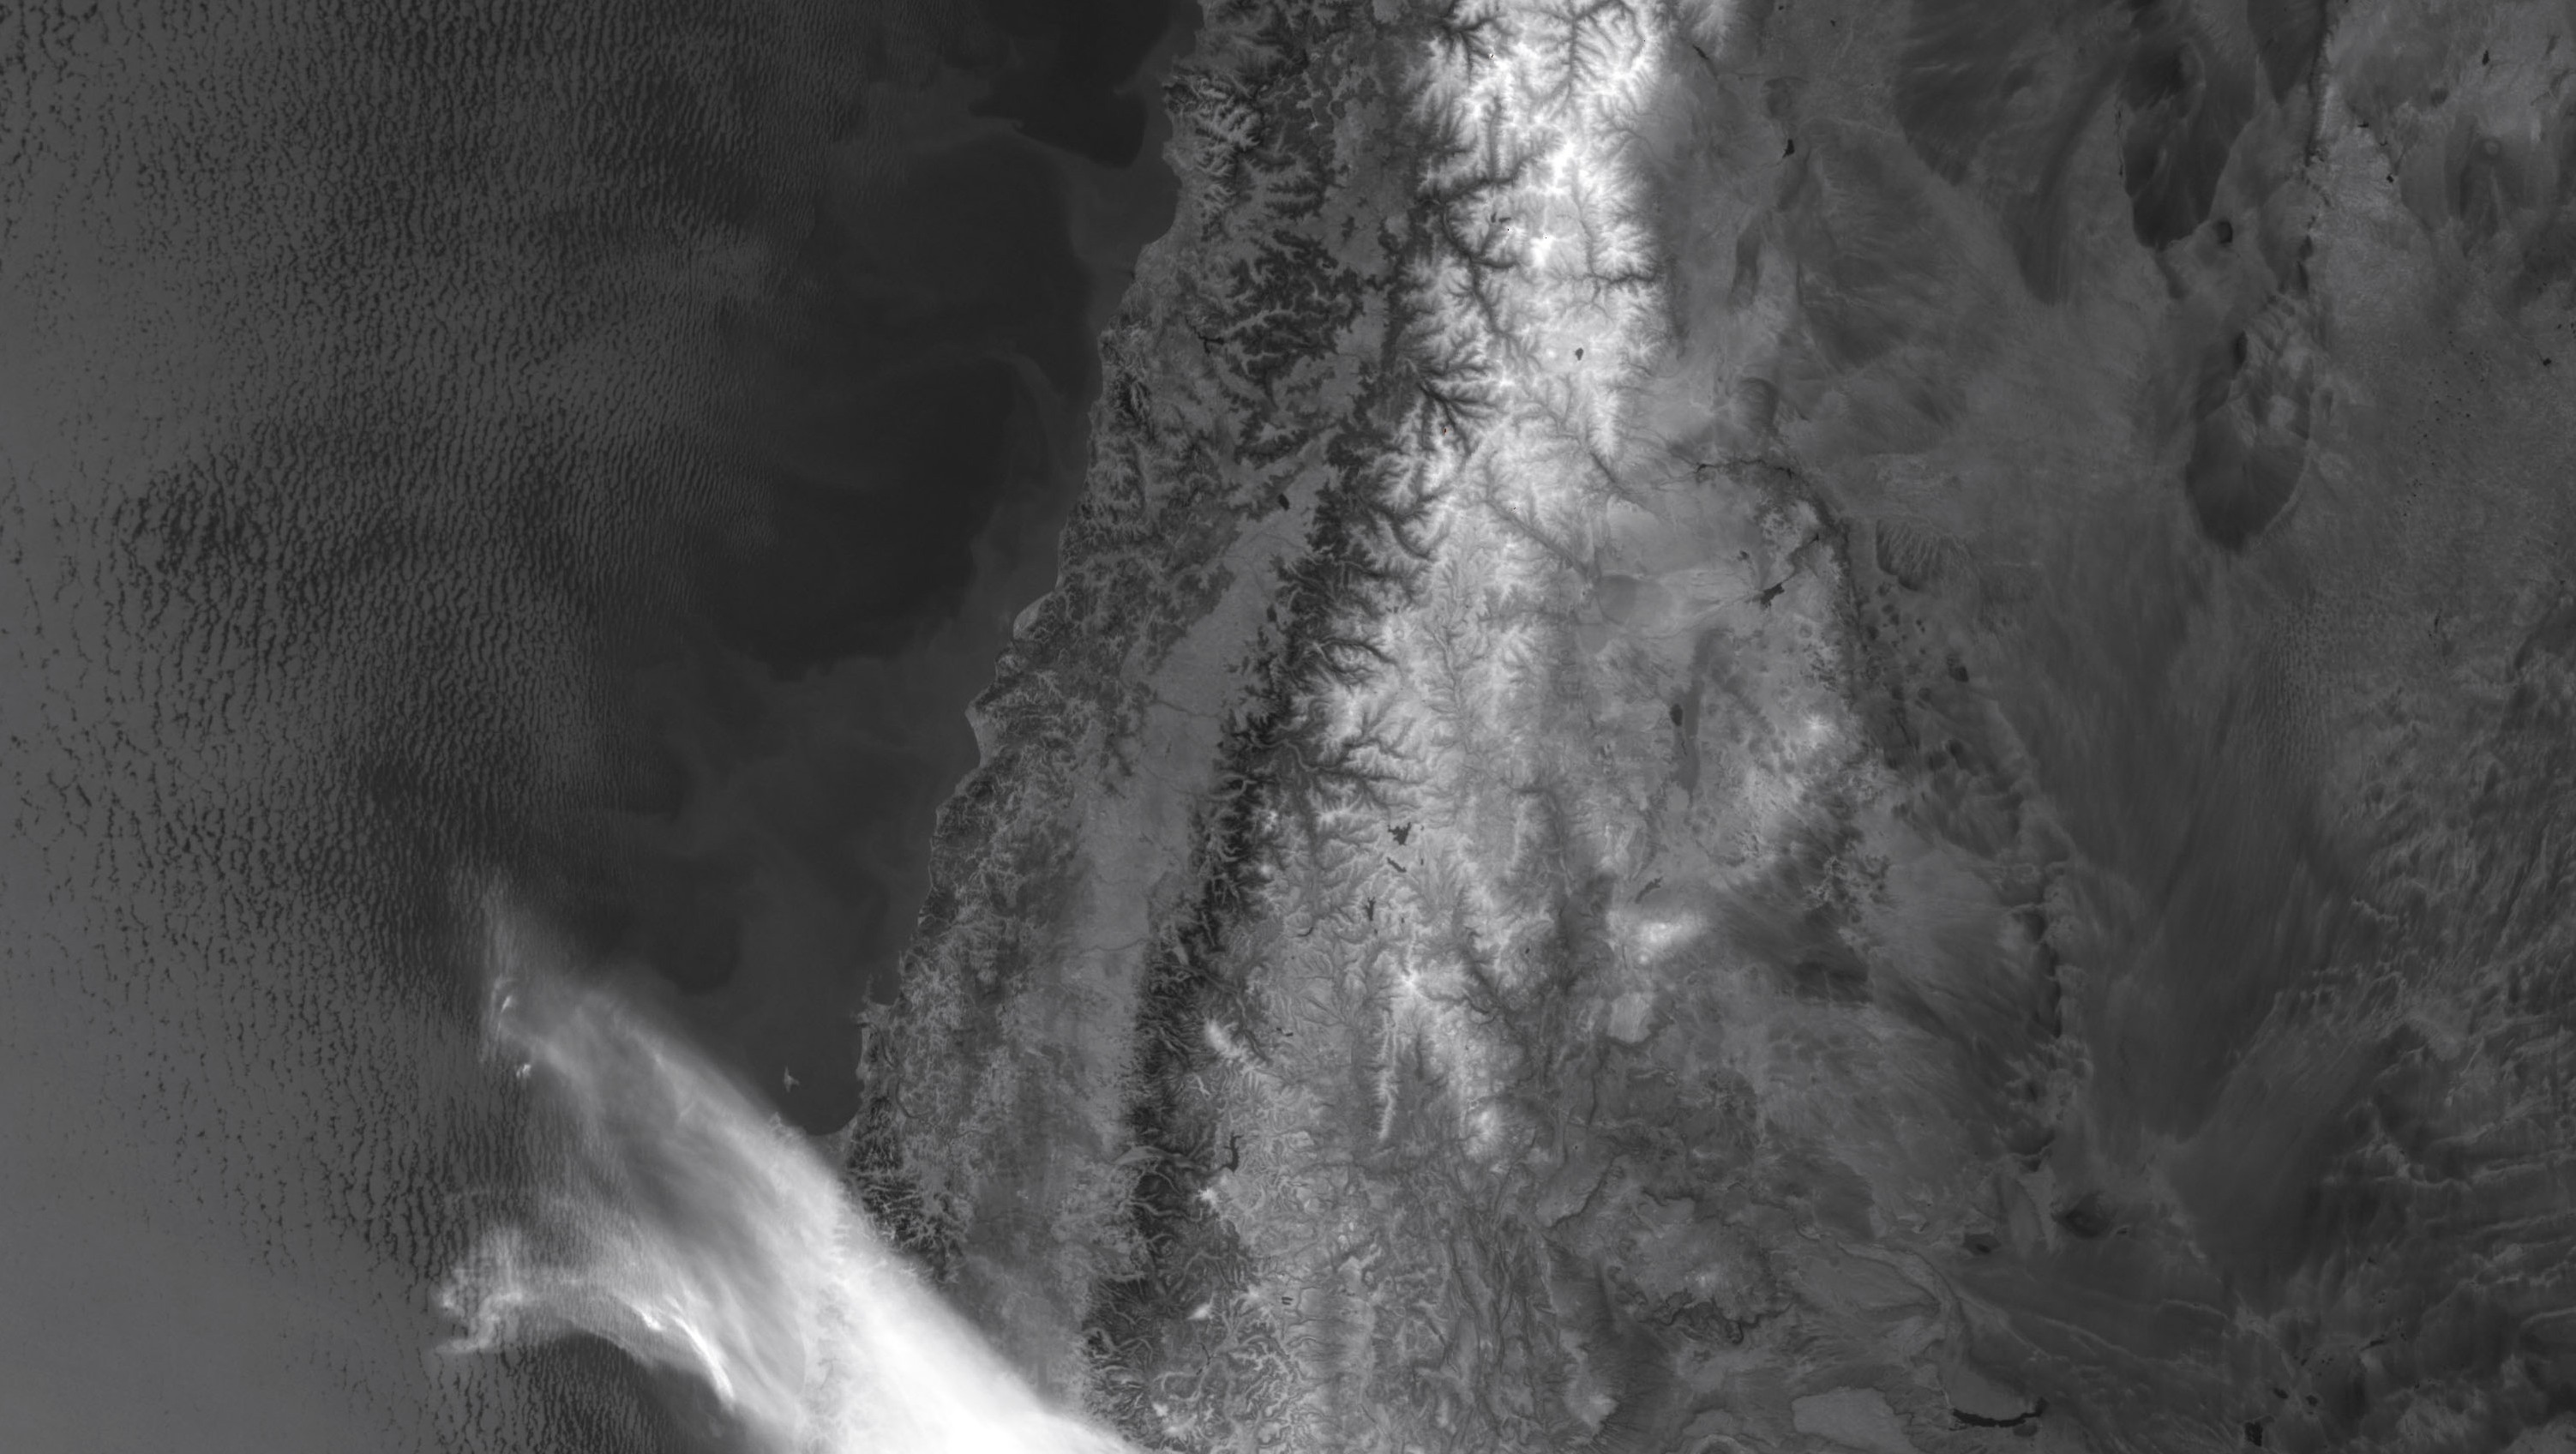
Long wave infrared (11.45 µm) image of the Calbuco plume taken by the VIIRS instrument on the NOAA/NASA Suomi satellite on the morning of 23 April. Source: NASA Earth Observatory. Click the image to enlarge.
The image above looks like a black-and-white photograph. It isn’t. It is a map of long wave infrared energy emission. It has been drawn with a back-to-front colour scheme, where the objects emitting the most energy are darker. The ocean is dark because it is warmer than the land. The mountain tops are pale because they are high and cold, but only some of the have snow on them (compare the infrared with the visible image above). This type of colour scale, where colder is lighter, is typical for weather satellite data because it makes cold, high clouds appear white, just as they do in photographs.
Brightness temperatures
Planck’s law lets you estimate of the temperature of an object, based on the amount of energy that it radiates. This is known as the brightness temperature (BT). If you know how the temperature of the atmosphere changes with altitude, for example from weather balloon (radiosonde) data, and if you assume that the ash cloud is at the same temperature as the atmosphere around it, then you can convert the BT into an estimate of the altitude of the cloud. The BT image below has a pseudocolour scheme that has been set to highlight changes in temperatures in the highest, coldest, clouds. It shows the highest plume (coldest temperatures) directly above the volcano. Based on the BTs, the maximum height of the plume was estimated to be 18-20 km.
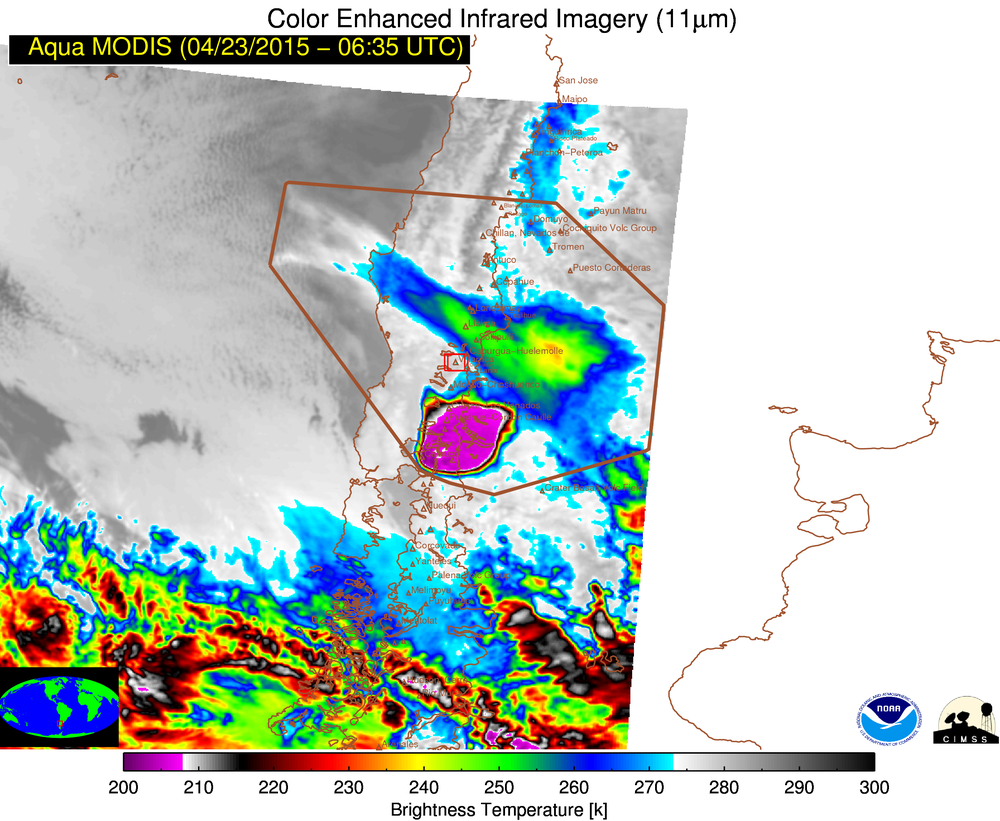
Brightness temperature image derived from data collected by the MODIS instrument on NASA’s Aqua satellite at 06:35 UTC on 23 April. Source: NOAA/CIMSS Volcanic Cloud Monitoring website. Temperatures are in Kelvin, which is the number of degrees Celsius above absolute zero e.g. 210 K = -63°C. Click to enlarge.
For nearly a decade, ash cloud heights have also been measured using a laser fired down from space by the CALIPSO satellite. It only measures along a line beneath the satellite track, so it cannot be used to make maps, but the data give precise measurements and have lots of vertical detail. They show that ash clouds are often made up of many thin layers at different levels, rather than just one single body.
Brightness temperature difference
Calculating the altitude of clouds from their BT is useful, but it doesn’t tell you whether the cloud that you are looking at is volcanic ash or just weather. The clouds that are highlighted in the lower part of the previous image are not volcanic. This is where the brightness temperature difference (BTD) method comes in. It is also known as the split window or reverse absorption technique and has been used for over 20 years. It works by comparing the brightness temperatures measured using two different wavelengths of infrared radiation, which behave differently as they pass through clouds of volcanic ash or water droplets. The diagram below shows how the difference arises.
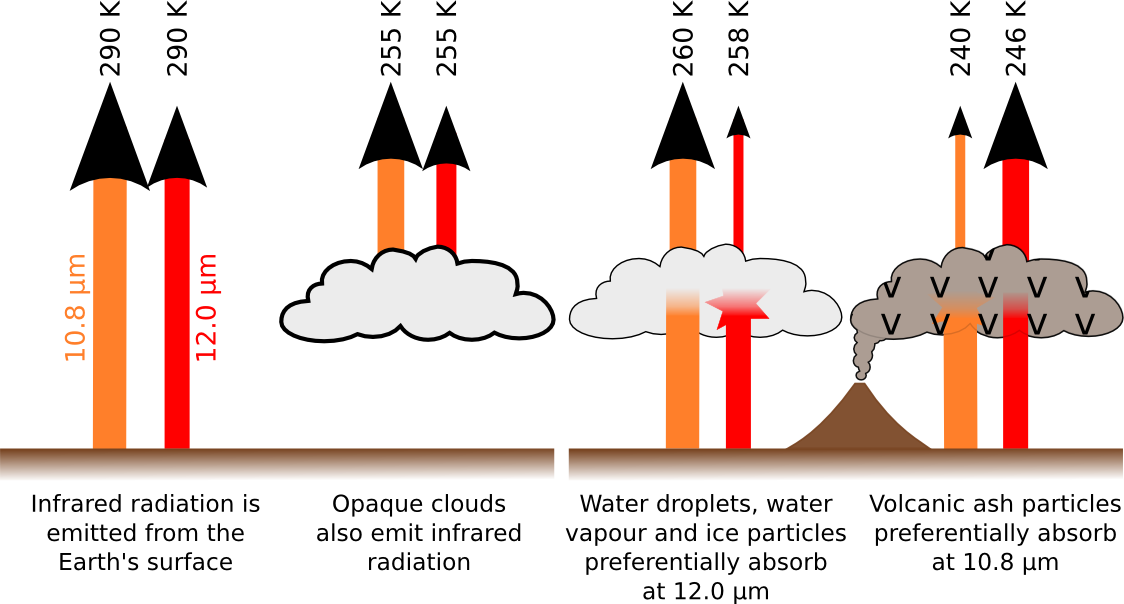
The brightness temperature difference occurs because some radiation from the surface is absorbed as it passed through clouds. Volcanic ash absorbs more at shorter wavelengths than weather clouds.
The left hand diagram shows the radiation emitted by the ground (or ocean) and by thick clouds passing directly to the satellite sensor. The BTs calculated using the signals from the two wavelengths are the same. On the right hand side, the radiation from the surface passes through a semi-transparent cloud of water droplets (left) or volcanic ash (right) and is partly absorbed by the particles within it. The important factor here is that different wavelengths behave differently, depending on the composition of the cloud. Water droplets, water vapour and ice particles preferentially absorb infrared at longer wavelengths than volcanic ash. The BTD effect is strongest when the particle diameter is similar to, or slightly less than, the wavelength of the infrared light i.e. 10-12 µm. The BT recorded above an ash cloud on the 10.8 µm channel is lower than on the 12.0 µm channel. Subtracting one from the other gives the BTD; negative values are an indication that the cloud contains volcanic ash.
The BTD image below highlights the location of the volcanic ash cloud. The strength of the signal depends mainly on the ash concentration, the grainsize and the cloud height. The weather clouds to the south of the eruption are no longer highlighted. Notice also that there is no BTD very close to the volcano (e.g. the purple region in the BT image above). Here, the ash is so concentrated that the cloud is opaque and blocks all radiation from below. External factors such as the presence of weather clouds above or below the ash cloud, high atmospheric moisture levels or extremes of ground temperature also affect the signal and can lead to false alarms or undetected pixels. The detection limit of this method is around 200 µg/m³, which corresponds to “low concentration” in the post-Eyjafjallajökull European flight concentration zones.
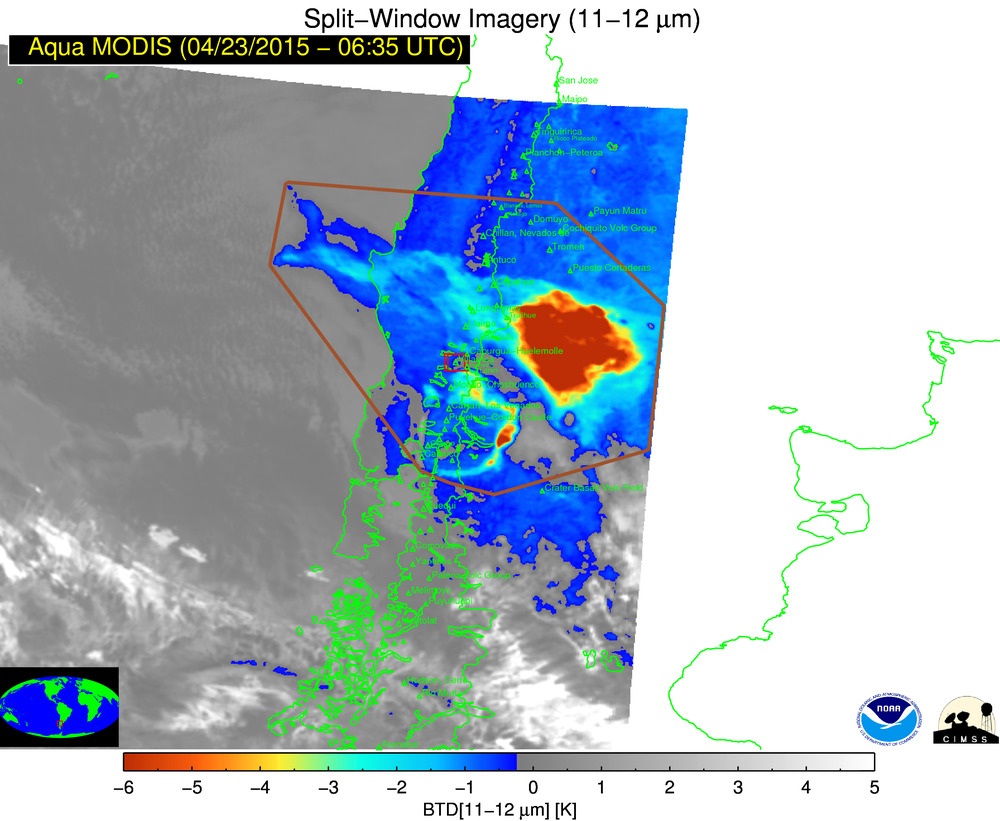
Brightness temperature difference image derived from data collected by the MODIS instrument on NASA’s Aqua satellite at 06:35 UTC on 23 April. Source: NOAA/CIMSS Volcanic Cloud Monitoring website. Click to enlarge.
The BTD signal can also be incorporated into false colour images such as the RGB ‘dust’ scheme. These are designed to make ash clouds easy to identify. In regions of the world where aircraft have to Avoid All Ash, images such as this are very useful for mapping out no-fly zones.
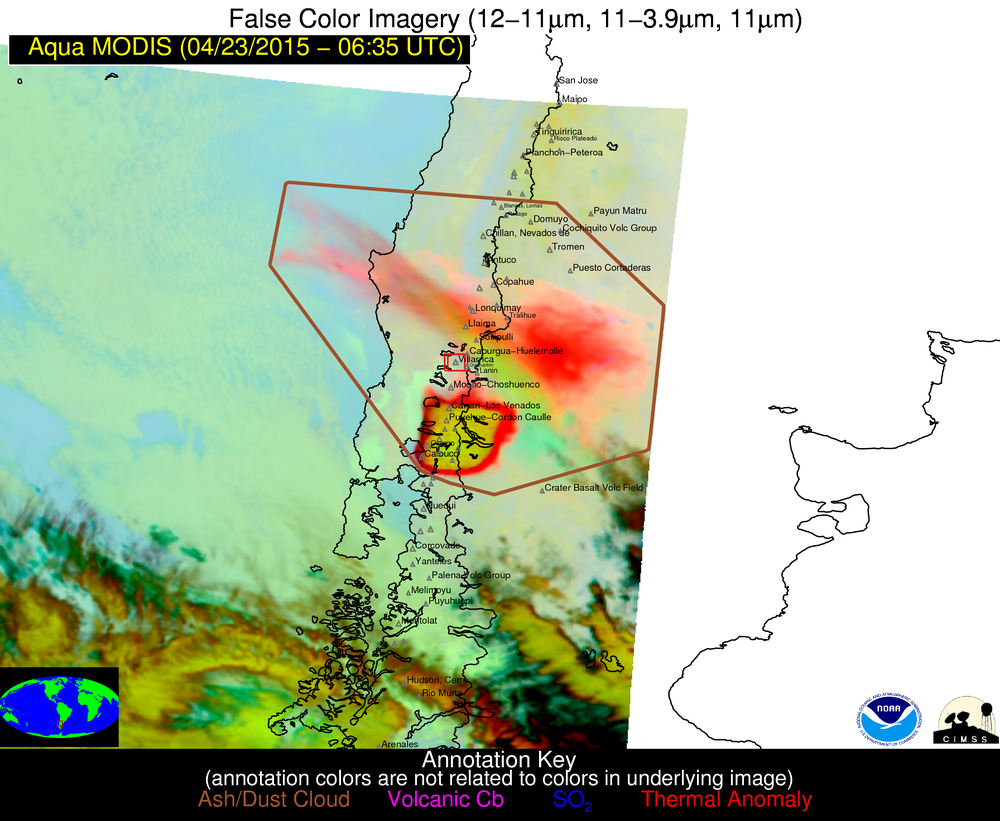
False colour RGB ‘dust’ image derived from data collected by the MODIS instrument on NASA’s Aqua satellite at 06:35 UTC on 23 April. Source: NOAA/CIMSS Volcanic Cloud Monitoring website. Click to enlarge.
Retrieval of ash cloud properties
Retrieval algorithms use satellite infrared data to estimate the properties of ash clouds. This is where things get really interesting. Such data have become more important since the Eyjafjallajökull eruption of 2010, as flight restrictions in European airspace are now based on zones of varying concentration. They work because it is possible to estimate what the BTs at different wavelengths would be for ash clouds with varying properties. For example, if you assume that the ash particles are tiny little spheres, there are equations that can tell you how they absorb different wavelengths of infrared light. Other inputs to the calculations include particle size, ash concentration, ash cloud height and thickness, and ground temperature. The results of the calculations are compared with observations to see what gives the best match. Retrievals can be carried out on any pixel that is identified as ash.
The particle size and the concentration are the most important factors. Ash clouds contain particles of a range of different sizes. The effective radius is the particle size that has the equivalent optical properties to the ash cloud as a whole and is used to simplify calculations. The concentration is represented by the mass loading, which is the total mass of ash between the satellite and the ground. If the thickness of the cloud is known, this can be converted into a concentration. For example, for a 1 km thick cloud, 200 µg/m³ (low concentration zone) corresponds to a mass loading of 0.2 g/m², while 2 mg/m³ (medium) is 2 g/m² and 4 mg/m³ (high) is 4 g/m².
The simplest retrievals use a fixed cloud height and find the effective radius and mass loading that best fit the observations on the two channels of infrared data that were used to calculate the BTD. Others incorporate data from a third infrared channel and either retrieve the cloud height as well, or retrieve a series of other parameters from which the effective radius, mass loading and cloud height can be calculated.
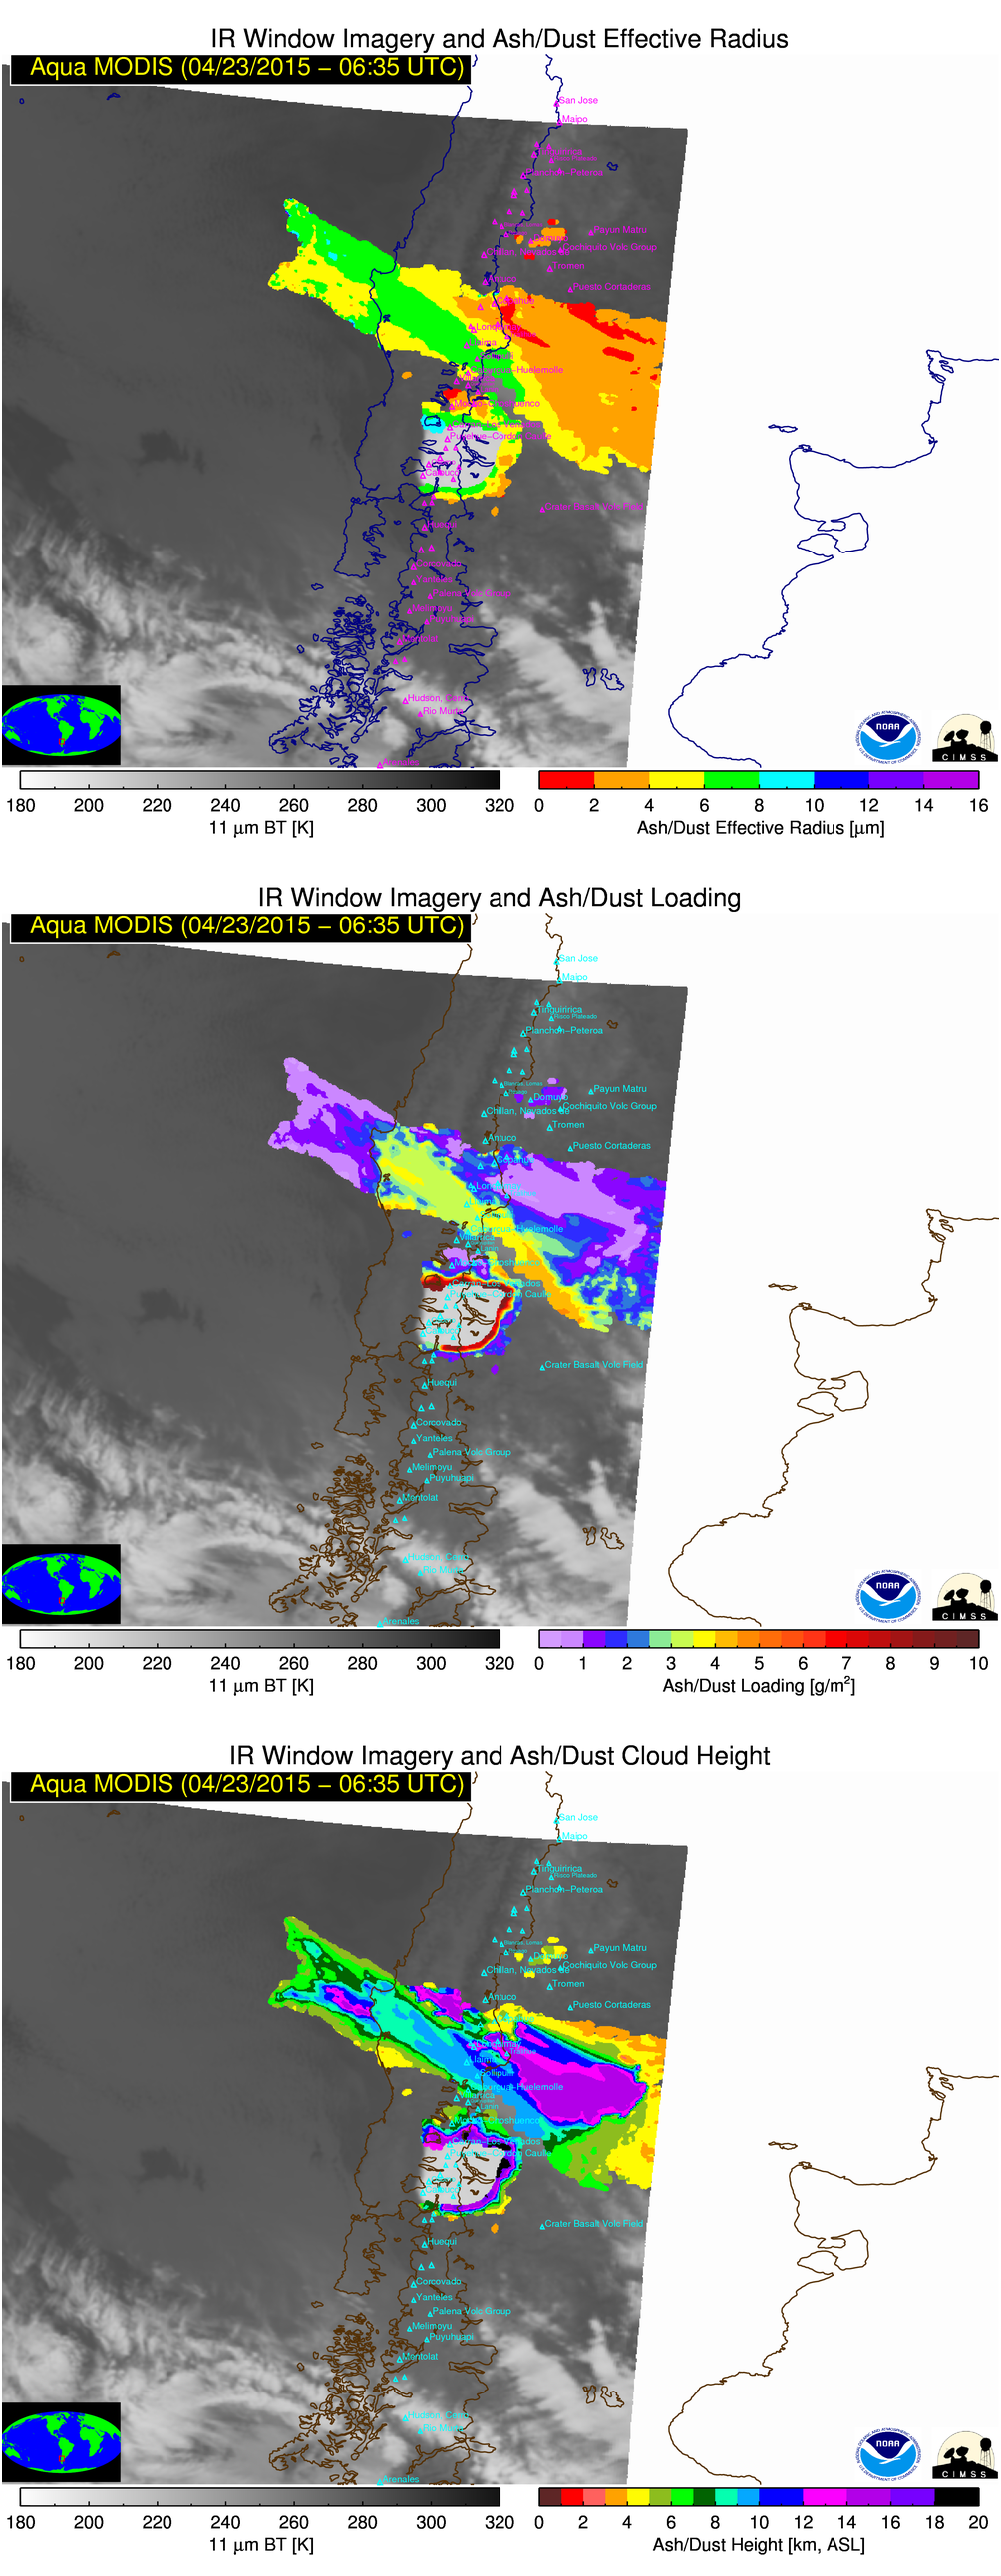
Retrieved volcanic ash cloud parameters (effective radius, column loading, cloud height) derived from data collected by the MODIS instrument on NASA’s Aqua satellite at 06:35 UTC on 23 April. Source: NOAA/CIMSS Volcanic Cloud Monitoring website. Click to enlarge.
The figure above shows retrieval parameters for the Calbuco cloud. When interpreting the retrieved data it is important to bear a number of points in mind:
- Retrieval quality is affected by the same external factors affecting the BTD (e.g. clouds below the ash).
- The retrievals are made on the assumption that the particles are dense spheres.
- The effective radius represents a size distribution, with diameters typically ranging from around 0.2 to 2 times the effective radius value.
- Retrieval algorithms choose the best-fitting values to the observations, but they are not unique. Many combinations of effective radius, mass loading and cloud height can give the same BTD result.
The Calbuco data show the mass loading (ash cloud concentration) decreasing away from the volcano. They also show that the smallest particles are at the north eastern edge of the cloud.
More than just photos
This post showed how satellite infrared data can not only be used to map ash clouds but also to make estimates of their properties. There is a lot more to satellite data than just photos, and we didn’t even touch on satellite detection of volcanic sulphur dioxide, which can also be used to track volcanic ash (provided that the ash and the gas disperse together) and is important for understanding the effect of volcanic eruptions on climate. Neither did we mention computer models of ash dispersion, which are now being used alongside satellite data (e.g. by generating simulated satellite images) to improve the results from both techniques.
It’s amazing how much detailed information is now available during eruptions, online and in real time, for anyone to read. Hopefully this post will help you to get the most out of it.
Sources of satellite images
The visible and infrared images used in this post came from the NASA Earth Observatory page, as linked to by Calbuco calms down after explosions post on Eruptions Blog. All of the MODIS images are from the NOAA/CIMSS Volcanic Cloud Monitoring Web Portal, which provides access in near real time to data covering much of the globe, for the previous 35 days.


Pingback: How big are the grains in a volcanic ash cloud? | Volcan01010
Pingback: How do you measure the particle size of an Icelandic ash cloud?
Pingback: An Eruption of Bogoslof Seen Through Multispectral Imagery | Satellite Liaison Blog
Is there a good datasource of ash cloud density over time for particular events? Would love to find something like [longitude,latitude,altitude,density,time]
I am not aware of any publicly available datasets. You can run HYSPLIT (https://ready.arl.noaa.gov/HYSPLIT.php) in the browser and generate some maps, but I don’t think you can get the raw data out. And model outputs are only as good as the input data, model assumptions and code within them. The best way to get data is to contact a Volcanic Ash Advisory Centre (see list here: https://www.metoffice.gov.uk/aviation/vaac/). They may be able to give you model output in a common format for meteorological data such as NetCDF.
Hope that helps.