Thermobarometry: quantifying metamorphic conditions

witchcraft

Google the words metamorphism and etymology and  you’ll likely find a link to a 16th Century definition of metamorphism: “change of form or shape, especially by witchcraft”. Gneiss formation by spells is not a popular hypothesis these days, but many a student has been tempted to regard thermobarometry as a form of witchcraft.

In my experience, this is due to combining mineral identification with thermodynamics. One requires hard focussed observation and the other is conceptually difficult, drawing on serious chemistry and physics. Put the two together into a three hour practical on Wednesday morning and it makes the head hurt. This was my experience at least (even when I hadn’t drunk too much red wine the night before). As an undergraduate I felt the pain. As a postgraduate ‘demonstrator’ I could smell the fear in the air. I definitely earned my money helping the students through it.

But today… You have no microscope in front of you, I won’t mention Gibbs free energy again. So now thermobarometry is simple really. Let me explain….

The essence of metamorphic petrology is the fact that pressure and temperature have a massive influence on the stability of silicate minerals. Changing conditions drive metamorphic reactions, causing some minerals to be destroyed and their constituent atoms to form other minerals.

Old skool thermobarometry

Some minerals, like biotite, garnet and plagioclase feldspar, are actually two or more minerals in one. Sodium and Calcium feldspar (NaAlSi3O8 and CaAl2Si2O8 , albite and anorthite to their friends) have the same Al/Si/O framework, and the Na and Ca share the same slots within it. At high temperatures they mingle freely. Only as they cool do they separate into different domains (causing twinning). Garnet also has a ‘solid solution series’, where different ions share the same space in the lattice. If calcium is involved its called grossular garnet (Ca3Al2Si3O12). If there is a metamorphic reaction that ‘destroys’ anorthite and ‘creates’ grossular then this might just mean calcium ions moving from the plagioclase to the garnet, without garnet or plagioclase being destroyed (assuming other ions also move). This is known as a continuous reaction and they can occur over wide areas of Pressure Temperature space.

During the 1970s and 80s, a lot of effort went into understanding reactions like these and understanding their thermodynamics both theoretically and via experiment. This allowed the creation of geothermometers and geobarometers.

Take a rock containing biotite and garnet, assume they formed in chemical equilibrium due to a continuous reaction. Measure the amount of Fe and Mg in them and do some maths. The theory says that these compositions are stable only under conditions that form a line in P-T space. This is a fairly steep line, it doesn’t vary much with pressure, so it is like a geothermometer. Take the same garnet and assume it also grew in equilibrium with plagioclase in the same rock. Measure the amount of Ca and you get a flattish line, a geobarometer. If you do both for the same rock sample you get two lines that cross at the exact conditions under which the minerals grew. Right? Sort of.

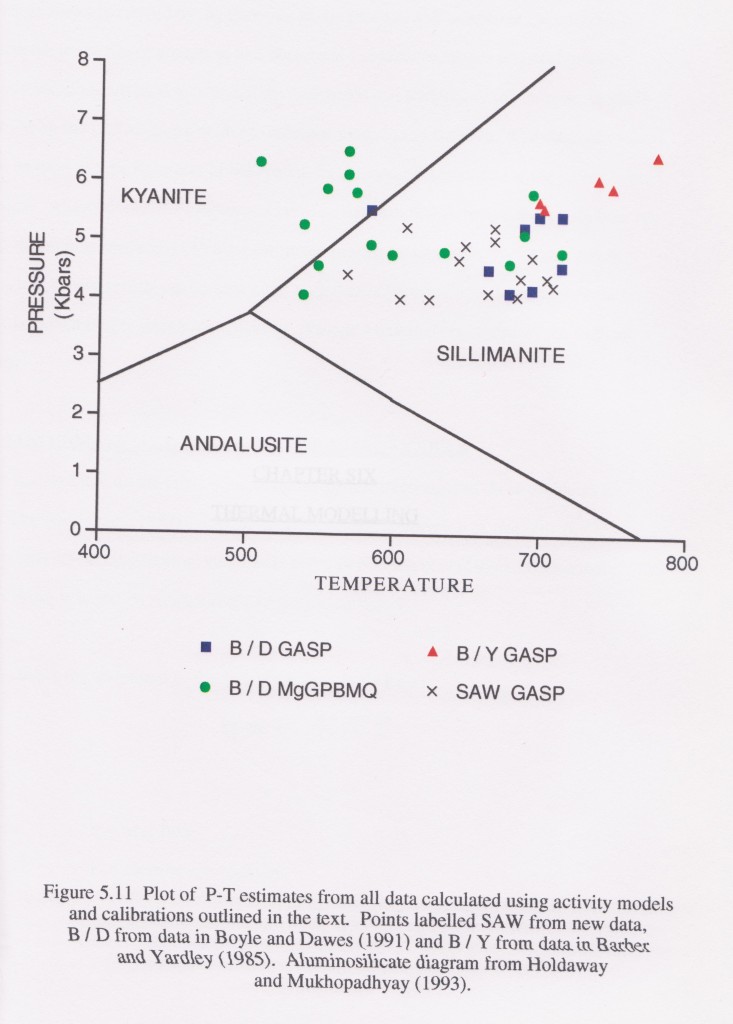
The diagram is taken from my thesis and come from rocks in a small area of Ireland. GASP and MgGPBMQ stand for different sets of geothermometers and geobarometers.

The area contains gabbro intrusions and so variations in temperature are to be expected as I mapped an aureole around them. However the pressure estimates vary a lot as well. The package of rocks is small and peak conditions are close in time, so we would expect a small range of pressure estimates. Looking at these results, the conclusion can only be that thermobarometry is extremely imprecise.

Why is this? Well, the results are from earlier studies as well as my own, so its can’t just be my fault. The truth is that every point on this graph should have bloody-great error bars on it, of the order of 100s of degrees and >1 bar. There is a nice illustration of the difference between accuracy and precision in this. An earlier paper on this area took one of the data sets on this diagram, averaged it and quoted the results to a completely bogus level of precision (e.g. 5.63kbar and 603°C). A fairer summary of the pressure indicated by this data set is “between 3 and 7kbar” or even “in the crust somewhere”.

There are many reasons why these results are imprecise. The calibrations are based on experimental data, which is itself subject to uncertainty. Details of the chemistry (amount of Ti in biotite, fugacity of Fe and so on) can change the results. We have assumed that the mineral chemistry is caused by chemical equilibria being achieved, maybe this assumption is wrong? Hold that thought, for another post.

Finally, we assume that the composition hasn’t changed since the minerals were formed, which is another  big assumption to make

This technique does work, don’t get me wrong. Thermobarometers used on rocks with coesite show very high pressures, measured temperatures are seen to increase in aureoles and so on. A rough estimate of conditions is much better than nothing, but there is room for improvement, no doubt.

THERMOCALC and pseudosections

Things have moved on since I did my thesis.

One of the limitations of of basic geothermometers and geobarometers is that they use only single sets of equilibria to calculate conditions. A rock contains multiple minerals and is affected by multiple reactions, if we make use of more information and more equilibria, we could increase the accuracy.

There are now software programs that do just that. THERMOCALC is a good example. At its heart is an internally consistent thermodynamic dataset for a wide range of mineral systems. The software allows you to use this data in a variety of ways.

At heart, the problem THERMOCALC solves is how to handle multiple dimensions. Conditions of metamorphism vary with pressure and with temperature, but also with bulk composition. Composition is included in the model as extra dimensions, every element or phase adding another dimension. To adequately model a typical silicate rock you need at least 8 dimensions. Imagine that. Actually, no stop! You don’t want a headache.

A typical P-T diagram is a projection of this multi-dimensional space on a 2-D plane, the diagram. The 2-D cross-section through a 3-D beer-glass varies with the angle you hold it (with the view through the bottom being the best). In the same way, the 2-D view through our multi-dimensional space depends on how we slice it. There are different ways to do this, and they give different types of diagram.

THERMOCALC can used to generate the classic petrogenetic grid, where a set of equilibria (reactions) are shown in P-T space. The section through the data here is constrained by taking a particular ‘system’ such as “KFMASH (+q +mu + H2O)”. This example means only modelling potassium, Iron, Magnesium, Aluminium, Silica and water and assuming there is always lots of quartz, muscovite and water. To make the diagrams simple enough to be useful, only reactions that don’t depend on bulk composition are shown.

An especially useful type of diagram is a pseudosection. Here the multi-dimensional data is simplified by taking a projection for a specific bulk composition. This means that all reactions can be shown, even those that depend on the composition of the rock. The diagram is made up of areas, each showing the minerals stable in that area of pressure-temperature space. These areas can be quite small, which means that more accurate estimates of metamorphism can be made – a specific mineral assemblage must have formed in a particular area. Plus evidence of other phases of mineral growth (from inclusions or pseudomorphs) means that sections of P-T-t paths can be inferred.

Pseudosections are a better way of estimating metamorphic conditions as they are based on all mineral equilibria. Plus they are not dependent on measurements of mineral composition. The best use of THERMOCALC is to allow a proper understanding of the metamorphic minerals within a sample and how they relate to the conditions of formation. It is a much more sophisticated approach than simply plugging numbers into formulas.

Further reading

I’ve skimped on the diagrams here, as  I don’t have any of my own. Fortunately there are lots of good places to find more information and good example diagrams.

Dave Waters taught me all I know about metamorphic petrology. His website has lots of material and links but also more detail on how thermobarometry is actually done.

Carleton College has lots of material on the subjects I’ve covered, including much more detail on thermobarometry and P-T-t paths. This is excellent and doesn’t shy from the hard stuff, so stop reading this drivel and get over there, right now.

Or alternatively, look at my other posts on metamorphism.

A trip to the museum

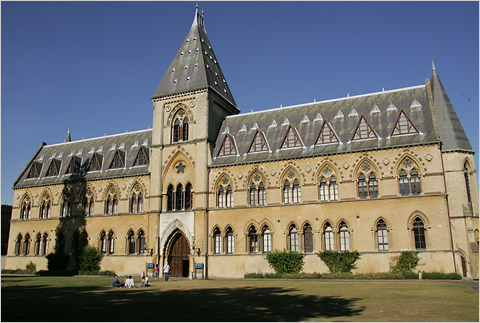
On the last summer’s day of the year, I made a visit to the Oxford University Museum of Natural History, which is a rather lovely place to be.

The building is lovely. A classic example of Victorian Gothic Revival architecture, built in the 1850s.

Like most of Oxford, it is built of local Cotswold stone, a honey coloured Jurassic Oolitic limestone.

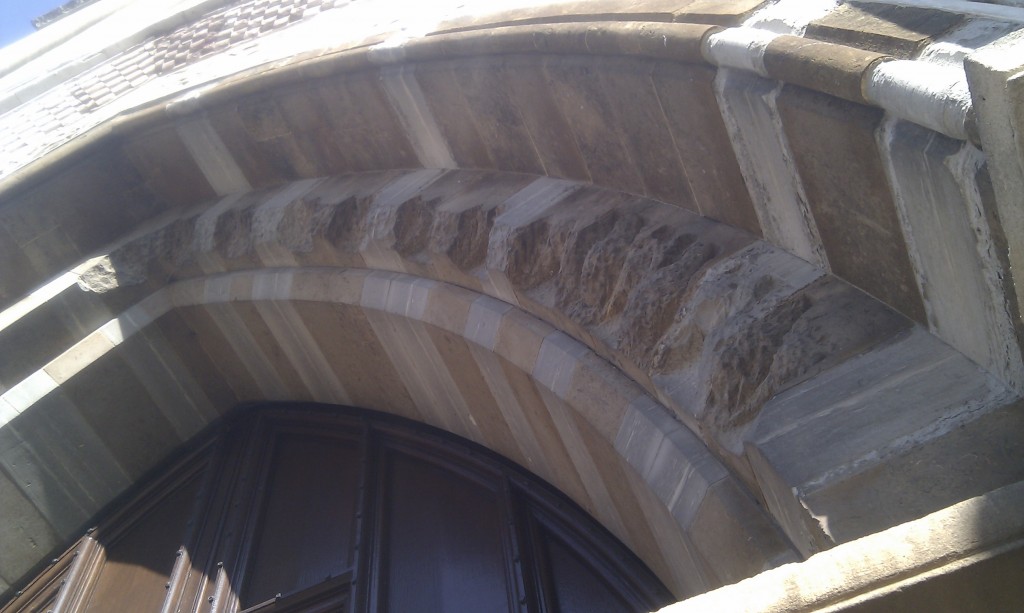
Before going in, I admired one its quirkier features. The whole of the façade is covered with fine carvings, but just above the door is some rough stone. The story I was told about this, is that the Irish craftsmen who working on the building felt they were badly treated by the University. One night, drunk, they carved alternating images of monkeys bums and professors faces. Once their handiwork was discovered, they were summarily sent home. Their carvings were roughly removed, but no-one with the skill to repair them remained, so the remains are visible to this day. I’ve never checked this story, it is so good I don’t want to be told it is not true.

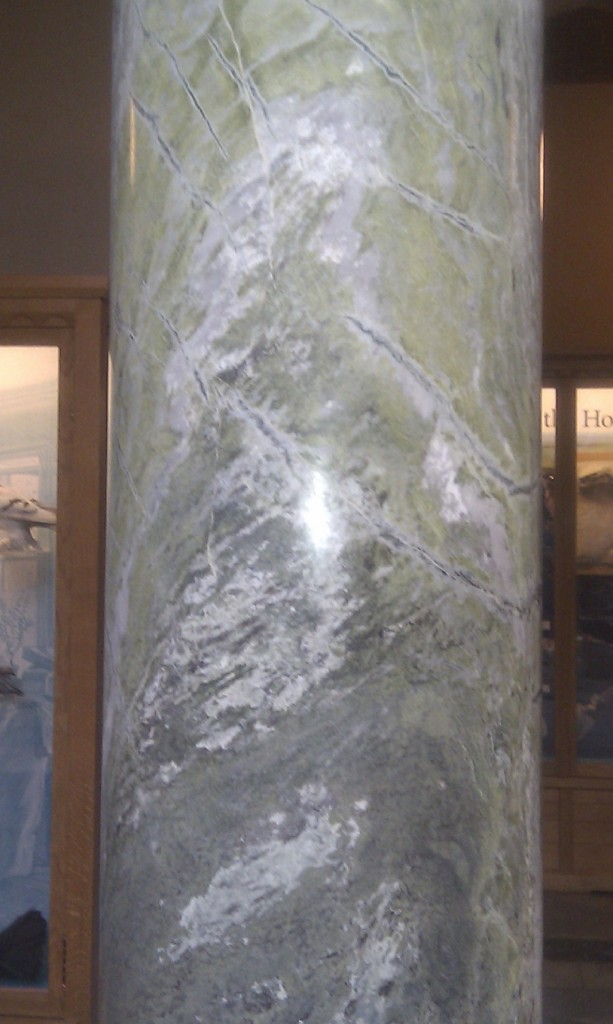
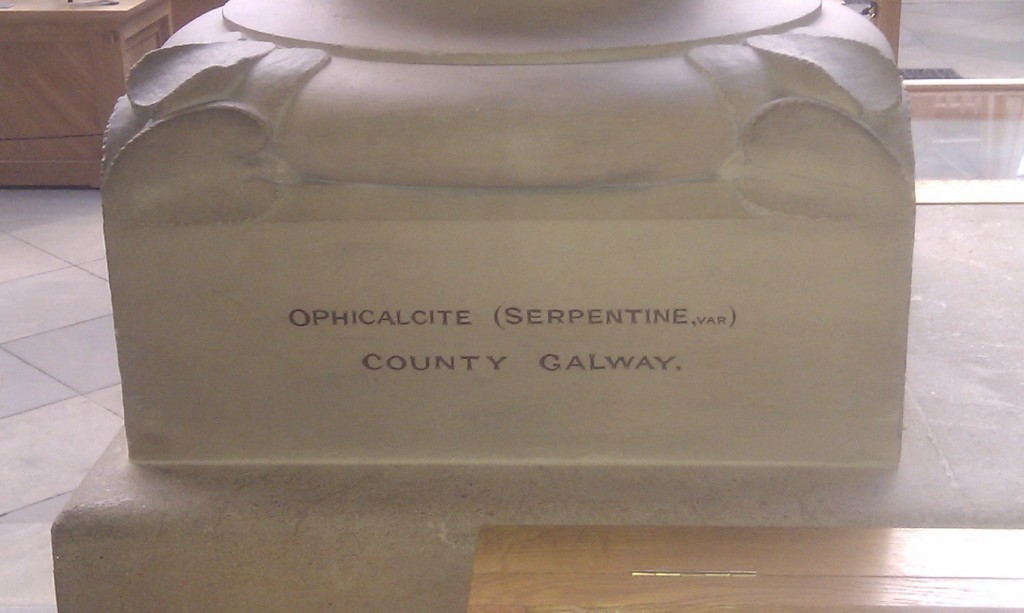
Inside the museum you are in temple of Science. A grand soaring space, it was purpose built as such. The very columns are educational.

They are all like this, educational examples of building stones from the British Isles.

The museum was the venue in 1860 for an historical debate about Darwin’s ideas. The debate involved the Bishop of Oxford Samuel Wilberforce and Thomas Henry Huxley, also known as Darwin’s bulldog. The most famous exchange was where Wilberforce attempted to belittle evolution by asking Huxley if he was descended from an ape by his mother’s or father’s side. Huxley replied “I’d rather be descended from an ape than from a gobshite like you” (I paraphrase) and was regarded to have won the argument. It’s an important phase in the acceptance of evolution beyond the scientific community.

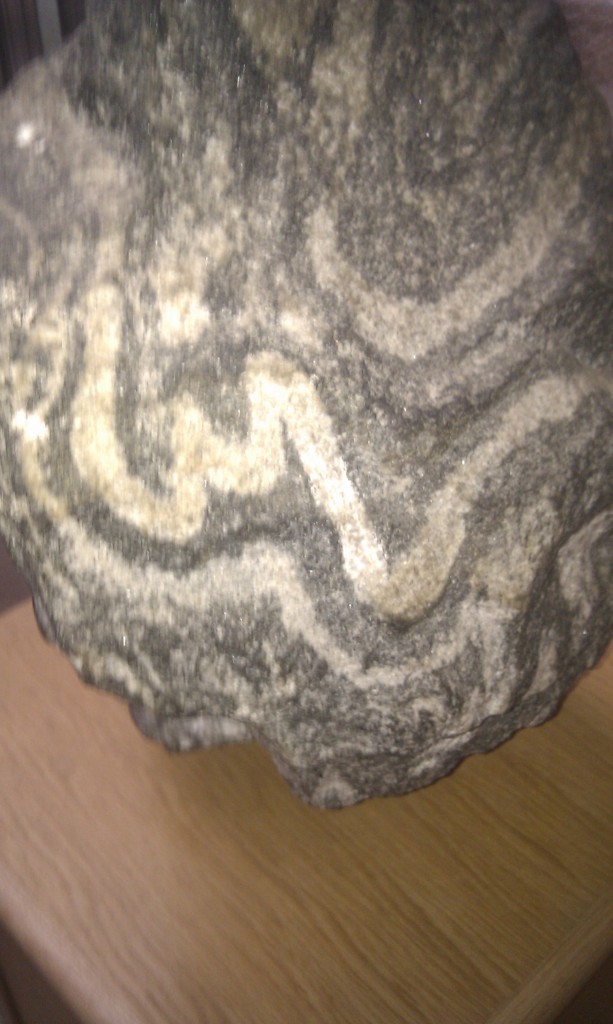
The museum contains lots of lovely things, including a sample of the first ever dinosaur (the first one identified as such), a big dinosaur model and so on but my favourite was a sample of Isua gneiss from Greenland, 3.8 Ga.

Isua gneiss

This sample used to sit in the coffee lounge of the department of Earth Sciences, just next door to the museum, it is a bit grubby on top from geologists leaning on it. For a while it was the rock with the oldest known radiometric age, the date coming from analysis done in a lab in the same building.

I used to sit in that coffee lounge quite a lot myself as I studied there for both my undergraduate and graduate degrees. The department has moved to a new building and the old one stands empty. I peered through the window at the room that used to house the electron microprobe and felt nostalgic. Only for 30 seconds mind, until my children got bored and dragged me away. Children are a good antidote for nostalgia, I find.

The last time I’d been in the museum might well have been just before a final-year undergraduate practical exam, when we all milled around (in our silly exam uniform, including mortar boards) anxiously looking at the displays and cramming fossil names. I’m sure I won’t leave it as long before my next visit.

Metamorphism: Pressure-Temperature-time paths

Pressure-Temperature-time paths

This post is in the middle of a series on metamorphism.

Concepts such as metamorphic facies or grade all allow us to link a metamorphic rock to a particular set of conditions, under which it was metamorphosed. This is a simplification, of course. Hold a piece of schist in your hand: we know that it was once sediment at the earth’s surface and we also know it got back to the earth’s surface again, to catch a geologist’s roving eye. It’s been on a journey. Calling it a greenschist facies rock tells us about a single point on its journey, but not the whole picture. Being romantic souls, geologists often refer to this journey as the rock’s Pressure-Temperature-time path, or P-T-t path. Pressure and temperature are the things we can measure, because we understand how they affect metamorphic reactions.

So how can we discover more about the journey, what is a typical journey and why do concepts such as grade still make sense?

How to create a P-T-t path

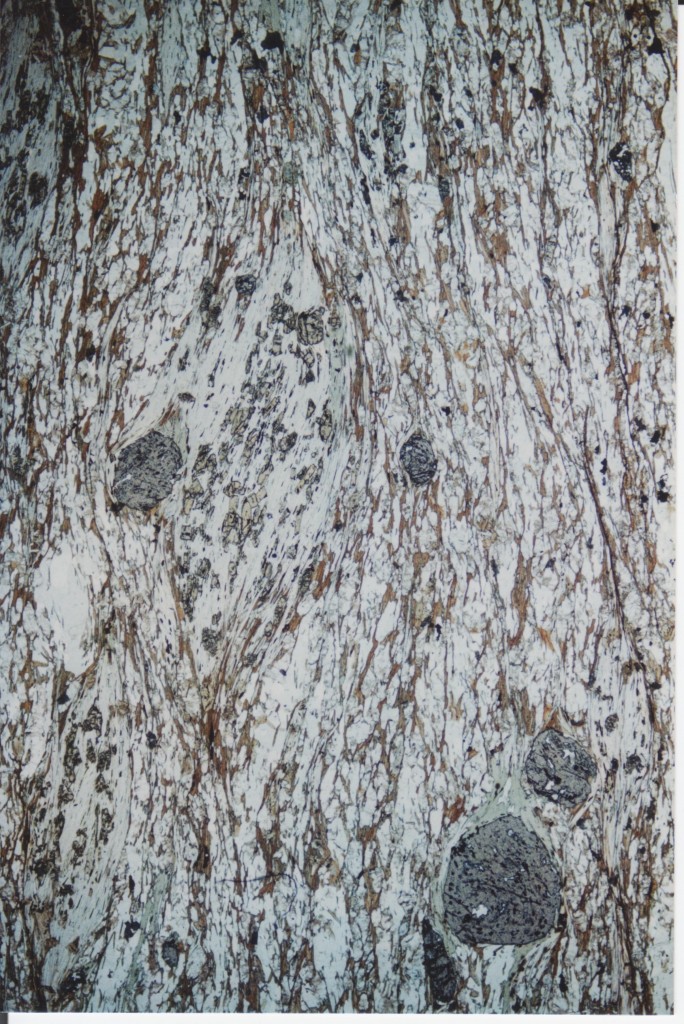
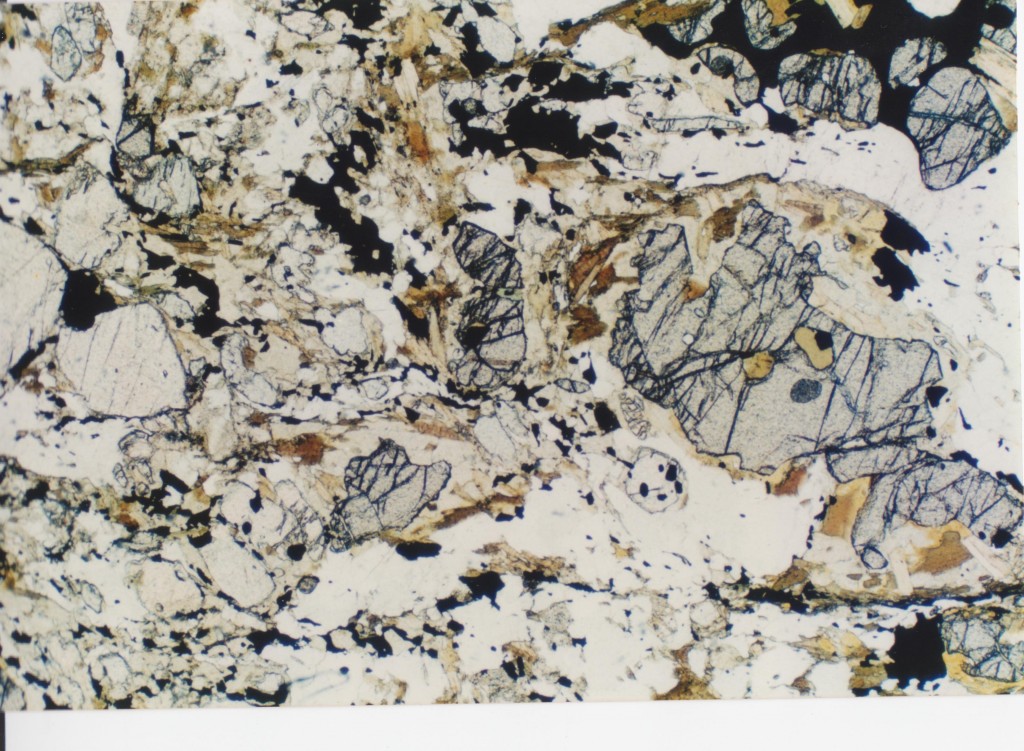
Metamorphic rocks are complicated. Take this beauty from Connemara, Ireland:

Thin section of Connemara schist

Thin section of Connemara schist, field of view is 14mm across

The big gray lumps are garnet, the orange stuff is biotite. The big area a third of the way from the right is a sheaf of muscovite, containing yellow staurolite. These minerals tell us its an amphibolite grade rock. Some investigations of mineral chemistry could allow us to quantify that a bit more and put a big cross onto a plot of Pressure and Temperature, representing peak conditions.

There is more information to had from this rock, though. A transect through the garnet would show that the Mn, Fe, Mg and Ca values vary systematically from the core of the garnet to the edge. We know that the garnet would have started small and grown bigger, so the values from the core are earlier than the ones at the rim. The garnet therefore contains a trace of the journey the rock has been on. Often we can infer that the conditions were of lower pressure and temperature when the garnet started growing. So, we can draw an arrow up and along towards our cross marking peak conditions. This arrow we call the prograde path, the portion of the journey before the most extreme conditions.

Look at the lowest big garnet, see the greenish patch just above it? (OK, maybe not, but it is very clear down the microscope). The green is a patch of chlorite, which is associated more with greenschist conditions. Is this another part of the prograde path? No, as the chlorite can be seen as patches within biotite, showing that it grew later. The chlorite is part of the retrograde path, another line we can draw going from the peak conditions back to the surface. We have drawn a P-T-t path.

This is a simple example but I hope it illustrates the general point. The best sorts of rocks for determining P-T-t paths have more dramatic features in them, such as pseudomorphs, where minerals have gone, but their shape remains, or mineral coronas, where a whole new retrograde mineral assemblage was created around the edges of the peak minerals. Also, different samples within a package of rock may preserve different peak assemblages. Put these together and a thorough may allow us to build up a more detailed view of the P-T-t path shared by a package of rocks.

Some types of P-T-t path

Geologists have been creating quantitative P-T-t paths for some time now. What do they look like?

In the roots of ancient (or even active) mountains, Barrovian metamorphism is characteristic.

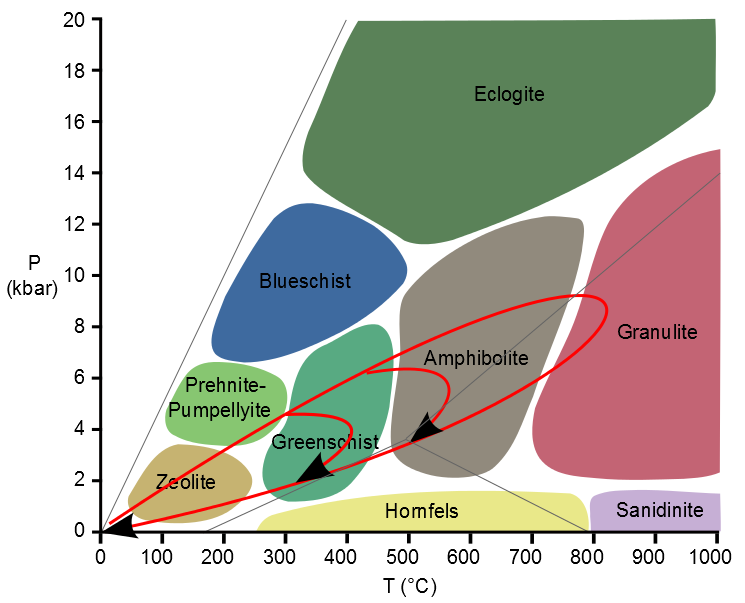
Schematic P-T-t paths for Barrovian metamorphism

Schematic P-T-t paths for Barrovian metamorphism

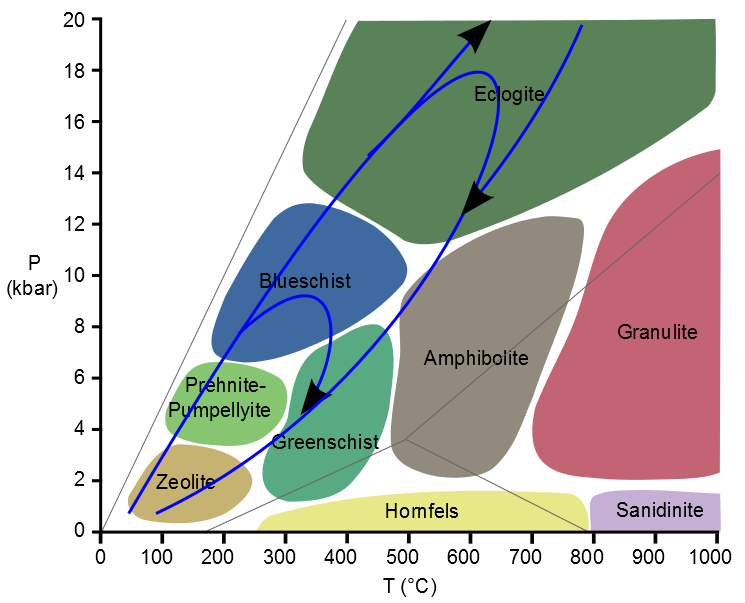
I’ve taken a standard diagram of metamorphic facies and drawn on roughly some typical P-T-t paths. The upper red line is the prograde path, the lower the retrograde. Different rocks reach different peak temperatures, varying from lower grade greenschist rocks up to granulite facies gneisses. This is pattern seen in Scotland and if you read my earlier post, you might think of the lowest temperature loop as the Laphroaig one, the highest as the Macallan.

Rather nicely, if you use mathematical models to predict what happens if you form mountain belts by thrusting rocks sheets over and over, you predict very similar P-T-t paths. Initially pressure is increased faster than temperature, eventually, perhaps because thrusting ceases, the line flattens off as temperature increases (thrusting buries cooler rocks). Eventually a maximum temperature is reached, which is likely where the peak assemblage is formed, as many metamorphic reactions are most sensitive to temperature increases.

Different rocks are buried to different depths, and reach higher or lower grade but they all follow a similar type of P-T-t path. So via modelling based on geophysics, we can now link observations in the field to a tectonic mechanism and explain multiple pieces of evidence. This is proper science.

What of subduction zones, where rocks are thrust down to great depth?

P-T-t paths characteristic of subduction

P-T-t paths characteristic of subduction

Compared to rocks in mountain zones, subduction zone rocks are buried and returned to the surface before they have a chance to heat up. One remarkable aspect is how deep some of these rocks go. In the 1990s, the recognition of the quartz pseudomorph coesite in continental eclogitic rocks from China and Norway demonstrated that they had been buried to extraordinary depths (>70km). This is literally off the scale of the diagram above (* see below). In Norway these rocks are found just below large extensional faults and shear-zones that have sheared sediments on their top surface. The contact is not a sedimentary one, the rocks were exhumed all the way to the surface by tectonic processes. This is a reminder that the retrograde path is not necessarily just a record of slow erosional unroofing, but can have drama and excitement too.

Why is grade still a useful concept?

All metamorphic rocks are unstable; leave them in the rain long enough and they will turn into sediments. Their journey is never ending, but always controlled by their physical conditions, and often by the presence of water.

My example schist above shows a little evidence for the retrograde path, but is dominated by the minerals that grew when it was at its hottest. The concept of metastability is key here. Diamonds don’t grow at the surface and so ‘aren’t stable’. The carbon atoms would ‘like’ to be in the form of graphite, (or to put it another way, this would minimise their Gibb’s free energy). But they are tightly packed into a crystalline lattice and, even on someone’s finger, quite cold. So, at surface conditions, they are metastable.

The peak assemblage minerals in my example schist are like this. They were metastable all the way down the retrograde path. It takes energy to initiate reactions and in a cooling rock, this tends not to happen.

Also my sample schist was likely quite dry as it cooled. Water is very important in metamorphic reactions as a participant in many important metamorphic reactions (those involving devolatilisation). It also is a solvent and can be a catalyst for metamorphic reactions. Atoms can zip around in the fluid phase and so are more likely to find places they prefer, compared to having to diffuse through mineral lattices.

Eclogites are often found as pods within lower grade (blue/greenschist) rocks. Compared with Barrovian rocks, retrogression is more important. This may be because they still contain a lot of water, also the retrograde path passes through more pressure-sensitive reactions. In comparison, a high-grade Barrovian rock has little water left and many of the reactions it is passing through require the addition of water. The retrograde path is therefore much less obvious in the rock.

So now you know. P-T-t does not mean a cup of Darjeeling made from Irish bog water** but instead a reminder that the lump of schist in your hand has been places you’ll never go.

Note * Depth relates to pressure depending on the density of the rock, as the weight of the rock above is providing the pressure. It varies, but 0.25 kbar per km is a good rule of thumb so top of the diagram (20kbar) is about 80km depth. Note that as well as showing the Pressure-temperature diagram in different ways (sometimes with pressure increasing downwards), the units can also vary. The diagram above has kbar, which is kilobars, which is 1000 bars. A bar is 100,000 pascals and is about the pressure of the air you’re breathing. A pascal is a Newton per square meter and is the pukka SI unit for pressure. Therefore we should use pascals (Pa), but since the pressures we are dealing with are so high, we need a billion of them, written GPa for giga-Pascal. A kbar is 100,000,000 Pascals and so 0.1 of a GPa. So a more properly labelled version of the graph above would have 2GPa at the top. Aren’t you glad I left this bit to the end so you could ignore it?

Note ** “peaty tea”. Sorry, I’ll stop now.

Metamorphism: grade, zones, index minerals, and whisky

This post is second in a series of posts about metamorphism.

Metamorphic grade, zones and index minerals

Science is based on a solid understanding of underlying physical principles. Although I have chickened-out of the detail, everything I mention in the previous post is based on a solid understanding of chemistry and physics. The knowledge we have today of the chemistry of rock-forming minerals wasn’t available to earliest scientists studying metamorphic rocks. Their study of Geology was driven by fieldwork and observation.

Some useful metamorphic concepts came from the study of rocks in the Highlands of Scotland in the early Twentieth Century. George Barrow identified patterns in the minerals found in these rocks, based on the appearance of characteristic index minerals (chlorite, biotite, garnet, staurolite, kyanite, sillimanite). His insight was that these index minerals were distributed in distinctive ways.

The rocks of the Scottish Highlands are mostly metamorphosed sediments. What were sandstones, muddy sandstones and mudstones are now (meta)-quartzites, schists, slates and so on. The main influence on the proportions of minerals within them is what the original sediment (the ‘protolith’) was, a quartzite has more quartz than a slate for example. Barrow’s insight was to focus on the index minerals and be less worried about the many other minerals present in the rock (e.g. quartz, plagioclase, ilmenite, magentite, titanite, tourmaline, muscovite, etc). This is something field Geology often does, identifies important features that allow us to filter down the sheer mass of information available from rocks in the field.

Using the concept of index minerals allowed Barrow to map metamorphic zones, each one an area on the map defined by the first appearance of its particular index mineral. He interpreted these zones in terms of progressive metamorphism, from low grade to high grade.

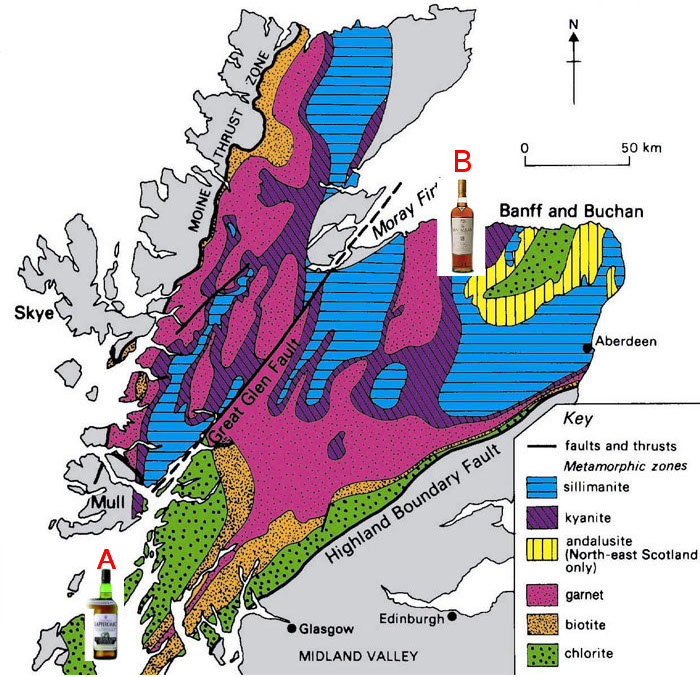
Scottish metamorphic zones. Base image taken from http://faculty.kutztown.edu/friehauf/beer/

Using this concept grade and index minerals, a walk across Scotland becomes a walk through different metamorphic conditions. Starting in the chlorite zone (near the Laphroaig whisky distillery on Islay perhaps, bottle marked A), rocks are slatey, with well preserved sedimentary features. Since they were muds and sandstones, there have been some metamorphic reactions producing chlorite, but they are still low grade, greenschist facies rocks. As you move Northwest  into higher grade rocks (biotite, garnet zones), new minerals appear in a regular sequence and the texture of the rocks change, becoming more schist-like. By the time you reach the Macallan whisky distillery further north (bottle B), you are in high-grade rocks (sillimanite zone); like the whisky, the rocks are dramatically different from where we started. They are now gneisses, often migmatitic, containing pods and lenses of granite: they are so hot that they have started to melt.

By the end of your journey you’ve undergone some changes too, most likely you’ve become damper in the rain and become covered in midge-bites, but also fallen in love with the scenery (and the whisky). The sillimanite grade rocks you’re standing on at the end have been on a journey too. They started as low-grade rocks, then were the same as rocks in the garnet zone but they carried on, reaching higher and higher temperatures.

The patterns are based on observation in the field, but can linked to the theory. The index minerals appear when the rock has passed across a metamorphic reaction (a line in P-T space). The reaction creates a new mineral that isn’t seen at a lower grade. High grade rocks have passed through multiple metamorphic reactions as grade increases: we see evidence of this in thin-section, where we sometimes see ‘frozen reactions’, with some minerals growing at the expense of others.

Thin section of granulite facies rock

Granulite facies rock: sillimanite and garnet porphyroblasts. Garnet mantled by cordierite and garnet: evidence of a series of reactions. From Ireland

The sequence of metamorphic zones that George Barrow found in Scotland is found in many places, such the eastern US and the Himalayas, where major mountain belts have been created. It is seen as characteristic of regional  or Barrovian metamorphism, where the metamorphism is driven by mountain-building. Rocks caught up between converging plates are buried (increasing the pressure). Temperatures increase as rocks are further from the surface, meaning the heat naturally produced by radioactive decay builds up. Also heat may be produced by friction associated with the deformation of the rocks.

The Buchan series of metamorphic zones, which includes andalusite and cordierite was also defined in Scotland and is associated with lower pressure conditions, which in Scotland are associated with intrusions of gabbro and perhaps extension.

This post is second in a series of posts about metamorphism which attempts to cover pretty much all aspects of metamorphism and how we study it.

A random note on the spelling of whisky

As a snooty English type, I persist in spelling things differently to many other native English speakers. My spelling of the word whisky as whisky (instead of whiskey) is such an example and the reason for the difference is sort-of interesting. Whisk(e)y is a Celtic invention, from around a thousand years ago. The name comes from ‘water of life’ (uisce beatha in Irish). As English spread into these gaelic speaking countries, this name was anglicised into whisk(e)y. In Scotland, the spelling of whisky stuck, in Ireland whiskey was preferred. In Britain now, Scottish whisky is most popular so that spelling is used. In America, the Irish spelling of whiskey is better known. Many settlers entered the US from both Scotland and Ireland, but my guess is that many of the Scottish ones were from Protestant sects that regard alcohol as ‘the devil’s own buttermilk’ and so less likely to start distilleries.

Irish whiskey (Bushmills is especially nice) is also drunk in England, by real enthusiasts. We try to use the Irish spelling for this whiskey, but are often too drunk to remember.