Metamorphic petrology under stress: round 2

Back in August I wrote about an extremely important paper by John Wheeler of Liverpool University called “Dramatic effects of stress on metamorphic reactions”. This uses a theoretical approach to show that differential stress (squashing rocks) is a very important control on metamorphic reactions. If true, this would imply that many estimates of depth of metamorphic conditions (that ignore the squashing) are wrong. Maybe eclogites don’t form at great depth after all.

Counterblast

Conceived as a provocative paper, it’s no surprise to find a “Comment” on it in the latest edition of Geology. Written by Raymond Fletcher of Penn State, it aims to “show
that Wheeler’s claims do not have a sound basis” by constructing a more complete mathematical model “for metamorphic reaction and pressure solution” (the two processes that Wheeler’s original paper wound together).

For both our sakes, I’m not going to get into the detail of the mathematics (all papers are open-source, so you can read it yourselves). It isn’t massively complicated maths – single lines of algebra only –  but what matters here is the assumptions and simplifications made and whether they are valid.

Fletcher’s comment picks on one aspect of the original paper – that in the section quantified the effects of differential stress, it focussed on a single way in which atoms can rearrange themselves called incongruent pressure solution. Fletcher’s set of equations are a more complete model that shows that Wheeler’s results are merely a ‘special case’ leading to ‘contrived outcomes’.

 A spirited defence

‘Comments’ on papers are often followed by a ‘reply’ from the original author. As here where the ‘comment’ is negative, they are effectively a form of public combat.

Wheeler is uniformly polite and positive. He starts by thanking Fletcher for his stimulating Comment and listing the ways in which they agree. Then this:

“But it is inappropriate to say that I am wrong, first because his model is not of the incongruent pressure solution (IPS) pathway, second because it actually contains
confirmation of some of my claims, and thirdly because it is extremely
restricted in scope.”

He then proceeds to show that Fletcher’s model doesn’t just model a single pathway and the he lists the assumptions made by Fletcher and demolishes each one. For this audience member, Wheeler starts to win the battle by the depth of context he brings to the discussion.

For each assumption he refers to existing research into real world complications. These include: defining 3-D stress as a single term in an equation is complicated – taking the simple average of the 3 dimensions is not correct; fluid pressure may control reactions, not stress; the topology of grains is important and the one chosen by Fletcher extremely unrealistic; diffusion of atoms is often a limiting factor in metamorphism; porphyroblasts often grown in specific shapes – ‘interfacial’ kinetics may also be important.

For this (slightly biased) reader the knock-out blow was the fact that 3 times the research into these complications is his own allowing Wheeler to write that Fletcher “may well have rediscovered the sorts of problems described above (Ford and Wheeler, 2004) but by ignoring these he reduces the value of his assertion that…” .

All good replies to comments look to the future:

In summary, Fletcher’s model is too restricted in scope to undermine my conclusions: we agree that a more general model is required. I challenge him and other interested readers (including myself) to construct such a model, which would be of great benefit to understanding how metamorphism and deformation interact.”

Science in action and in the open

I remind you again  of the important implications of Wheeler’s paper – existing estimates of metamorphic conditions – used to build tectonic models – are suspect. To quote another article in Geology discussing it “the potential inaccuracy of depth estimates based on minerals would question current paradigms in geology“.

Wheeler’s original paper was a huge challenge to metamorphic petrology. It has withstood the first attempt to refute it. This is science in action, in open source papers for all to view. I hope you’ll read the papers yourself and we can follow the unfolding story together.

Seismology in space

Seismology – using the propagation of waves through bodies to work out their internal structure – is extremely useful. You can use it to find oil, track active faults or understand what is at the centre of the earth. The principles and mathematics developed by studying the earth apply to other bodies too. The Moon, Mars, even distant stars: seismology can help us understand these bodies also.

Moonquakes

Let’s start close to home. As part of the Apollo moon-landings a series of seismometers were installed and collected seismic data for nearly 8 years. The vibrations were caused by small moon-quakes and meteorite impacts. To help things along (and to assist with calibration) a few pieces of rocket and the ascent stages of several lunar modules were deliberately crashed into the moon (once they were no longer needed, as the NASA page helpfully points out).

The moon is not tectonically active in the way the earth is – most moonquakes had Richter scale magnitudes of less than 2. Events not caused by collisions were clustered on a monthly cycle, suggesting they were caused by changes in tidal forces as the moon orbits the earth. The discovery of some recent tectonic features (found in imaging from the Lunar Reconnaissance Orbiter) suggests something else is going on. Perhaps cooling and contraction of underground melt is causing these surface features to form.

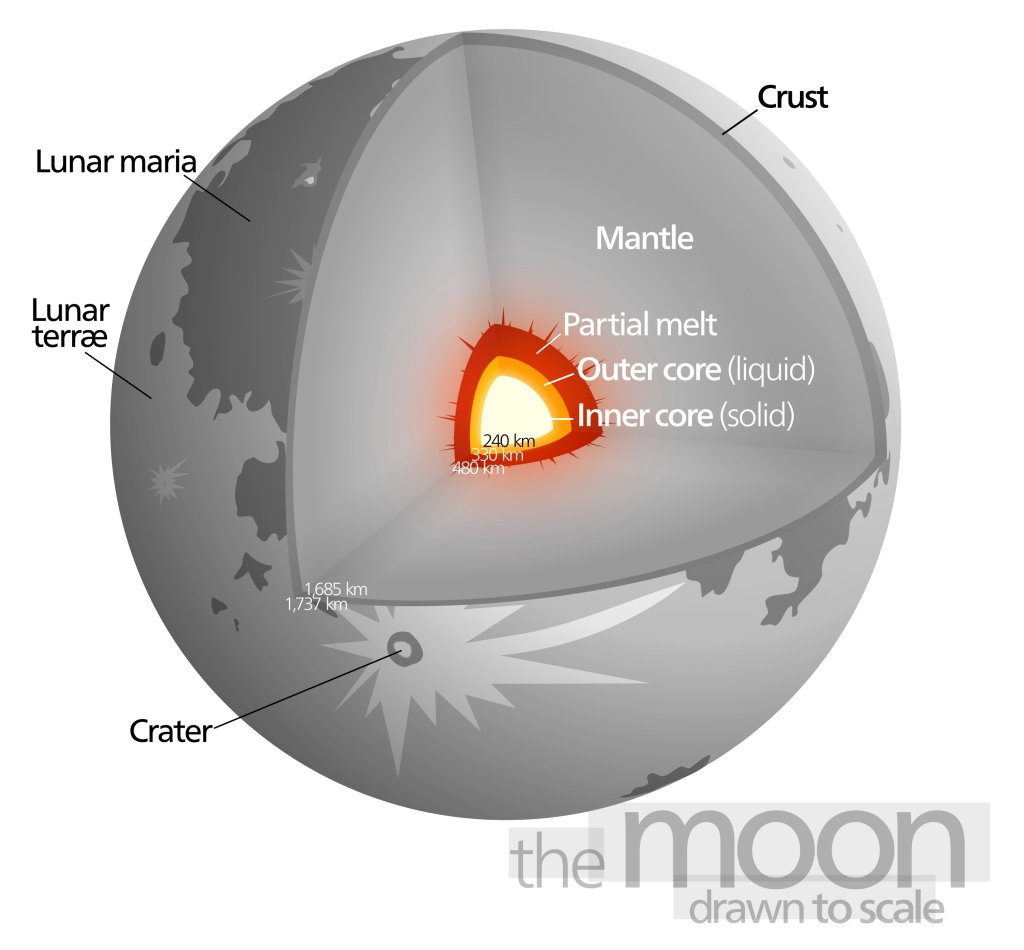
Diagram of the moon's interior. From Wikipedia.

Diagram of the moon’s interior. From Wikipedia.

This precious data was recently re-processed using the latest seismic techniques to tease out new details of the lunar interior. The seismic data was ‘messy’, due to smearing of signal in the upper 20 km of the crust, which is heavily fractured due to meteorite impacts. Modern processing allowed a clearer picture of the moons interior to be taken. It contains a metallic core, partly molten, but also a layer of molten rock at the base of the mantle.

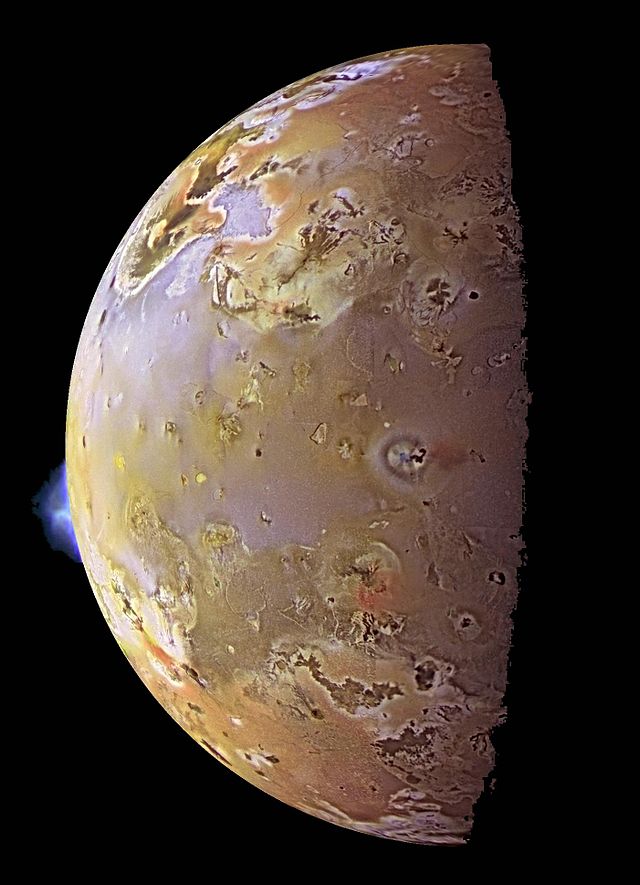
Knowing the interior of the Moon is important for understanding the earth too. The most popular model for the Moon’s origin involves a massive impact between the earth and another body. We need to know what ended up in both the Moon and the earth to understand this process. It’s also interesting to reflect on the fact that the Moon is smaller than – and so would cool faster than – the earth. So why is it molten at the base of the mantle and the earth is not? A recent paper suggests the molten layer persists due to frictional heating of the moon from tidal forces. The same process (but stronger) heats up the moons of Jupiter, for example creating volcanoes on Io1.

Active vulcanism on Io, caused by tidal heating. No seismometers here (yet).

Active vulcanism on Io, caused by tidal heating. No seismometers here (yet).

Marsquakes

Mars is the only planet inhabited solely by robots2. The first Martian robot3, the Viking lander, had a seismometer stuck on the leg. Sadly it wasn’t very sensitive and didn’t detect any marsquakes at all (just a lot of wind). The NASA InSight mission aims to put this right, landing sensitive instruments (including a seismometer) in 2016.

Starquakes

Seismology is a useful tool for studying stars.

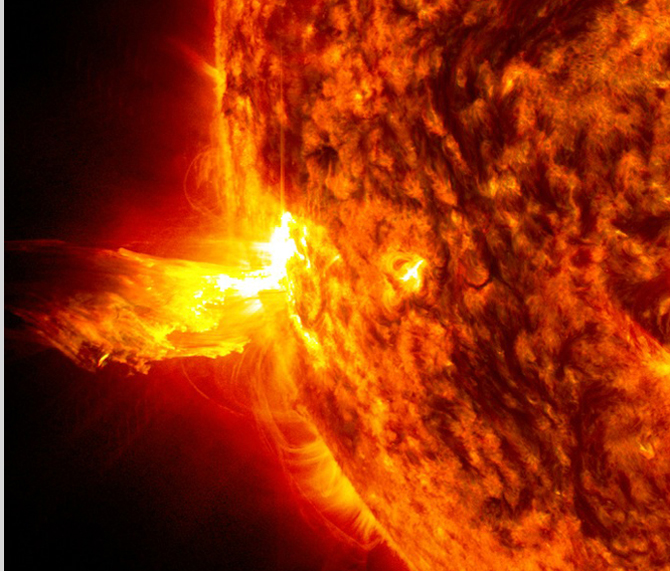
Our sun looking turbulent. Image from NASA.

Our sun looking turbulent. Image from NASA.

Yes, it really is.

There are no seismometers on the sun – they wouldn’t survive long4 – but it turns out that the same principles and mathematics we use to probe the earth also work on stars.

Asteroseismology is a form of seismology that uses pulsations in the light from stars to infer their internal structure. The outermost portion of a star is extremely turbulent and causes the entire star to vibrate like a dog waiting for a stick to be thrown. Instead of measuring the vibrations directly, we infer them from tiny variations in the intensity of the light, which we can measure from the delicious cool of our planet.

Sound waves (P-waves to seismologists) can be measured in both planets and stars. The sun has more exotic types of waves too and using these together gives us an invaluable view of the star’s internal structure. This in turn can be used to infer its age.

Similar techniques have been applied to Jupiter, which is also a ball of gas with something mysterious inside. Here the waves are detected by direct viewing of the surface5, as illuminated by the sun. The picture we’ve got so far is still rather fuzzy, but consistent with what we’d already guessed was there (a rocky core surrounded by metallic Hydrogen and then a Hydrogen and Helium atmosphere).

The Kepler missions search for planets orbiting other stars is linked to asteroseismology. The planets are discovered by the faint dimming effect as they pass in front of stars (the transit method). To do this we need to accurately know the size of the star and asteroseismology is the best way to do this. The ability to know the age of the star is useful too. Only a planet circling a relatively old star will have had enough time for life to evolve. The dream is of course to find a planet with intelligent life. If there is one, they are surely doing seismology. It’s such a useful technique to understand what lies beneath the surface of things.

The Constitution of the Interior of Earth, as Revealed by Earthquakes

How to tell if the loaf of bread in your oven is cooked? You can see the outside is nicely browned, but you can’t see the middle – is it doughy still? Give it a tap and listen. If it sounds hollow then it’s ready. The sound of the tap passes through cooked bread differently than through dough.

As with loaves of bread, so with the earth beneath us. Earthquakes give the earth a tap and we listen to the earth with seismometers, but the principles are the same. The sound and shaking caused by the tap passes through places we can’t ourselves get to and the way they are changed tells us about the material they’ve passed through.

Simple seismology

Every time an earthquake ‘taps’ the earth, it sends seismic waves whizzing off in all directions.  For those of us who live on the outside, the most dangerous types are those that travel along the surface, but we are interested here in body waves, the ones that travel through the earth’s interior. Imagine yourself watching a seismograph when an earthquake’s effects arrive1. The first set of twitches2 are caused by the arrival of the primary or P-waves. These travel fastest and work like sound waves – by compressing material in the direction of travel. Next arrive the secondary or S-waves which move forward while shearing material side to side (think of a slithering ssssnake).

What earthquakes can reveal

The first person to clearly identify P, S and surface waves on a seismogram3 was British scientist Richard Dixon Oldham. Born in 1858, he was child of the Empire. His father was Professor of Geology at Trinity College, Dublin. Following his father’s footsteps led him to the Geological Survey of India. Studying a 1897 magnitude 8.1 earthquake in Assam he spotted the distinct arrival of P, S and surface waves, due to their travelling at different speeds. What’s more, he linked these observations both to existing theory of how waves propagate in materials and to fault ruptures on the earth’s surface.

Ill-health took him back to Britain in 1903, where his research continued. In a lovely 1906 paper called “The Constitution of the Interior of Earth, as Revealed by Earthquakes” he showed what seismograms could tell you about the very centre of the earth.

In the introduction, he paints a picture of woe:

“Many theories of the earth have been propounded at different times: the central substance of the earth has been supposed to be fiery, fluid, solid, and gaseous in turn, till geologists have turned in despair from the subject, and become inclined to confine their attention to the outermost crust of the earth, leaving its centre as a playground for mathematicians.

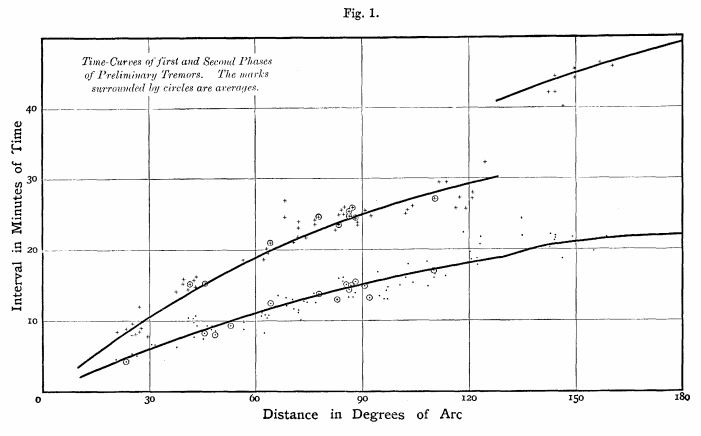
Taking data from a mere 14 earthquakes and similar number of stations, he plotted the interval between earthquake and wave arrival4 against distance in ‘degrees of arc’ (180 degrees of arc would be a wave that had passed directly through the earth to be measured at the point opposite the earthquake).

Figure 1 from Oldham (1906).

Figure 1 from Oldham (1906). The lower line is P-waves, the upper S-waves

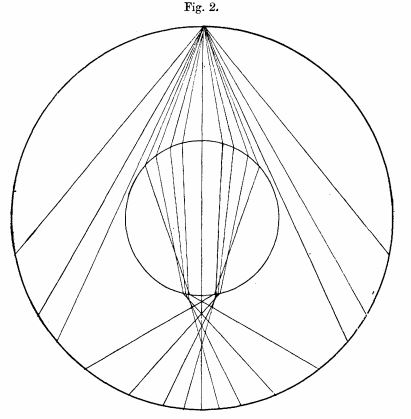
Oldham’s insight, rescuing the centre of the earth from the mathematicians, was to use the obvious change in the pattern at about 150 degrees to infer a core of very different composition from the surrounding material. A seismometer at greater than 150 degrees from the earthquake must trace rays that have passed through the deep earth – so the times it records tell us about the very core of the earth.

Figure 2 from the same paper.

Figure 2 from the same paper. Note how the paths taken by seismic waves are refracted by the changes in velocity at the core-mantle boundary

Oldham was confident that his data showed that “the central four-tenths of the [earth’s] radius are occupied by matter possessing radically different physical properties” and time has proved him right.

Seismology across the globe

Reading this paper is reminder that globalisation is not a modern phenomena. Oldham was drawing on recording stations from many place – not just from British Empire (New Zealand, Australia and South Africa) but also the Americas and the Russian Empire (Irkutsk, Tashkent and Tiflis). He refers to literature from Japan and papers written in both German and Dutch. The latter involved field work from the Dutch East Indies (now Indonesia).

While scientists across the world were communicating with each other, this was not necessarily done quickly. All the earthquakes he studied were between 12 and 4  years old.

A shadowy view of the inner core

As speculated upon by Oldham, but proved by others in the next few decades, S-waves don’t travel through the core, because it is liquid – seismometers on the opposite side of the earth don’t see an earthquakes S-waves as they are in the ‘shadow’ of the earth’s core. The patterns of refraction you see in Oldham’s diagram above mean that there is a shadow-zone for P-waves also.

In 1936, taking data from within the shadow zone of an earthquake in New Zealand, Inge Lehmann found waves that shouldn’t be there. Tracing their paths, she explained them by inferring a distinctive solid inner core that created more ways for rays to reflect and refract their way through (for more detail see this great write-up).

Seismic tomography

Seismic data can used for many things. Locating earthquake foci helps us trace patterns of faults across the globe and so better predict which areas of the surface are at risk. Making bangs at the surface and measuring the reflections from shallow sub-surface layers is a great way to find oil and gas. Using them to better understand the structure of the deep earth is known as global seismology, or seismic tomography.

The key principles of using seismology to study the earth’s interior were set in the early Twentieth Century. The time taken for waves to pass through the earth gives the speed they travelled, which tells you something about the properties of the material they passed through. Building up models of the interior of the earth allows you to trace the paths they took. Studying sets of paths that go through the same portion of the earth tells you something about the properties of that part of the earth.

Image of the deepest mantle from seismic tomography. Part of figure 7 from Steinberger et. al 2012. Used under CC licence. See reference below.

Image of the deepest mantle from seismic tomography. Part of figure 7 from Steinberger et. al 2012

Armed with millions of data points and highly sophisticated mathematical models modern seismologists are able to image the earth’s depths in detail, down to scales of a hundred kilometres. As well as understanding how things change with depth, they are also able to spot differences between different places at the same depth. The very base of the mantle in particular contains a lot of distinct areas with unusually low velocity.

Variations in seismic velocity at the same depth can be explained by variations in temperature or in composition. Either way, to explain the features seismology shows us, we need to bring some other sciences to bear. Let’s move to chemistry next.

References

Oldham R.D. (1906). The Constitution of the Interior of the Earth, as Revealed by Earthquakes, Quarterly Journal of the Geological Society, 62 (1-4) 456-475. DOI: http://dx.doi.org/10.1144/gsl.jgs.1906.062.01-04.21

Steinberger B. & T. W. Becker (2012). Subduction to the lower mantle , Solid Earth, 3 (2) 415-432. DOI: http://dx.doi.org/10.5194/se-3-415-2012

Subduction is not the end

Subduction is just the beginning. Stuck on the surface of the earth as we are, it’s easy to think that when oceanic lithosphere1 is destroyed when it vanishes into the mantle. But this is wrong. The more we manage to peer into the earth’s depths, the more clearly we see that subducted oceanic lithosphere is still down there. It’s arrival into the deep earth influences many things and sets of changes that in turn affect the surface.

Our growing understanding of what happens to oceanic lithosphere when it reaches the deep earth comes from the integration of a vast repertoire of scientific approaches. Physics, chemistry, mathematical modelling, high-pressure laboratory experiments, tiny grains in diamonds – all these things have something to tell us about the deep earth.

As in the deep oceans, so in the deep earth. We now know that both places are extremely varied environments, warped by extreme pressures, full of the weird and the exotic and some surprising relics from the past. Both are hard (or impossible) to visit, yet they still have influence over surface conditions.

A journey into the deep

This is the first of a series of posts on the deep earth. There’s a great mass of fascinating recent science out there that deserves to be better know. As a taster, let me tell you about lovely little Nature paper from 2005 that picks out the themes I hope to trace through future posts: how much of the deep earth is still mysterious, how we know what we know, the billion-year timescales and how the surface and depths are intimately linked.

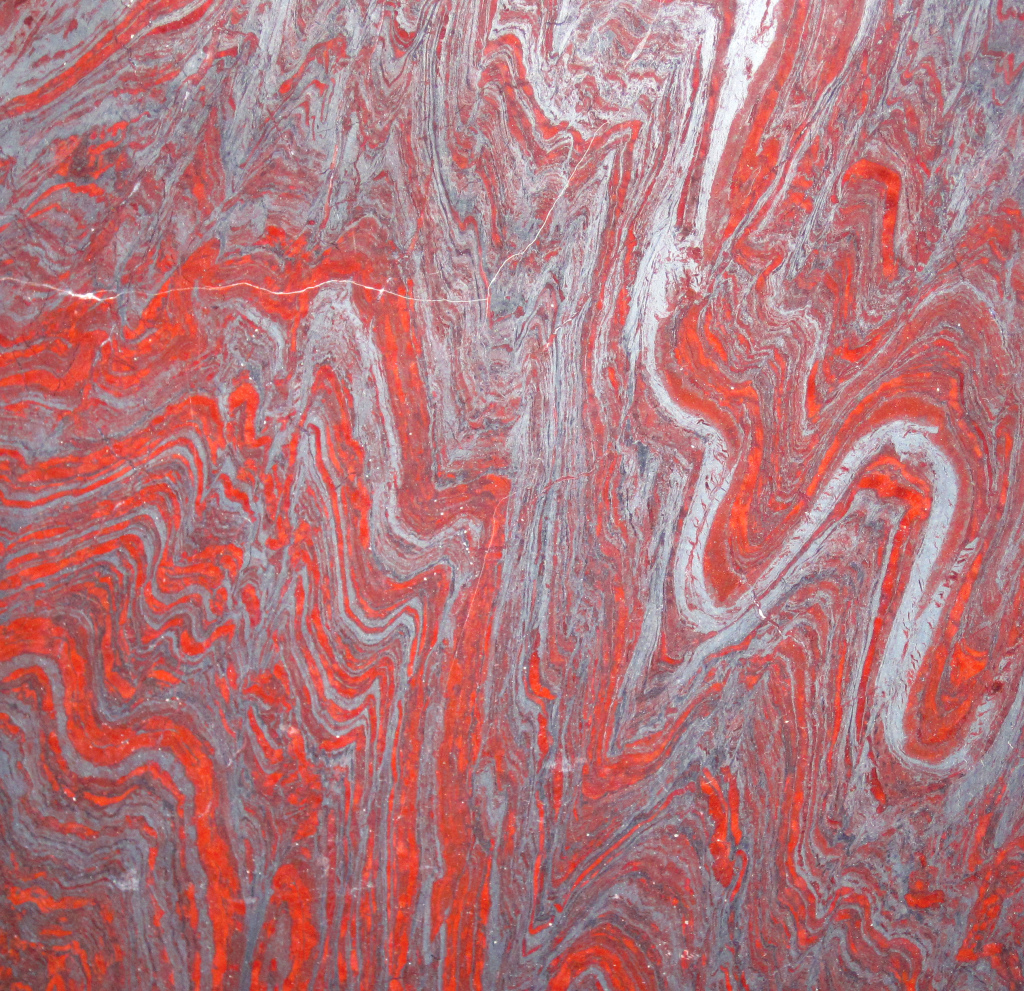
In the paper David Dobson and John Brodholt (both, then as now, at University College, London) speculate that some distinctive parts of the deepest mantle are formed from subducted banded-iron formation.

http://en.wikipedia.org/wiki/Itabira

Folded banded iron formation. Photo was not taken at the core-mantle boundary. Image from Wikipedia.

Seismic studies (tracing the shakings caused by earthquakes) have identified parts of the lowest mantle where earthquake waves pass through over 10% slower than expected. This means that these areas, known here as ultralow-velocity zones (ULVZs), must be in some way different – either they are made of different material or they are are at a different temperature to their surroundings.

Nobody knows what the ULVZs are made of, but our authors put the case that they contain large volumes of banded-iron-formation (BIF). Between 2.8 and 1.8 billion years ago photosynthetic organisms (probably bacteria) profoundly changed our planet’s atmosphere by producing vast quantities of Oxygen. One consequence was that ferric iron, dissolved in the ocean, bound with the Oxygen ‘waste’ and was precipitated out as solid minerals of magnetite and haematite. This process created vast volumes of marine sediments rich in iron. These banded iron formation deposits are found in rocks of this age from around the world.

Assuming this material was subducted what would happen and could it account for the properties of the ULVZs at the bottom of the mantle?  Tracing through the required steps, our authors show that BIF material would be dense enough to sink to the base of the mantle, able to separate out from the more normal material in the subducted plate and would not dissolve into the underlying iron-rich core. If these steps had occurred, then the material would match the measurable properties of the ULVZs.

Just because something is plausible, doesn’t make it true of course. Proving this link between ULVZs and BIFs definitively may never be possible. But one further clue exists: having an iron rich layer close to the edge of the core might help explain patterns of change in the length of the day we surface-dweller can observe.

The earth’s nutations are daily variations in its rotation. They are caused by the pull of the earth, sun and other bodies, but are also influenced by the degree to which the core and mantle spin independently or are coupled together. The outer core is liquid and the mantle solid, so they would be able to spin independently, but studies of nutations suggest there is some coupling – transfer of momentum – between them. If ULVZs are formed of BIFs and so very rich in iron, they would interact with the earth’s magnetic field causing electromagnetic coupling in a way that matches the observations.

It’s a mind-expanding idea. Sediments formed billions of years ago in a now alien atmosphere sit thousands of kilometres under our feet, subtly modulating the length of the day.

Deep cycles

When listening to a classical orchestra, most often we are paying attention to the high to middling frequency sounds – the violins, flutes and so on. The full experience – a live performance – is vastly enriched by the deepest, lowest frequency instruments. A full desk of double basses, or some bass clarinets make the air itself throb, producing a more physical, visceral and emotional experience2.

Our experience of living on this planet is enriched by our understanding of its cycles of change. The most frequent are most apparent: the year’s seasons; the carbon cycle; Milankovitch cycles that bring ice to sculpt the landscape. Subduction is one of the deepest, the slowest of them all – linking the familiar surface with the mysterious depths, it is the fundamental frequency in the orchestra of the earth.

References

The Nature paper is available here.

Dobson D.P. (2005). Subducted banded iron formations as a source of ultralow-velocity zones at the core–mantle boundary, Nature, 434 (7031) 371-374. DOI: http://dx.doi.org/10.1038/nature03430