
How to tell if the loaf of bread in your oven is cooked? You can see the outside is nicely browned, but you can’t see the middle – is it doughy still? Give it a tap and listen. If it sounds hollow then it’s ready. The sound of the tap passes through cooked bread differently than through dough.
As with loaves of bread, so with the earth beneath us. Earthquakes give the earth a tap and we listen to the earth with seismometers, but the principles are the same. The sound and shaking caused by the tap passes through places we can’t ourselves get to and the way they are changed tells us about the material they’ve passed through.
Simple seismology
Every time an earthquake ‘taps’ the earth, it sends seismic waves whizzing off in all directions. For those of us who live on the outside, the most dangerous types are those that travel along the surface, but we are interested here in body waves, the ones that travel through the earth’s interior. Imagine yourself watching a seismograph when an earthquake’s effects arrive1. The first set of twitches2 are caused by the arrival of the primary or P-waves. These travel fastest and work like sound waves – by compressing material in the direction of travel. Next arrive the secondary or S-waves which move forward while shearing material side to side (think of a slithering ssssnake).
What earthquakes can reveal
The first person to clearly identify P, S and surface waves on a seismogram3 was British scientist Richard Dixon Oldham. Born in 1858, he was child of the Empire. His father was Professor of Geology at Trinity College, Dublin. Following his father’s footsteps led him to the Geological Survey of India. Studying a 1897 magnitude 8.1 earthquake in Assam he spotted the distinct arrival of P, S and surface waves, due to their travelling at different speeds. What’s more, he linked these observations both to existing theory of how waves propagate in materials and to fault ruptures on the earth’s surface.
Ill-health took him back to Britain in 1903, where his research continued. In a lovely 1906 paper called “The Constitution of the Interior of Earth, as Revealed by Earthquakes” he showed what seismograms could tell you about the very centre of the earth.
In the introduction, he paints a picture of woe:
“Many theories of the earth have been propounded at different times: the central substance of the earth has been supposed to be fiery, fluid, solid, and gaseous in turn, till geologists have turned in despair from the subject, and become inclined to confine their attention to the outermost crust of the earth, leaving its centre as a playground for mathematicians.”
Taking data from a mere 14 earthquakes and similar number of stations, he plotted the interval between earthquake and wave arrival4 against distance in ‘degrees of arc’ (180 degrees of arc would be a wave that had passed directly through the earth to be measured at the point opposite the earthquake).
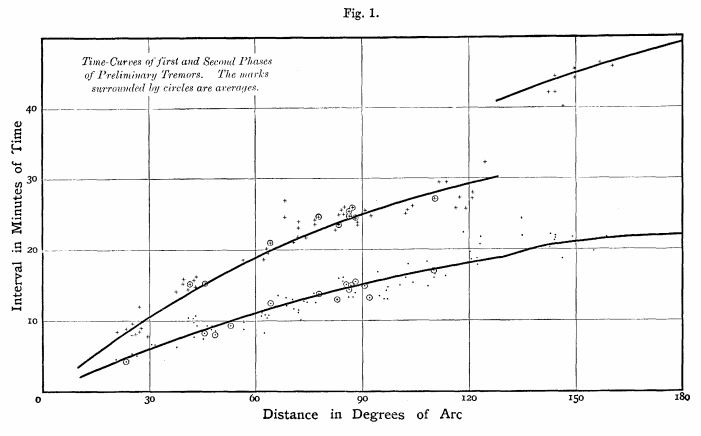
Figure 1 from Oldham (1906). The lower line is P-waves, the upper S-waves
Oldham’s insight, rescuing the centre of the earth from the mathematicians, was to use the obvious change in the pattern at about 150 degrees to infer a core of very different composition from the surrounding material. A seismometer at greater than 150 degrees from the earthquake must trace rays that have passed through the deep earth – so the times it records tell us about the very core of the earth.
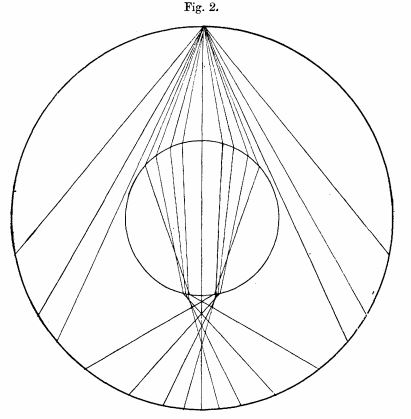
Figure 2 from the same paper. Note how the paths taken by seismic waves are refracted by the changes in velocity at the core-mantle boundary
Oldham was confident that his data showed that “the central four-tenths of the [earth’s] radius are occupied by matter possessing radically different physical properties” and time has proved him right.
Seismology across the globe
Reading this paper is reminder that globalisation is not a modern phenomena. Oldham was drawing on recording stations from many place – not just from British Empire (New Zealand, Australia and South Africa) but also the Americas and the Russian Empire (Irkutsk, Tashkent and Tiflis). He refers to literature from Japan and papers written in both German and Dutch. The latter involved field work from the Dutch East Indies (now Indonesia).
While scientists across the world were communicating with each other, this was not necessarily done quickly. All the earthquakes he studied were between 12 and 4 years old.
A shadowy view of the inner core
As speculated upon by Oldham, but proved by others in the next few decades, S-waves don’t travel through the core, because it is liquid – seismometers on the opposite side of the earth don’t see an earthquakes S-waves as they are in the ‘shadow’ of the earth’s core. The patterns of refraction you see in Oldham’s diagram above mean that there is a shadow-zone for P-waves also.
In 1936, taking data from within the shadow zone of an earthquake in New Zealand, Inge Lehmann found waves that shouldn’t be there. Tracing their paths, she explained them by inferring a distinctive solid inner core that created more ways for rays to reflect and refract their way through (for more detail see this great write-up).
Seismic tomography
Seismic data can used for many things. Locating earthquake foci helps us trace patterns of faults across the globe and so better predict which areas of the surface are at risk. Making bangs at the surface and measuring the reflections from shallow sub-surface layers is a great way to find oil and gas. Using them to better understand the structure of the deep earth is known as global seismology, or seismic tomography.
The key principles of using seismology to study the earth’s interior were set in the early Twentieth Century. The time taken for waves to pass through the earth gives the speed they travelled, which tells you something about the properties of the material they passed through. Building up models of the interior of the earth allows you to trace the paths they took. Studying sets of paths that go through the same portion of the earth tells you something about the properties of that part of the earth.

Image of the deepest mantle from seismic tomography. Part of figure 7 from Steinberger et. al 2012
Armed with millions of data points and highly sophisticated mathematical models modern seismologists are able to image the earth’s depths in detail, down to scales of a hundred kilometres. As well as understanding how things change with depth, they are also able to spot differences between different places at the same depth. The very base of the mantle in particular contains a lot of distinct areas with unusually low velocity.
Variations in seismic velocity at the same depth can be explained by variations in temperature or in composition. Either way, to explain the features seismology shows us, we need to bring some other sciences to bear. Let’s move to chemistry next.
References
Oldham R.D. (1906). The Constitution of the Interior of the Earth, as Revealed by Earthquakes, Quarterly Journal of the Geological Society, 62 (1-4) 456-475. DOI: http://dx.doi.org/10.1144/gsl.jgs.1906.062.01-04.21
Steinberger B. & T. W. Becker (2012). Subduction to the lower mantle , Solid Earth, 3 (2) 415-432. DOI: http://dx.doi.org/10.5194/se-3-415-2012

interesting and clear post … learned a lot, thanks.
Pingback: Seismology in space | Metageologist
Pingback: Tasting the earth: mantle geochemistry | Metageologist
Pingback: Hot spot volcanoes: no plumes required? | Metageologist
Pingback: Plate Tectonics | Pearltrees
Pingback: Plate Tectonics | Pearltrees