The deceptive simplicity of a metamorphic rock

I’d like to introduce you to a rock.

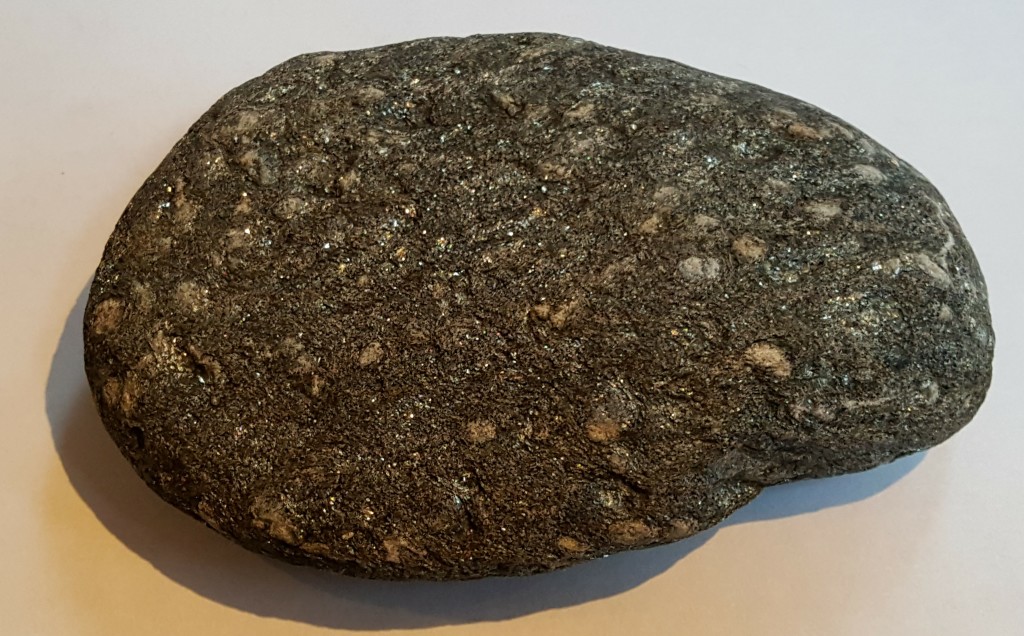
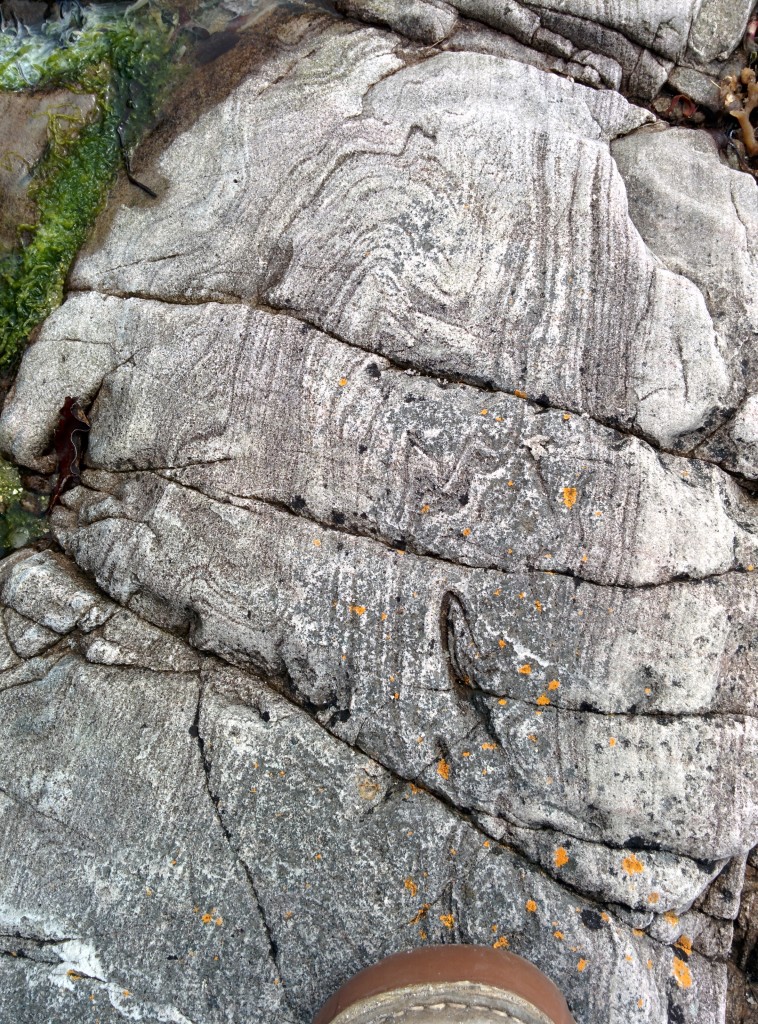
20161218_122601_007

Pretty isn’t it? The white crystals caught my eye, as they did that of three different geologists of the British Geological Survey, who between them collected 5 different samples from the same small area of Scotland.

When did these crystals grow? How old are they? These rocks here are part of the Moine supergroup which started as a pile of sediments a billion years ago and the last geological event in this part of Scotland was a mere 60 million years ago, so there’s a wide possible range.

The first and easiest tool available to a geologist is to establish the age of something relative to other events. The white spots are potassium feldspar that grew when the rock was metamorphosed – changed from a muddy sand into something (even) more interesting. Metamorphosis is most often associated with geological structures. Minerals most often form because rocks are buried deep and heated and this squashes them,  flattening or folding the sedimentary layers and metamorphic minerals alike.

img_20160530_180945-1

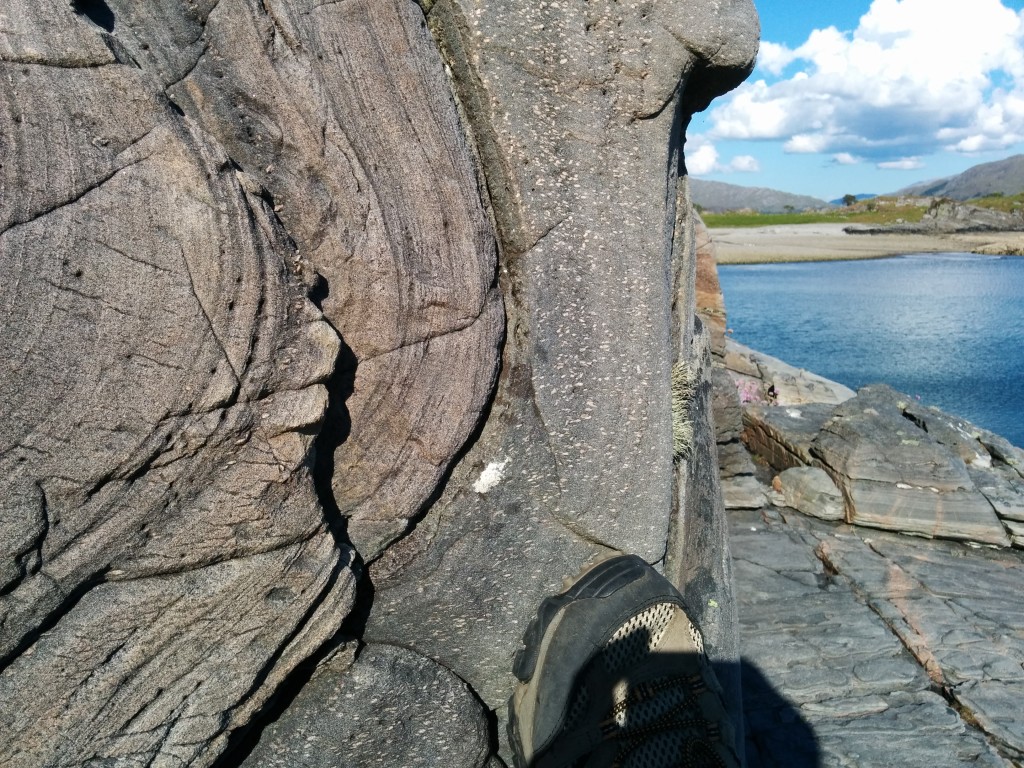
Yes the sea is azure blue and the beach empty. It was a fabulous week’s holiday.

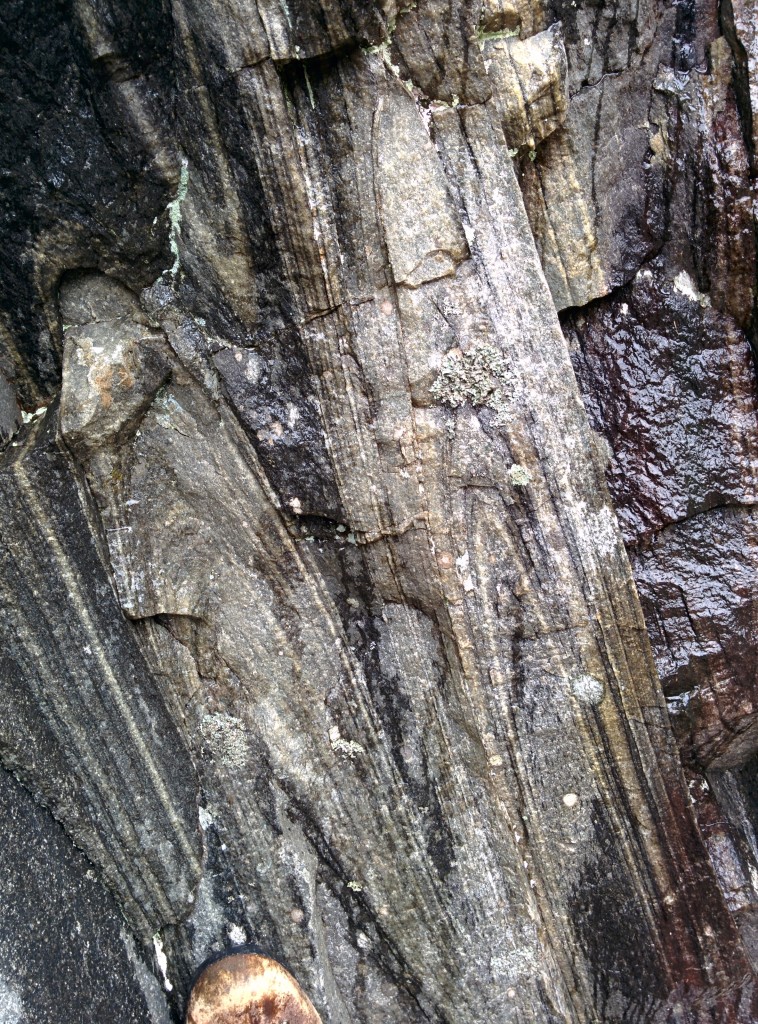
In this picture we see a set of lines folded round which are original sedimentary layers. Our rock comes from the darker layer to the right. The white spots within it are roughly flattened along a plane that passes through the middle of the fold. This suggests they formed at the same time as the rocks were folded.

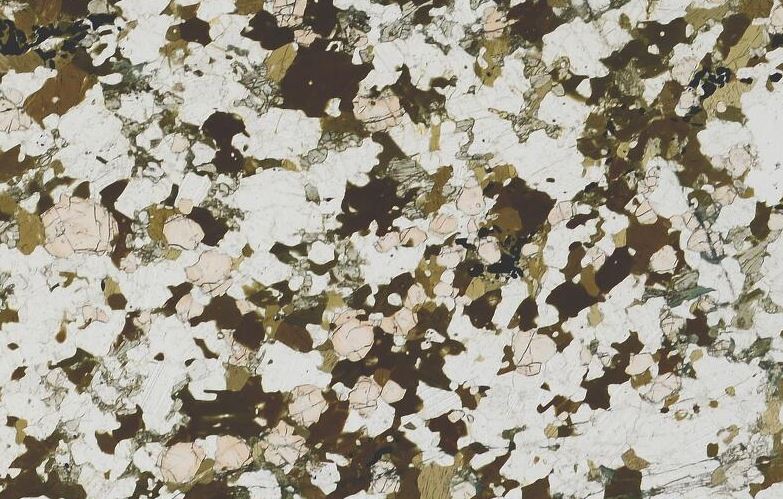
There is a little more detail to be seen in thin sections made by the state-funded geologists who have passed here before me1.

http://www.bgs.ac.uk/data/britrocks/britrocks.cfc?method=viewSamples&sampleId=351198

Image taken from BGS thin section image archive

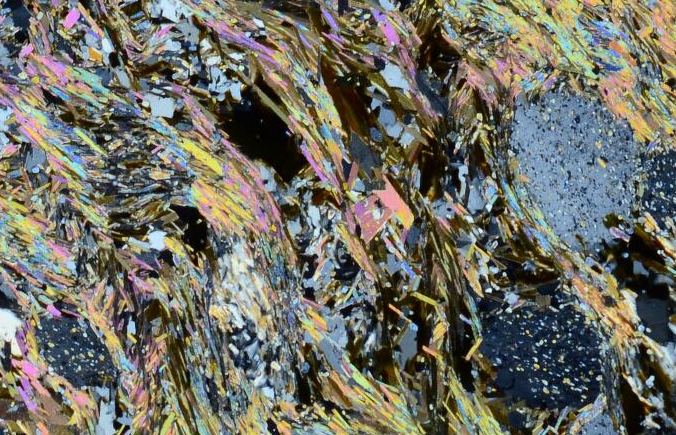
Here we are looking down a microscope at the light that has passed through a thin slice of the rock – we are peering into its soul. The plain white areas are the feldspar crystals which we can call porphyroblasts if we are feeling fancy (meaning they grew as big crystals during metamorphism). Notice also the patterns made by the long and thin red-brown and grey mica crystals. There are little folds.

xpl-detail

With more magnification (and in cross polarised light, so the minerals look different) you can see that the feldspars contain grains of other minerals that a strung out in lines. These are minerals that were swallowed by the growing feldspar and give a glimpse of earlier structures.

Here’s one interpretation of what is going on. An early alignment of the minerals was parallel to the sedimentary bedding. This was horizontal in our field of view. The feldspar grains grew over this fabric. Later the rock was squashed in a different direction, causing the folding we see in the outcrop and in the thin section. The mica grains are now mostly vertical with only a few areas staying flat. Some feldspar grains stayed put, but most have been rotated so that their long axes are vertical.

I’ve deliberately gone for the most simple explanation, but it’s a plausible one based on what we see in the outcrop. Two sets of squashing and one phase of mineral growth. Nevertheless its likely that we are not seeing the full picture here. The same package of rocks looks very different depending on where you are. About five kilometres west of where my rock came from, similar Moine sediments have vertical layers, but so little deformed that sedimentary cross bedding is visible.

Cross bedding in vertical Moine sediments

Cross bedding in vertical Moine sediments

Nearby there are folds, but these were formed when it was still sediment, the layers folding due to slipping of sand. You can tell this because the layers either side of the folds are flat.

Soft sediment deformation in vertically bedded Moine sediments

Soft sediment deformation in vertically bedded Moine sediments

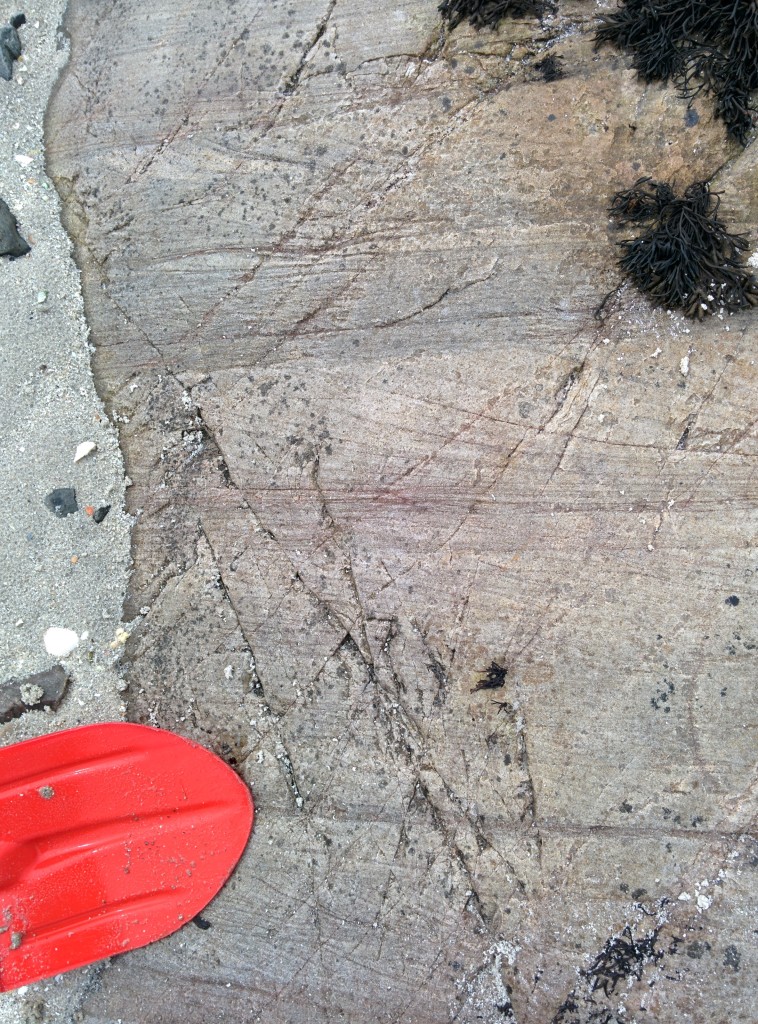
Go ten kilometres east and the you are still in Moine sediments, but they are rather more intensely deformed and metamorphosed. Here the original sedimentary layers are stretched out into layers as thin as centimetre.

Intense folding in Moine sediments, near the Sgurr Beag thrust.

Intense folding in Moine sediments, near the Sgurr Beag thrust.

Clearly, it’s important not just to look at a single outcrop – which is where geological mapping comes in. This shows that these metamorphic rocks are part of a wide area over northern Scotland. This is unconformably overlain by undeformed sediments of Devonian age. So sometime between 1000 and 416 million years ago these sediments were heated and folded – that’s when the white crystals grew.

These are old techniques and technology marches on. Modern earth scientists, armed with sophisticated machines, scary acid and an understanding of radioactive decay are able to date the age of metamorphic events and even directly date the age of individual metamorphic minerals.

The Moine rocks of Scotland are well studied. Bring together hundreds of radiometric dates, highly detailed mapping and the study of thousands of outcrops and thin sections and you get a picture of almost terrifying complexity.

It turns out that the white grains in my rock sample with its apparently simple history could have formed in any one of at least five different occasions when metamorphic minerals formed in the area.  Each one of these represents a significant event – an ocean closing, an arc smashing itself into oblivion against an unyielding continent – yet somehow a single rock shows only a single part of this saga.

I’ll tell this complicated geological history, and why it’s not visible in a single outcrop in another post.

Beyond plate tectonics

Plate tectonics is the core unifying concept that has underpinned our understanding of the solid earth for over 50 years. To describe your research as moving “beyond plate tectonics” is quite a claim, but Trond Torsvik and the group he leads have some remarkable science to back it up. By tracking the movement of the earth’s plates over half a billion years they trace the effects of hot plumes of rock rising from the edges of structures sitting just above the earth’s core. Their research seeks to explain the origin of diamonds, immense volcanic eruptions linked to mass extinction events, the break-up of continents and how shifts in the earth’s axis caused glaciation in Greenland.

Dance of the plates

Trond Torsvik is a Norwegian scientist with a background in palaeomagnetism – studying fossils of the earth’s past magnetic field frozen in rocks – to trace the past locations of continents. Palaeomagnetism can tell you the latitude at which an ancient rock formed1. Torsvik worked with those in other disciplines – palaeontology and geology – to trace the slow joining and splitting of ancient continents.

This research (which involved many other scientists) has given us a pretty good view of how the earth’s plates moved around over the last 500 million years. But these movements are only the surface expression of the flow of the underlying rocks, the earth’s mantle. Now, as director of the Centre for Earth Evolution and Dynamics at the University of Oslo (CEED) Torsvik seeks to produce an integrated understanding of deep mantle flow – mantle dynamics – and how it drives plate tectonics and other surface processes.

Undoing subduction

The earth’s mantle convects. Although made of solid rock, over geological time-scales it flows like a liquid and we understand the physics of this process well enough to produce computer models of it. One important factor is subduction – as oceanic crust cools it sinks back into the mantle, changing the patterns of flow.

Based on our understanding of how the continents moved in the past, the CEED group (Bernhard Steinberger in particular) have calculated where ancient subduction zones were and therefore where the subducted plates ended up in the deep earth. These models of ancient mantle flow and subduction link our surface observations with deep-earth processes.

The diagrams below show how subduction zones have moved over time. The outline of the continents is fixed, representing a stable reference frame. The coloured lines show how subduction zones at the edges of plates have moved over time2.

The red lines correspond to modern subduction zones, but the colour coding shows how where they used to be in the past. Note how the western edge of the North America plate has moved east over time3. Also note how it shows the subduction zone that used to exist north of the Indian plate and which ceased around 60 million years ago as India and Asia collided (as the oceanic plate in between was completely subducted).
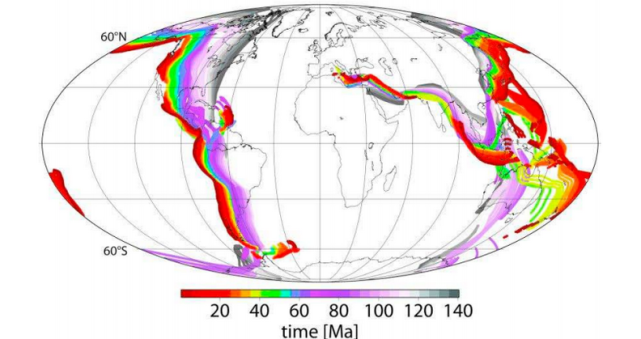
Steinberger, B., & Torsvik, T. (2012) figure 2b

Steinberger, B., & Torsvik, T. (2012) figure 2b

Here we have the same picture, but starting from 140 million years ago and moving back to 300 million years ago, the beginning of the Permian. These are the subduction zones that surrounded the ancient continent of Pangea.
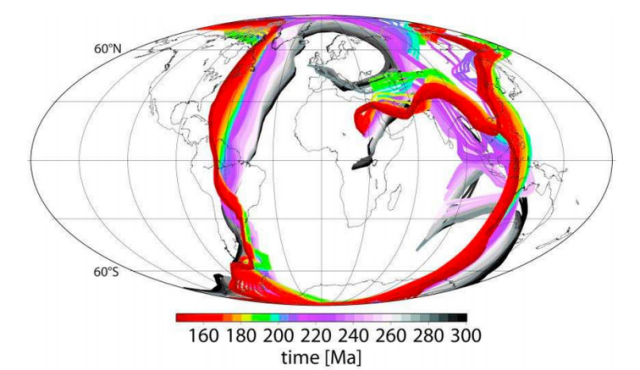
Steinberger, B., & Torsvik, T. (2012) figure 2a

Steinberger, B., & Torsvik, T. (2012) figure 2a

The diagrams aren’t showing it directly, but they remind us that the oceanic crust that passed through these subduction zones is still down there in mantle; imagine the series of coloured lines as sheet descending down into the earth – that is a rough image of what is down there.

Deep structures affect the surface

Mantle plumes have long been suggested as the cause of chains of volcanic islands (like Hawaii). Many believe the concept has been overused and that some proposed plumes don’t exist – this is a controversial area.  Torsvik and CEED have taken the debate forward by presenting a testable hypothesis – that big plumes form around the edge of structures at the base of the mantle and that this has been happening for hundreds of millions of years.

Seismic tomography shows mysterious lumps at the very base of the mantle. They are called Large Low Shear Velocity Provinces (LLSVPs) and one sits under Africa and another under the Pacific. They are probably patches of different composition, but no-one knows for sure.

The CEED group believe these LLSVPs haven’t moved for a long time, so they took their models of plate movements to show how surface features have moved over them over time. They also plotted the locations of unusual volcanic features called kimberlites and vast piles of lava called Large Igneous Provinces (LIPs). The diagram below shows an example from 160 million years ago – here they’ve plotted the ancient location of the continents, plus that of the LLSVPs (in red). Note that kimberlites are found where areas of craton (thick old continental plate shown as grey areas) are above the edges of an LLSVP. Kimberlites are the host rocks for diamonds, so this result is not of purely academic interest.
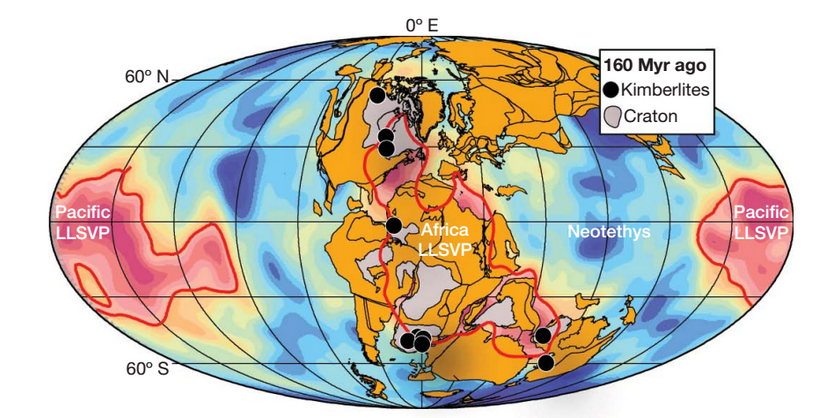
Torsvik, T., et. al (2010), figure 2

Torsvik, T., et. al (2010), figure 2

This pattern holds when the analysis is done for other periods in the past, also when looking at modern active hotspots. Put all the data together and the pattern is quite impressive. Note that kimberlites and hotspots are not shown in their current position4 but the continents are.

Torsvik, T., et. al (2010) figure 1

Torsvik, T., et. al (2010) figure 1

This is a startling result. The fit isn’t perfect (the white dots don’t fit the pattern) but nothing on this messy planet of ours ever is.

So why are LIPs and kimberlites associated with the edges of the LLSVPs? The linking factor is deep plumes, which interact with deep continental lithosphere to produce kimberlites (and bring diamonds to the surface). Big plumes cause LIPs and the one shown above around the location of modern-day St Petersburg is the Siberian Traps which caused the largest mass extinction ever know at the Permian-Triassic boundary.

Surface processes affect the deep earth

What links plumes and the edges of the LLSVPs? Think back to those diagrams of ancient subduction zones and those curtains of ancient oceanic crust sinking into the mantle. Modelling of mantle flow through time shows that the ancient subducted crust reaches the base of the mantle where it pushes up against the LLSVPs. The flow of heat from interior of the earth to the surface drives the hot material rising up through the mantle but the interaction between plate and LLSVPs provides plausible mechanisms to get plumes started – the sinking plate pushes on the edge of an LLSVP and creates domes that turn into plumes.

What I like about this work is that by presenting a clear mechanism and predictions of how the deep and surface earth work together it is eminently testable. If mantle plumes form at the edge of LLSVPs, how does this affect the chemistry of the molten rocks that reach the surface? Perhaps one side contains the LLSVP material and another not. Any new seismic tomography data can be compared with the computer models that underlie this research. Does this research give us a new way to find diamond deposits? Finding answers to any of these questions will either help confirm the hypothesis or take research in new and interesting directions.

Our wobbly world

So much science, so little time! But allow me to test your attention span a little more and talk about my favourite example of how research from CEED links the surface and the depths of this planet.

The presence or absence of ice on this planet is one of the longer-term climatic cycles observable in the fossil record. For all of the last half-billion years, glaciation has been restricted to the southern hemisphere – until the last few millions years. Climate is the major control over glaciation, but a paper this year points to three ways in which deep earth processes caused glaciation in Greenland to start.
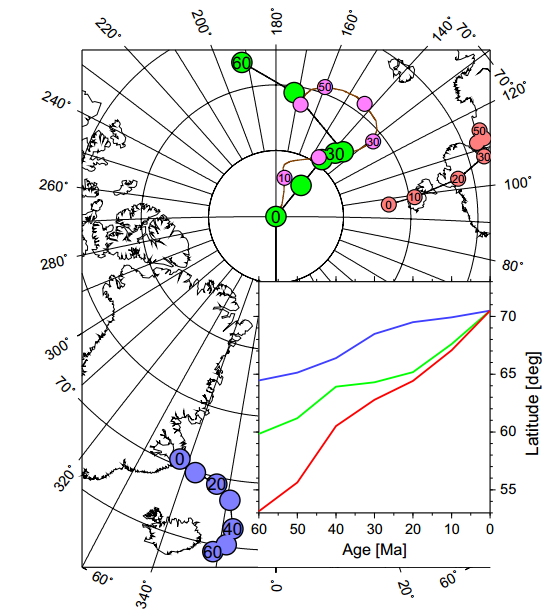
Steinberger Terra Nova figure 5

Steinberger, B., et. al, figure 5

Firstly, Greenland is unusually high (and so cold) – this is because the deep plume now centred on Iceland thinned the Greenland lithosphere and, from five million years ago, fresh ‘plume pulses’ pushed it up. Secondly, standard plate-tectonics has caused it to drift north (blue points and lines in diagram) by 6 degrees. Thirdly and most mind-bogglingly, changes in the distribution of density of the earth’s interior have caused the earth’s pole of rotation to move closer to Greenland by 12 degrees (green points are observation, pink are theoretical calculations).

If you’ve ever pushed a barrel or ball part-full of water, you’ve some sense of what lies behind the third cause, known as “true-polar wander”.  Classroom globes have have a solid rod down the earth’s axis, but the real earth does not – it rotates around an axis called the ‘maximum moment of inertia’ that is determined by the distribution of mass within the planet. If this distribution of mass changes over time, then the axis changes and the poles shift to compensate. Modelling suggests that the shift of the north pole towards Greenland was caused by increased subduction under East Asia and South America.

Plate tectonics explains subduction. But models that show subduction tweaking the earth’s axis to bring glaciers or tickling the deep earth to create mantle plumes that can kill off nearly all life, break up super-continents, and send diamonds tinkling up to the surface. That really is going beyond plate tectonics.

References & image credits

This post is necessarily a skim over large amounts of complicated research. If you don’t believe it’s true, at least read the papers yourself. All are available online.

Source of images are in the image text. All either from open-source papers or produced under fair-use.

This Nature paper links LLSVPs, diamonds, plumes and LIPs.
Torsvik, T., Burke, K., Steinberger, B., Webb, S., & Ashwal, L. (2010). Diamonds sampled by plumes from the core–mantle boundary Nature, 466 (7304), 352-355 DOI: 10.1038/nature09216

This details the mathematical models linking subduction, LLSVPs and the initiation of plumes.
Steinberger, B., & Torsvik, T. (2012). A geodynamic model of plumes from the margins of Large Low Shear Velocity Provinces Geochemistry, Geophysics, Geosystems, 13 (1) DOI: 10.1029/2011GC003808

This links deep-earth processes to the onset of glaciation in Greeland.
Steinberger, B., Spakman, W., Japsen, P., & Torsvik, T. (2015). The key role of global solid-Earth processes in preconditioning Greenland’s glaciation since the Pliocene Terra Nova, 27 (1), 1-8 DOI: 10.1111/ter.12133

This contains the detail about true polar wander.
Steinberger, B., & Torsvik, T. (2010). Toward an explanation for the present and past locations of the poles Geochemistry, Geophysics, Geosystems, 11 (6) DOI: 10.1029/2009GC002889

Into the Third Dimension: using Google Maps to know what’s underground

Much of the earth’s surface is covered by sedimentary rocks. These form as sediment settles on the surface. As the types of sediment change – sand to mud to sand again – different layers are formed, some hard some soft. The patterns these layers make are responsible for some of the most interesting Great Geology in Google Earth.

Sedimentary layers start off flat1 but as plates collide and squash, they may be folded, like pushing the edge of a rug. The resulting 3-dimensional structures are later eroded and brought to the surface – itself a 3-D structure. The 2-D lines we see on the aerial images below are formed by the intersections of these different 3-D structures. This can make interpreting them a little difficult, as we’ll see.

Compare and contrast the next two images. First look at these smooth lines from Mexico.

Versus these zig-zag ones from Argentina.

Both of these patterns involve sedimentary rocks, but the causes of the wavy lines are very different. The secret is to work out the shape of land surface and then infer the shape of the sedimentary layers. Rivers are our friends here. In Argentina there is a clear relationship between them and the lines the layers are making on the ground. Every zig has a river in it and every zag is a little hill in between. The sedimentary layers are pretty much flat and the pattern of lines is caused by the shape of the land surface. Imagine cutting a wedge out of a layered cake – this is what it would look like.

In Mexico the pattern is mostly due to folding of the sediments. The beautiful curves and swoops are due to flat layers having been slowly buckled as the earth’s plates rearranged themselves.

Analysing these shapes and making sense of them is bread-and-butter for geologists. A bed-rock part of any geological education. Typically we use maps, but in desert areas photos tell everything we need to know.

One important trick geologists learn is to create cross-sections, drawing a slice through the earth to show how the folded rocks continue underground. One of the many types of sedimentary layer is a coal-seam, so you can see how this is not a purely academic exercise.

A good geological map will have symbols showing how many degrees tilt the layers have and in which direction they are pointing down. Without these we can’t do a proper cross-section. But using our friends the rivers and streams we can still tell a lot.

Here’s a nice fold. Imagine one of the layers is rich in valuable unobtanium and you want to mine it2. You can trace a line where the edge of it is, but which side of the line is the rest on? Think of it another way, are we looking down at an arch with the top sliced of (an antiform) or a basin (a synform)3 Should you sink your unobtanium mine-shaft in the middle of the fold or around the edge? If you get it wrong, you’ll choose the part where the valuable layer has already been eroded away from.

dipToTheNorthLook at the rivers (streams/creeks) that cross the layers on the top side of the fold. Notice a pattern? Every time the stream cross the layers, it makes a little V-shape, with the sharp bit of the V pointing North. A stream bed is always lower than its surroundings so it gives us a glimpse into the third dimension. Cut into the layer and it’s edge moves north – it’s deeper the further north you – it’s dipping to the north – it’s a tilted sheet that disappears under the ground to the north.

dipToTheSouthWe can check if we’re right because this a fold. For this trick to work the south side of the fold should have the opposite pattern. We are looking at a breached arch and the southern side should have the opposite pattern. It’s harder to see on this side (probably because the beds are tilted more nearly vertically and the effect is smaller) but indeed, our little V-shapes point the other way.

This 3-D stuff is hard work. Yet it’s something geologists have to be good at (maybe there’s some link with the strong anecdotal evidence that they tend to be left-handed). If you need some help, some of these Google Maps have good photos associated to help you get another view of the structures. Alternatively this post makes the same link.

Let’s leave you with some sheer aesthetic pleasure. Some totally flat layers turned into beautiful patterns by erosion.

A new paradigm for Barrovian metamorphism?

George Barrow

George Barrow (image via BGS)

The phrase ‘new paradigm’ is a little shop-worn but it still catches the eye. To see it used in a “discussion and reply” on a dry-looking metamorphic petrology paper is really something unusual. Tracing through these articles really shows how metamorphic petrology can get to the heart of understanding what happens in the core of mountain belts.

The example of “discussion and reply”1 I’m discussing here is truly remarkable. Everyone is terribly polite and there is lots of new data and ideas contained that shed light on a classic area for the understanding of metamorphism. It also illustrates the perils and challenges of interpreting complex rocks that formed in the heart of an ancient mountain.

A paper worth discussing

The original paper, entitled ‘Metamorphic P–T and retrograde path of high-pressure Barrovian metamorphic zones near Cairn Leuchan, Caledonian orogen, Scotland’ is by Kasumaza Aoki of Tokyo, Brian Windley of Leicester and others. It studies metamorphic rocks from the Scottish Highlands. You’ve heard of Barrovian metamorphism, (if not, get thee hence), this is the type locality, where George Barrow first identified zones of rock defined by particular ‘index’ minerals.

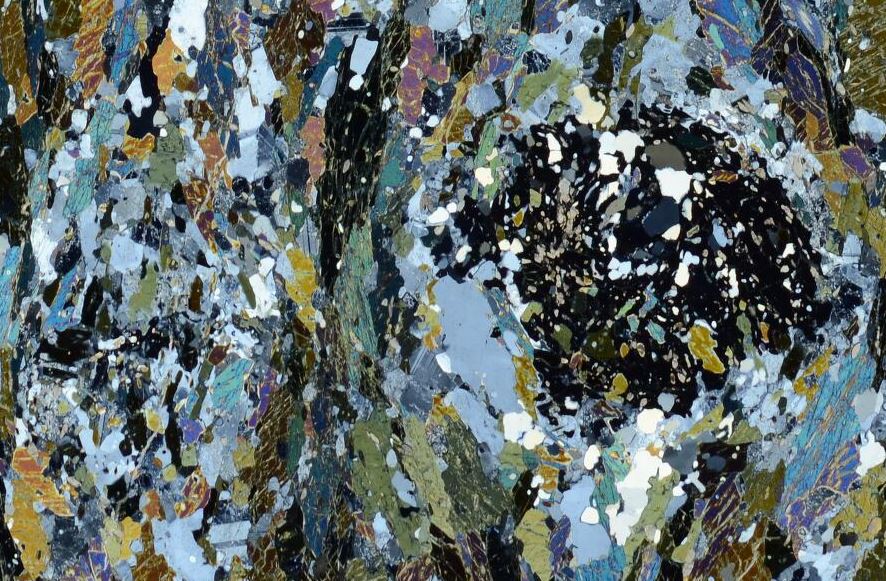
Sample of Cairn Leuchan Gneiss, collect by George Barrow himself. Garnet, plagioclase, Hornblende (brown), pyroxene (green).

Sample of Cairn Leuchan Gneiss, collected by George Barrow himself! Garnet, plagioclase, hornblende (brown), pyroxene (green). From BGS, sample S8146

Barrovian metamorphism is typical of mountain belts. It’s thought to be caused  by thrusting and stacking of rock slices within a growing mountain belt, that buries and heats up the rocks within it – causing metamorphism. This model is simple, classic and perhaps wrong. Our original paper looks at a slice of high grade rocks from the hottest, sillimanite zone. Detailed metamorphic petrology shows that “the rocks underwent high-pressure granulite facies metamorphism at P = c. 1.2–1.4 GPa and T = c. 770–800 °C followed by amphibolite facies metamorphism at P = c. 0.5–0.8 GPa and T = c. 580–700 °C”.

The later metamorphism is pretty standard for the area, but the earlier high pressure phase is unusual, suggesting these rocks were buried much deeper than previously thought. Our authors conclude that high-grade Barrovian metamorphism is retrograde, the metamorphic minerals formed as the rocks moved back towards the surface, masking an earlier deeper phase. They also suggest that the measured high-pressure metamorphism was also formed *on the way up* and that these rocks (perhaps all rocks in the area, there’s evidence nearby at Tomatin) had previously been down to eclogite or blue-schist depths.

If this paper were science journalism (or course it isn’t) you could accuse it of ‘burying the lede’ – the abstract focuses purely on what they proved. The major implications of their results are made much more explicit in the Discussion by Daniel Viete and others. S98121XPL

dd

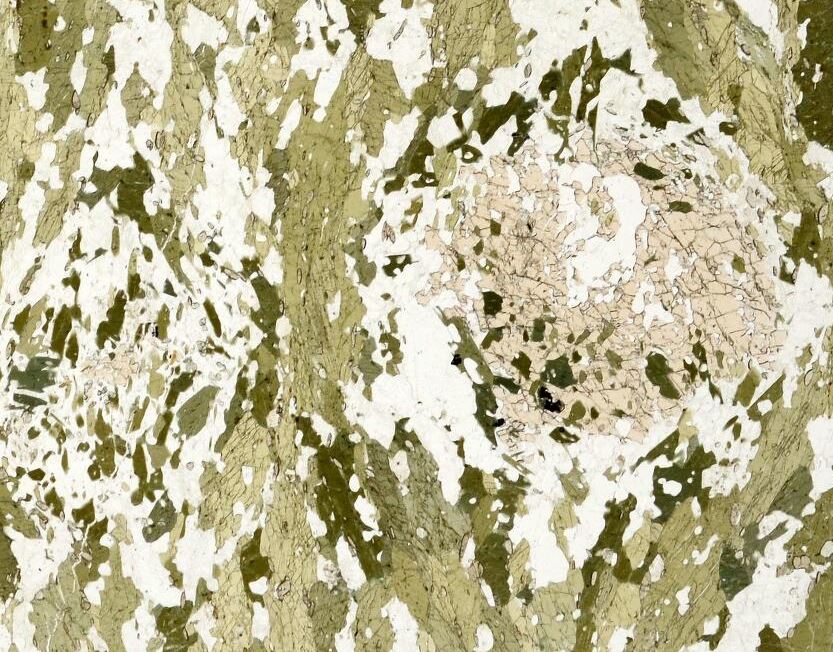
BGS sample S98121. Garnet amphibolite from Tomatin. First XPL then PPL. Relict high-pressure eclogitic garnet breaking down to plagioclase and amphibole as it moved towards the surface.

“Interesting, but maybe it’s actually….”

The discussion (by Daniel Viete, whose research I’ve written about before and others) argues against the original papers conclusions, using two lines of attack. Firstly they focus on how hard it would be to get rocks so hot, so early in the orogeny2. Other high pressure rocks in the Grampian Orogeny are much colder (e.g. blueschists in Clew Bay, Ireland). From dating, we know that the Scottish rocks were metamorphosed relatively quickly (18 million years or less). Indeed Viete has already written about the difficulty of getting rocks in this area hot enough, quick enough. This was for the well known temperatures. The problem is even greater for Aoki’s earlier deeper and hotter phase. Listing all the ways these rocks could have been heated up (mantle melts, radioactive heating, mechanical heating, already hot from rifting) they conclude that the early measured temperatures are not possible.

Secondly they describe the local geology in terms of networks of long-lived shear zones, that interleave Dalradian sediments with older basement rocks. They also provide a date of 1 billion years (much than the Ordovician age of Barrovian metamorphism) from the Cowhythe Gneiss at Portsoy, a nearby patch of high grade rocks. In conclusion, the early high-pressure metamorphism that Aoki and others describes is from an entirely different orogeny and found only in odd slices of older rock.

S94156APPL

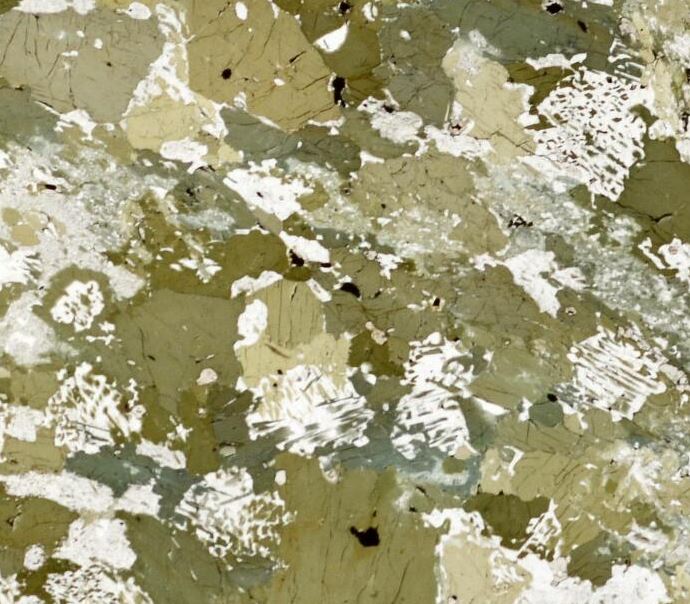
BGS sample S94156.  Garnet amphibolite from Tomatin. Intergrowths of plagioclase and amphibole – formed by decompression of an eclogite?

“With respect, no it’s not. Plus we’ve got a brand new paradigm!”

In their reply, Aoki and others defend their conclusions. Their rocks are not basement and are totally different from the Cowhythe Gneiss. Plus, old ages can often be ‘inherited’ – dated zircons may contain old ages since the crystal was a ‘detrital’ grain within the sediment that was later metamorphosed. They then turn to their explanation for their results. Acknowledging that “a reply to a comment is not the correct place to propose an entirely new paradigm for such a classic orogen” they nevertheless provide a brief overview, promising to “present our model more fully in a future publication“.

They start with the well-known enigma of how to provide the heat for Barrovian metamorphism. Modelling suggests that stacking rocks and waiting for them to heat up (the classic England & Houseman model) actually takes 50 million years. Viete has previously proposed the heat came in via advection via hot fluids. Aoki’s model proposes “the extrusion of a major wedge of hot deep eclogite which was exhumed up a subduction channel several tens of kilometres thick“.

Wow.

What they are proposing is that hot rocks within  the subduction zone, perhaps 40 km below the slowly heating orogenic wedge, broke free and was squeezed up into it, heating the wedge and causing rapid Barrovian metamorphism. This would be an extremely dramatic thing and is a radical departure from existing models for this orogeny, which is itself the ‘type locality’ for all instances of Barrovian metamorphism. Aoki refer to one earlier paper by a group from Cambridge that propose a similar mechanism for the Alps. The Alpine eclogite wedge is still clearly eclogite forming a discrete unit within other nappes. It’s not (yet) clear how Aoki’s traces of earlier high pressure minerals in an relatively homogenous Dalradian correspond to this.

What does it all mean?

For what it’s worth, I’m a little sceptical – my headline follows Betteridge’s Law – but we’ll have to wait for the paper that properly presents the new model before we can judge.

One thing that strikes me is how much Wheeler’s paper on the importance of stress throws doubt on this work. Tales of packages of rock squeezing 10s of kilometres up into an orogeny puts a lot of weight on the traces of high pressure metamorphism that are the main evidence. Explaining high pressures in terms of localised stress starts to seem like a much simpler explanation.

This is a fascinating series of papers3. It highlights how vital metamorphic petrology is to understanding mountain building processes. George Barrow first identified his zones over a hundred years ago and the Scottish Highlands have been intensely studied ever since, yet we still don’t fully understand how they formed.

The fact these papers are hidden behind a paywall is in stark contrast to the pictures I’ve used. All come from the British Geological Survey who have made them free to all. The depth of coverage is fabulous – I’ve been able to find images from the key localities mentioned in the papers within minutes. This illustrates the power of open data rather nicely – if only we could all find scientific papers as easily.

References

The original paper.
AOKI K., S. MARUYAMA & S. OMORI (2013). Metamorphic P–T conditions and retrograde path of high-pressure Barrovian metamorphic zones near Cairn Leuchan, Caledonian orogen, Scotland, Geological Magazine, 151 (03) 559-571. DOI: http://dx.doi.org/10.1017/s0016756813000514

The discussion and reply.
Viete D.R. & S. A. Wilde (2014). Discussion of ‘Metamorphic P–T and retrograde path of high-pressure Barrovian metamorphic zones near Cairn Leuchan, Caledonian orogen, Scotland’, Geological Magazine, 151 (04) 755-758. DOI: http://dx.doi.org/10.1017/s001675681300099x

The Alpine paper
Smye A.J., Tim J.B. Holland, Randall R. Parrish & Dan J. Condon (2011). Rapid formation and exhumation of the youngest Alpine eclogites: A thermal conundrum to Barrovian metamorphism, Earth and Planetary Science Letters, 306 (3-4) 193-204. DOI: http://dx.doi.org/10.1016/j.epsl.2011.03.037

An old paper on the Tomatin ‘eclogites’