The deceptive simplicity of a metamorphic rock

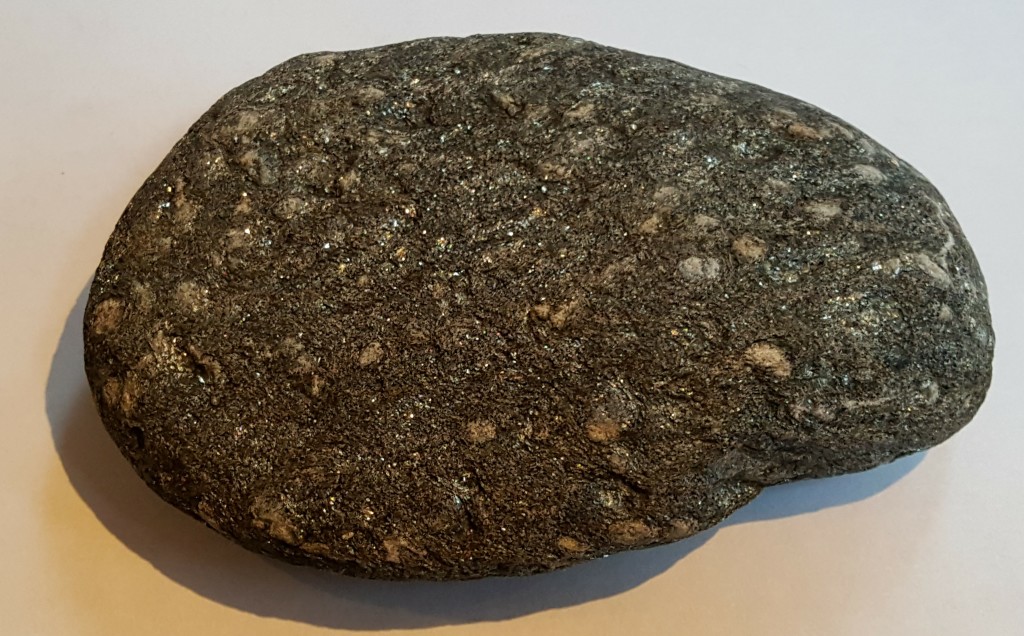
I’d like to introduce you to a rock.

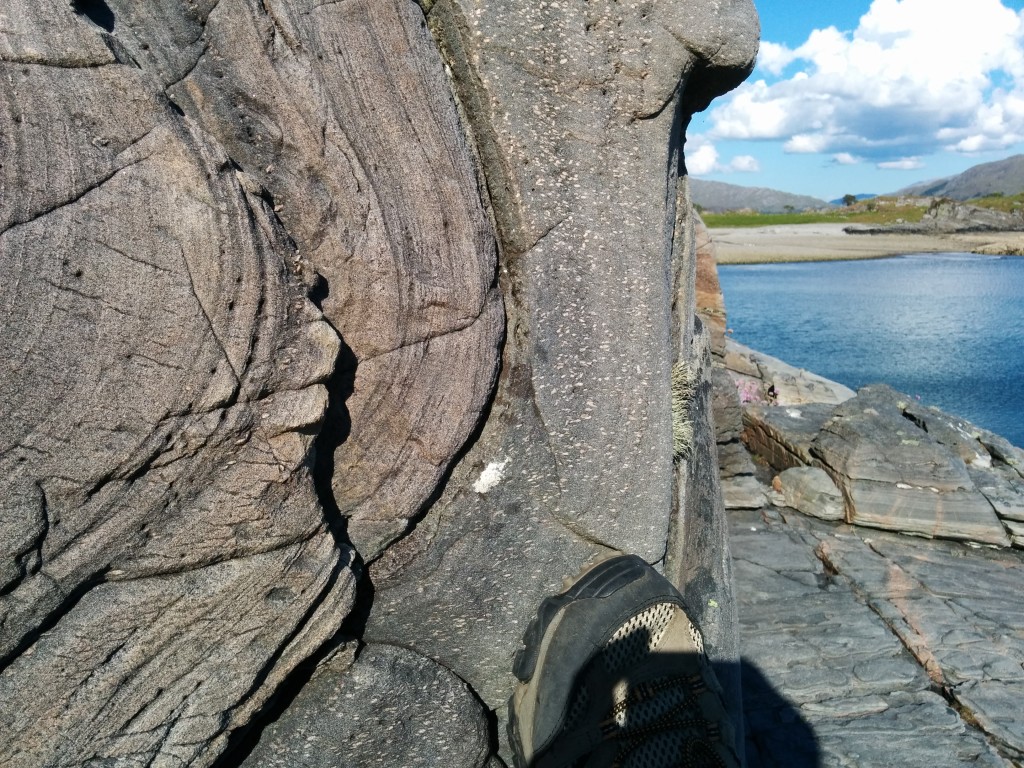
20161218_122601_007

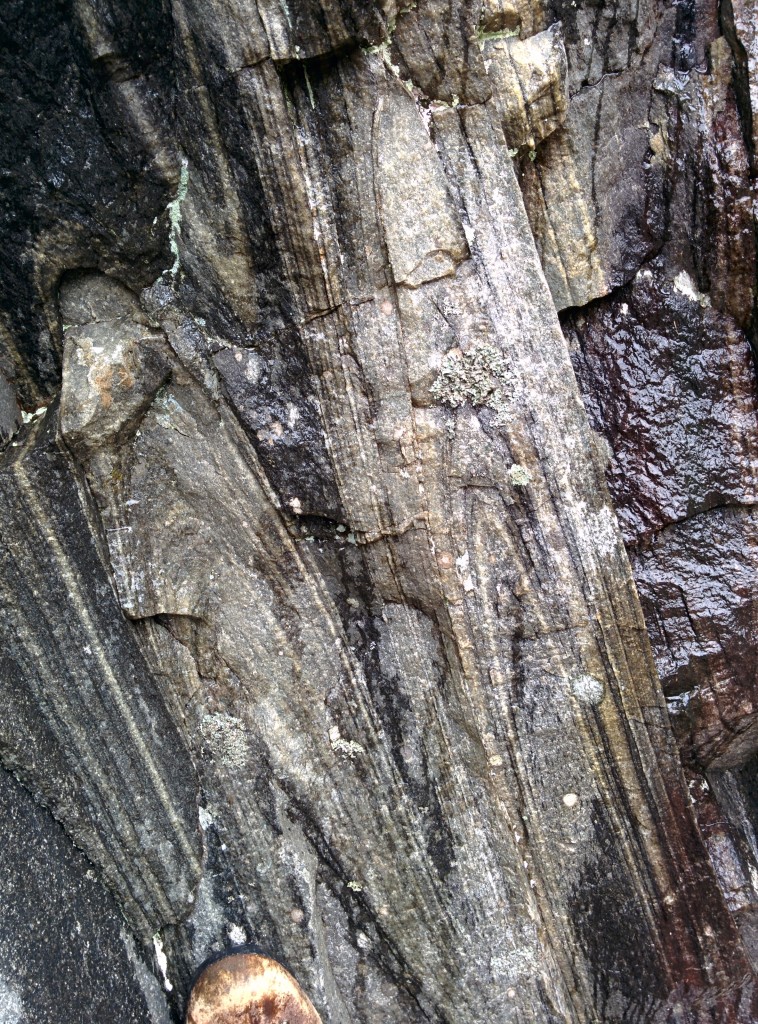
Pretty isn’t it? The white crystals caught my eye, as they did that of three different geologists of the British Geological Survey, who between them collected 5 different samples from the same small area of Scotland.

When did these crystals grow? How old are they? These rocks here are part of the Moine supergroup which started as a pile of sediments a billion years ago and the last geological event in this part of Scotland was a mere 60 million years ago, so there’s a wide possible range.

The first and easiest tool available to a geologist is to establish the age of something relative to other events. The white spots are potassium feldspar that grew when the rock was metamorphosed – changed from a muddy sand into something (even) more interesting. Metamorphosis is most often associated with geological structures. Minerals most often form because rocks are buried deep and heated and this squashes them,  flattening or folding the sedimentary layers and metamorphic minerals alike.

img_20160530_180945-1

Yes the sea is azure blue and the beach empty. It was a fabulous week’s holiday.

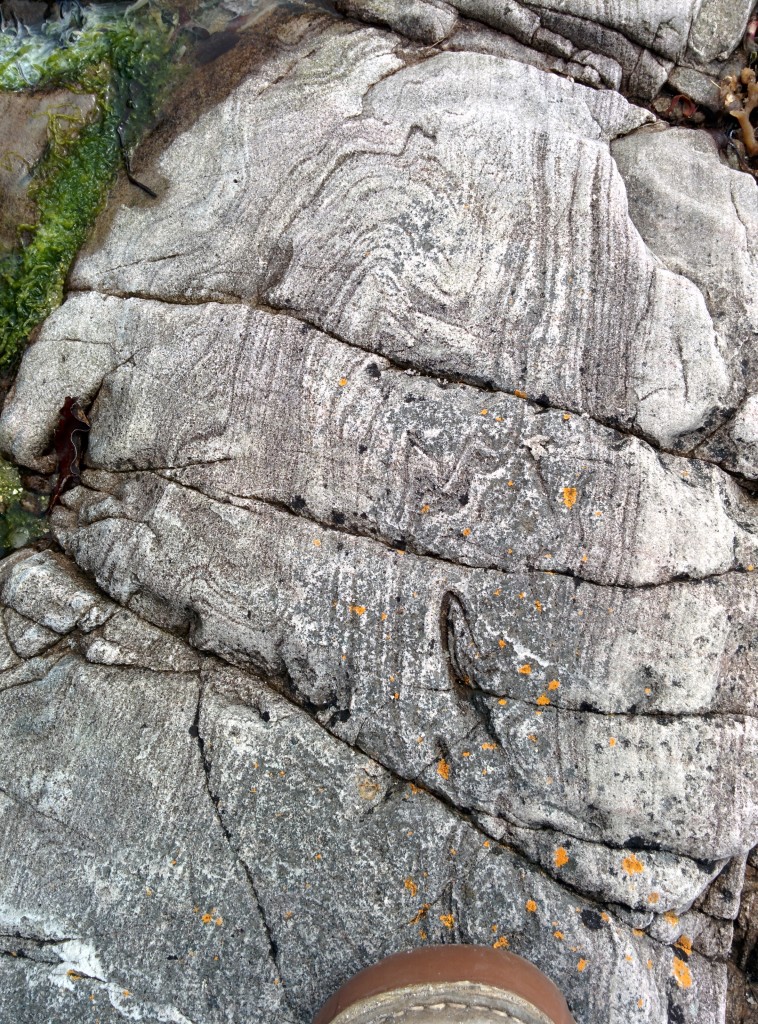
In this picture we see a set of lines folded round which are original sedimentary layers. Our rock comes from the darker layer to the right. The white spots within it are roughly flattened along a plane that passes through the middle of the fold. This suggests they formed at the same time as the rocks were folded.

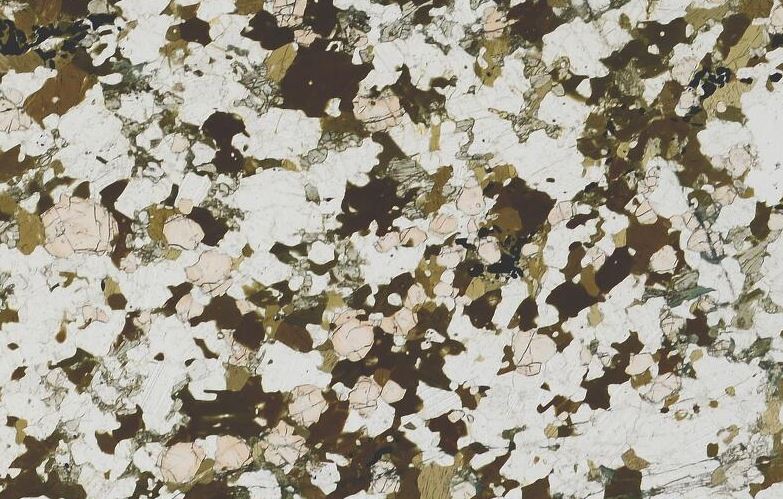
There is a little more detail to be seen in thin sections made by the state-funded geologists who have passed here before me1.

http://www.bgs.ac.uk/data/britrocks/britrocks.cfc?method=viewSamples&sampleId=351198

Image taken from BGS thin section image archive

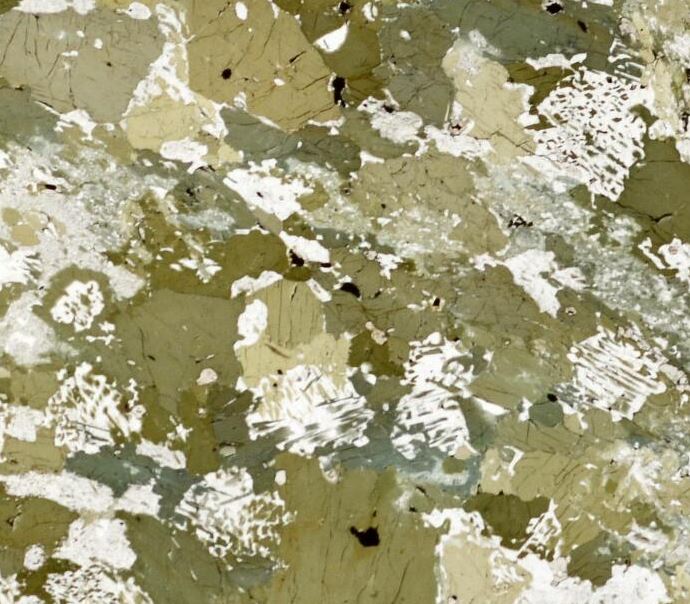
Here we are looking down a microscope at the light that has passed through a thin slice of the rock – we are peering into its soul. The plain white areas are the feldspar crystals which we can call porphyroblasts if we are feeling fancy (meaning they grew as big crystals during metamorphism). Notice also the patterns made by the long and thin red-brown and grey mica crystals. There are little folds.

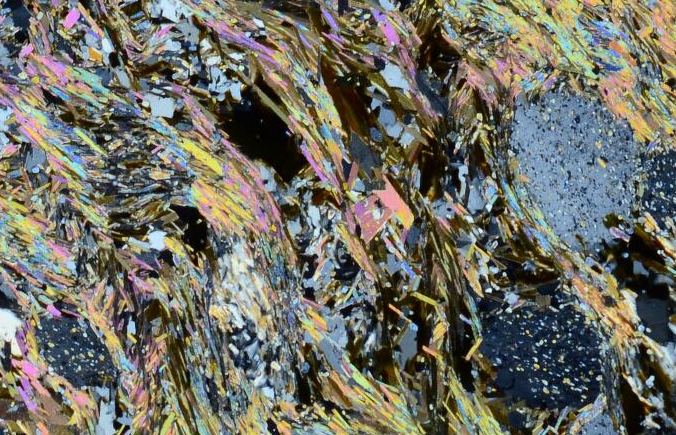
xpl-detail

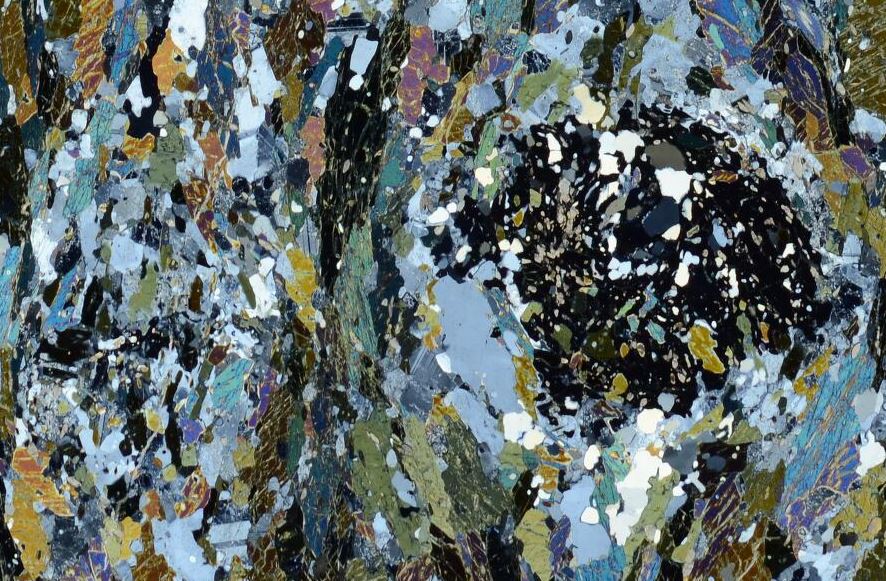
With more magnification (and in cross polarised light, so the minerals look different) you can see that the feldspars contain grains of other minerals that a strung out in lines. These are minerals that were swallowed by the growing feldspar and give a glimpse of earlier structures.

Here’s one interpretation of what is going on. An early alignment of the minerals was parallel to the sedimentary bedding. This was horizontal in our field of view. The feldspar grains grew over this fabric. Later the rock was squashed in a different direction, causing the folding we see in the outcrop and in the thin section. The mica grains are now mostly vertical with only a few areas staying flat. Some feldspar grains stayed put, but most have been rotated so that their long axes are vertical.

I’ve deliberately gone for the most simple explanation, but it’s a plausible one based on what we see in the outcrop. Two sets of squashing and one phase of mineral growth. Nevertheless its likely that we are not seeing the full picture here. The same package of rocks looks very different depending on where you are. About five kilometres west of where my rock came from, similar Moine sediments have vertical layers, but so little deformed that sedimentary cross bedding is visible.

Cross bedding in vertical Moine sediments

Cross bedding in vertical Moine sediments

Nearby there are folds, but these were formed when it was still sediment, the layers folding due to slipping of sand. You can tell this because the layers either side of the folds are flat.

Soft sediment deformation in vertically bedded Moine sediments

Soft sediment deformation in vertically bedded Moine sediments

Go ten kilometres east and the you are still in Moine sediments, but they are rather more intensely deformed and metamorphosed. Here the original sedimentary layers are stretched out into layers as thin as centimetre.

Intense folding in Moine sediments, near the Sgurr Beag thrust.

Intense folding in Moine sediments, near the Sgurr Beag thrust.

Clearly, it’s important not just to look at a single outcrop – which is where geological mapping comes in. This shows that these metamorphic rocks are part of a wide area over northern Scotland. This is unconformably overlain by undeformed sediments of Devonian age. So sometime between 1000 and 416 million years ago these sediments were heated and folded – that’s when the white crystals grew.

These are old techniques and technology marches on. Modern earth scientists, armed with sophisticated machines, scary acid and an understanding of radioactive decay are able to date the age of metamorphic events and even directly date the age of individual metamorphic minerals.

The Moine rocks of Scotland are well studied. Bring together hundreds of radiometric dates, highly detailed mapping and the study of thousands of outcrops and thin sections and you get a picture of almost terrifying complexity.

It turns out that the white grains in my rock sample with its apparently simple history could have formed in any one of at least five different occasions when metamorphic minerals formed in the area.  Each one of these represents a significant event – an ocean closing, an arc smashing itself into oblivion against an unyielding continent – yet somehow a single rock shows only a single part of this saga.

I’ll tell this complicated geological history, and why it’s not visible in a single outcrop in another post.

A new paradigm for Barrovian metamorphism?

George Barrow

George Barrow (image via BGS)

The phrase ‘new paradigm’ is a little shop-worn but it still catches the eye. To see it used in a “discussion and reply” on a dry-looking metamorphic petrology paper is really something unusual. Tracing through these articles really shows how metamorphic petrology can get to the heart of understanding what happens in the core of mountain belts.

The example of “discussion and reply”1 I’m discussing here is truly remarkable. Everyone is terribly polite and there is lots of new data and ideas contained that shed light on a classic area for the understanding of metamorphism. It also illustrates the perils and challenges of interpreting complex rocks that formed in the heart of an ancient mountain.

A paper worth discussing

The original paper, entitled ‘Metamorphic P–T and retrograde path of high-pressure Barrovian metamorphic zones near Cairn Leuchan, Caledonian orogen, Scotland’ is by Kasumaza Aoki of Tokyo, Brian Windley of Leicester and others. It studies metamorphic rocks from the Scottish Highlands. You’ve heard of Barrovian metamorphism, (if not, get thee hence), this is the type locality, where George Barrow first identified zones of rock defined by particular ‘index’ minerals.

Sample of Cairn Leuchan Gneiss, collect by George Barrow himself. Garnet, plagioclase, Hornblende (brown), pyroxene (green).

Sample of Cairn Leuchan Gneiss, collected by George Barrow himself! Garnet, plagioclase, hornblende (brown), pyroxene (green). From BGS, sample S8146

Barrovian metamorphism is typical of mountain belts. It’s thought to be caused  by thrusting and stacking of rock slices within a growing mountain belt, that buries and heats up the rocks within it – causing metamorphism. This model is simple, classic and perhaps wrong. Our original paper looks at a slice of high grade rocks from the hottest, sillimanite zone. Detailed metamorphic petrology shows that “the rocks underwent high-pressure granulite facies metamorphism at P = c. 1.2–1.4 GPa and T = c. 770–800 °C followed by amphibolite facies metamorphism at P = c. 0.5–0.8 GPa and T = c. 580–700 °C”.

The later metamorphism is pretty standard for the area, but the earlier high pressure phase is unusual, suggesting these rocks were buried much deeper than previously thought. Our authors conclude that high-grade Barrovian metamorphism is retrograde, the metamorphic minerals formed as the rocks moved back towards the surface, masking an earlier deeper phase. They also suggest that the measured high-pressure metamorphism was also formed *on the way up* and that these rocks (perhaps all rocks in the area, there’s evidence nearby at Tomatin) had previously been down to eclogite or blue-schist depths.

If this paper were science journalism (or course it isn’t) you could accuse it of ‘burying the lede’ – the abstract focuses purely on what they proved. The major implications of their results are made much more explicit in the Discussion by Daniel Viete and others. S98121XPL

dd

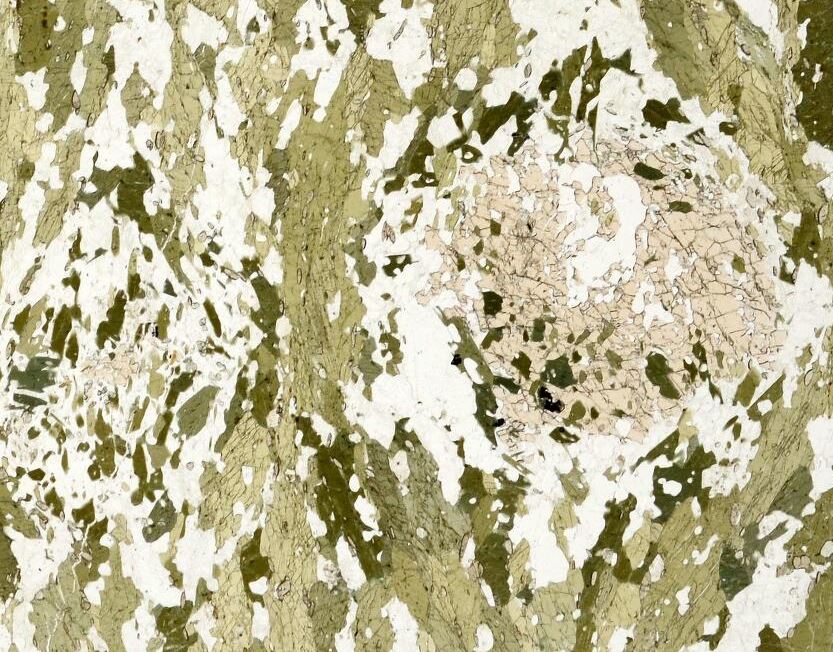
BGS sample S98121. Garnet amphibolite from Tomatin. First XPL then PPL. Relict high-pressure eclogitic garnet breaking down to plagioclase and amphibole as it moved towards the surface.

“Interesting, but maybe it’s actually….”

The discussion (by Daniel Viete, whose research I’ve written about before and others) argues against the original papers conclusions, using two lines of attack. Firstly they focus on how hard it would be to get rocks so hot, so early in the orogeny2. Other high pressure rocks in the Grampian Orogeny are much colder (e.g. blueschists in Clew Bay, Ireland). From dating, we know that the Scottish rocks were metamorphosed relatively quickly (18 million years or less). Indeed Viete has already written about the difficulty of getting rocks in this area hot enough, quick enough. This was for the well known temperatures. The problem is even greater for Aoki’s earlier deeper and hotter phase. Listing all the ways these rocks could have been heated up (mantle melts, radioactive heating, mechanical heating, already hot from rifting) they conclude that the early measured temperatures are not possible.

Secondly they describe the local geology in terms of networks of long-lived shear zones, that interleave Dalradian sediments with older basement rocks. They also provide a date of 1 billion years (much than the Ordovician age of Barrovian metamorphism) from the Cowhythe Gneiss at Portsoy, a nearby patch of high grade rocks. In conclusion, the early high-pressure metamorphism that Aoki and others describes is from an entirely different orogeny and found only in odd slices of older rock.

S94156APPL

BGS sample S94156.  Garnet amphibolite from Tomatin. Intergrowths of plagioclase and amphibole – formed by decompression of an eclogite?

“With respect, no it’s not. Plus we’ve got a brand new paradigm!”

In their reply, Aoki and others defend their conclusions. Their rocks are not basement and are totally different from the Cowhythe Gneiss. Plus, old ages can often be ‘inherited’ – dated zircons may contain old ages since the crystal was a ‘detrital’ grain within the sediment that was later metamorphosed. They then turn to their explanation for their results. Acknowledging that “a reply to a comment is not the correct place to propose an entirely new paradigm for such a classic orogen” they nevertheless provide a brief overview, promising to “present our model more fully in a future publication“.

They start with the well-known enigma of how to provide the heat for Barrovian metamorphism. Modelling suggests that stacking rocks and waiting for them to heat up (the classic England & Houseman model) actually takes 50 million years. Viete has previously proposed the heat came in via advection via hot fluids. Aoki’s model proposes “the extrusion of a major wedge of hot deep eclogite which was exhumed up a subduction channel several tens of kilometres thick“.

Wow.

What they are proposing is that hot rocks within  the subduction zone, perhaps 40 km below the slowly heating orogenic wedge, broke free and was squeezed up into it, heating the wedge and causing rapid Barrovian metamorphism. This would be an extremely dramatic thing and is a radical departure from existing models for this orogeny, which is itself the ‘type locality’ for all instances of Barrovian metamorphism. Aoki refer to one earlier paper by a group from Cambridge that propose a similar mechanism for the Alps. The Alpine eclogite wedge is still clearly eclogite forming a discrete unit within other nappes. It’s not (yet) clear how Aoki’s traces of earlier high pressure minerals in an relatively homogenous Dalradian correspond to this.

What does it all mean?

For what it’s worth, I’m a little sceptical – my headline follows Betteridge’s Law – but we’ll have to wait for the paper that properly presents the new model before we can judge.

One thing that strikes me is how much Wheeler’s paper on the importance of stress throws doubt on this work. Tales of packages of rock squeezing 10s of kilometres up into an orogeny puts a lot of weight on the traces of high pressure metamorphism that are the main evidence. Explaining high pressures in terms of localised stress starts to seem like a much simpler explanation.

This is a fascinating series of papers3. It highlights how vital metamorphic petrology is to understanding mountain building processes. George Barrow first identified his zones over a hundred years ago and the Scottish Highlands have been intensely studied ever since, yet we still don’t fully understand how they formed.

The fact these papers are hidden behind a paywall is in stark contrast to the pictures I’ve used. All come from the British Geological Survey who have made them free to all. The depth of coverage is fabulous – I’ve been able to find images from the key localities mentioned in the papers within minutes. This illustrates the power of open data rather nicely – if only we could all find scientific papers as easily.

References

The original paper.
AOKI K., S. MARUYAMA & S. OMORI (2013). Metamorphic P–T conditions and retrograde path of high-pressure Barrovian metamorphic zones near Cairn Leuchan, Caledonian orogen, Scotland, Geological Magazine, 151 (03) 559-571. DOI: http://dx.doi.org/10.1017/s0016756813000514

The discussion and reply.
Viete D.R. & S. A. Wilde (2014). Discussion of ‘Metamorphic P–T and retrograde path of high-pressure Barrovian metamorphic zones near Cairn Leuchan, Caledonian orogen, Scotland’, Geological Magazine, 151 (04) 755-758. DOI: http://dx.doi.org/10.1017/s001675681300099x

The Alpine paper
Smye A.J., Tim J.B. Holland, Randall R. Parrish & Dan J. Condon (2011). Rapid formation and exhumation of the youngest Alpine eclogites: A thermal conundrum to Barrovian metamorphism, Earth and Planetary Science Letters, 306 (3-4) 193-204. DOI: http://dx.doi.org/10.1016/j.epsl.2011.03.037

An old paper on the Tomatin ‘eclogites’  

BRITICE-CHRONO: death of an ice sheet

Using many different techniques, dozens of scientists are studying the death of an ice sheet that once covered Britain and Ireland. They want to understand the future fate of modern-day ice.

The phrase “ice sheet” doesn’t do justice to our subject: this is not something you shatter when stepping on a frozen puddle. Covering over a million square kilometres, this sheet is also kilometres thick. As it grew it pulled enough water out of the world’s oceans to lower them by metres, affecting tropical coastlines as well as the land entombed beneath the ice. The vast bulk even pushed down the crust beneath, slowly moving the underlying mantle aside.

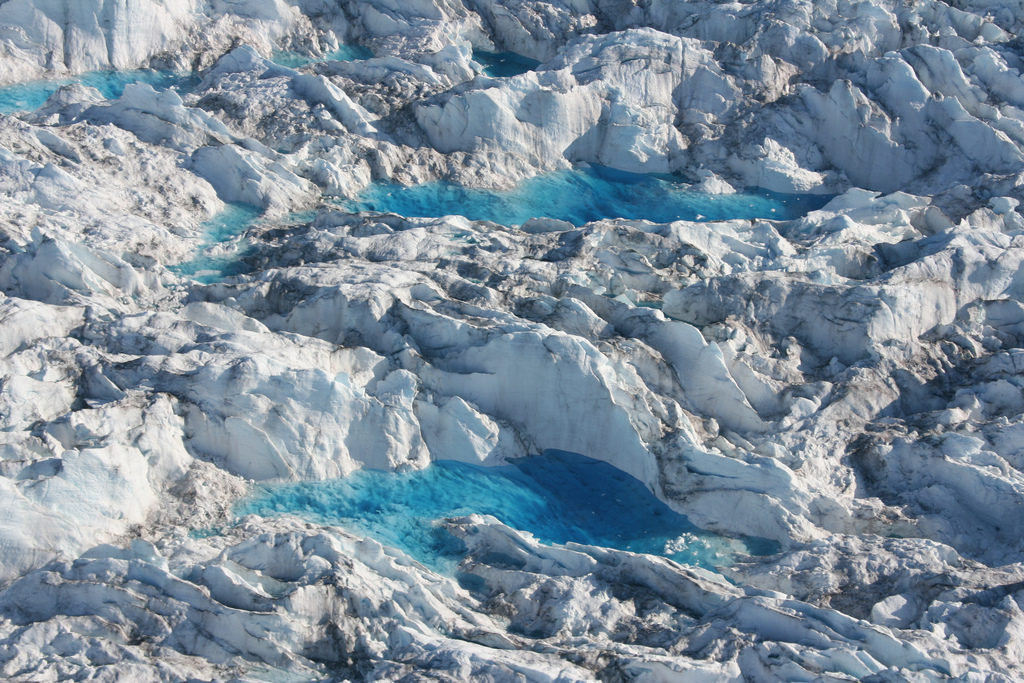
Melt pond on icesheet. Photo by Leif Taurer used under Creative Commons.

Melt pond on ice sheet. Photo by Leif Taurer used under Creative Commons.

The ice is constantly in motion. Snow falling on the ice sheet will eventually make its way to the sea, slowly flowing down and along.  Most is channelled into fast moving ice-streams.  This ice sheet is ‘marine-influenced‘, it sits partly on land, partly on the sea – most of its ice will end its days as an iceberg. The edges of the sheet can become undercut by the oceans, turning the edge into delicate ice shelves.

In the way it grows and flows, this ice sheet can seem almost alive. It will surely die, one day. Changing climate tips the balance between snow build-up and melting, the unstable ice shelves collapse and the ice-streams send ice to melt in the sea. In time the sheet thins to nothing and the world is transformed again.

BRITICE-CHRONO

My description of an ice sheet applies to the modern West Antarctic sheet. Scientists who study it worry about how, in the face of a rapidly changing climate, it might collapse, flooding cities across the globe. The IPCC identified this risk and highlighted how little we know about it.

27,000yearsago (2)

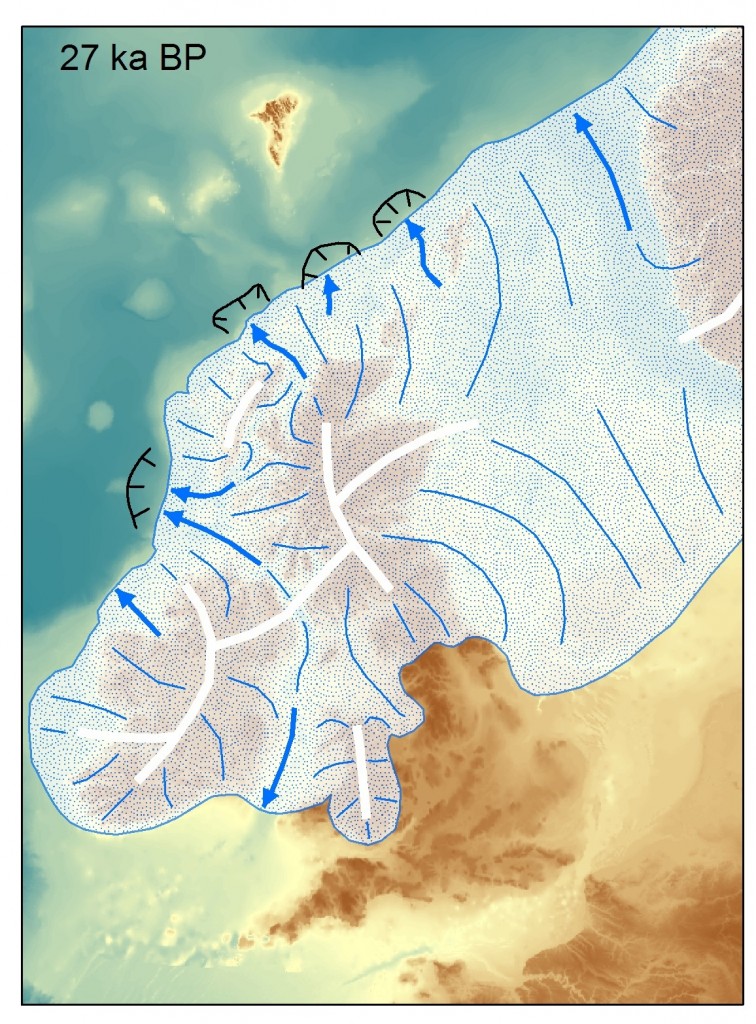
The British & Irish ice sheet, 27,000 years ago. Image courtesy of Chris Clarke.

My description also applies to the ice sheet that sat over Britain & Ireland 25,000 years ago.. A multi-disciplinary consortium, called BRITICE-CHRONO will greatly improve our understanding of the death of this ice sheet. This will be of great local interest, but will also help us predict the potentially troubled and troubling future of both the West Antarctic and Greenland ice sheets. The ancient climate change that killed the ice sheet was natural, but modern human-made warming melts ice just the same.

BRITICE

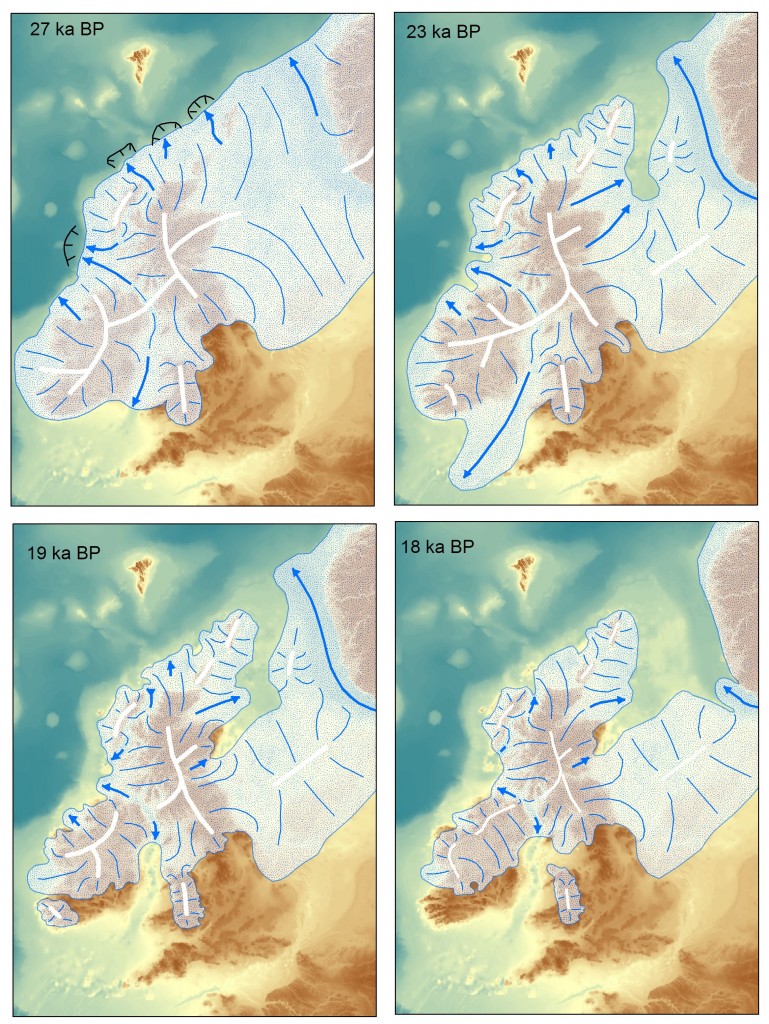
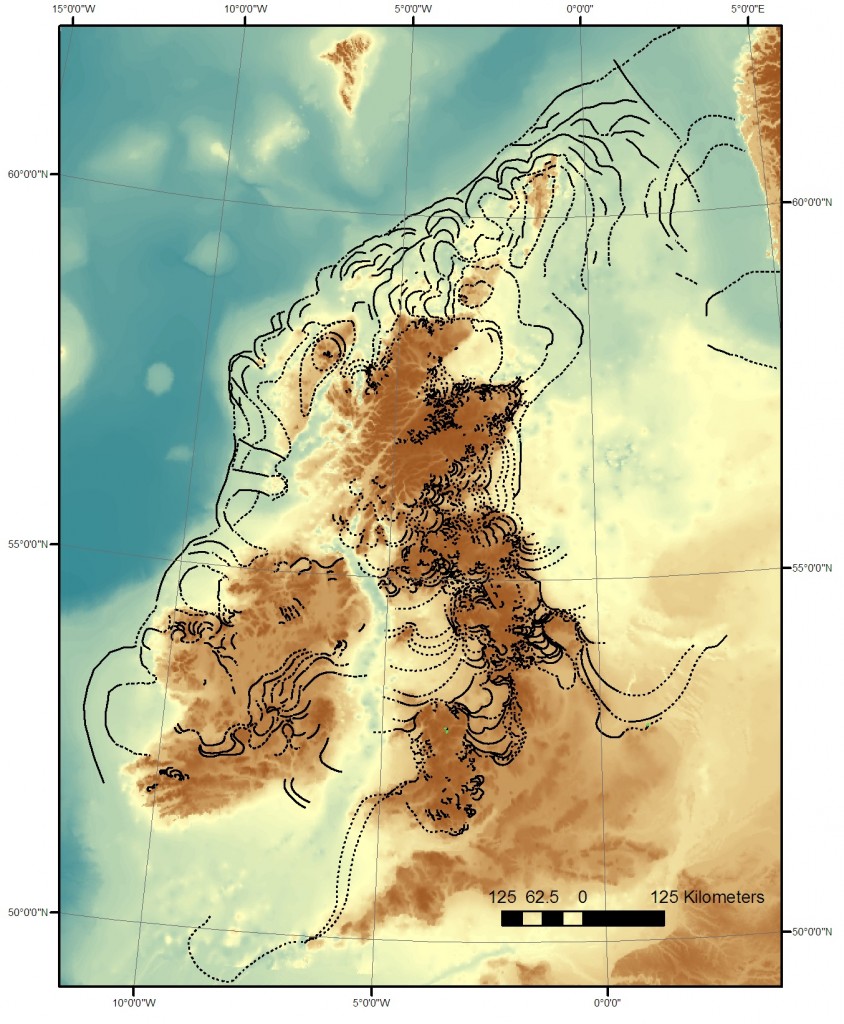
The physical traces of the death of the British ice sheet are easy to find: erratics, moraines and glacial lake deposits are just a few of the subtle but distinctive features to found over much of Britain. A now complete project called BRITICE, led by Professor Chris Clark of Sheffield University, mapped them all, focussing on traces of the final retreat of the ice sheet. Similar work in Ireland allows the pattern of retreat for the entire ice sheet to be inferred.

Maps showing the evolution of the British & Irish icesheet over time. Image from Chris Clark.

Maps showing the evolution of the British & Irish ice sheet over time. “19 ka BP” means 19,000 years before present. Image from Chris Clark.

CHRONO

BRITICE-CHRONO involves nearly 50 researchers from 8 universities plus the British Antarctic and Geological Surveys. A big part of the work of BRITICE-CHRONO is working out the age of various features. Familiar techniques such as radiocarbon dating are useful, but a new generation of dating techniques can do things that seem almost magical.

Optical stimulated luminescence (OSL) dates the last exposure of sunlight for individual quartz grains. Natural radioactivity traps electrons within defects in the crystal lattice of the quartz grains. If light comes through it frees them again and produces more light (the luminescence). Quartz exposed to sunlight at the surface does not show luminescence, but grains that have been buried in a sand bank for thousands of years do. Measuring luminescence in the lab allows an estimate how long they have been buried for and therefore when the sand was deposited.

Conversely, TCN (terrestrial cosmogenic nucleides) is a technique used for dating how long a surface has been exposed. Cosmic radiation is constantly streaming down on us and within minerals at the Earth’s surface it produces radioactive elements such as 10Be and 36Cl. The more of these we find, the longer the surface has been exposed to space. Apply this technique to a boulder dropped by a glacier and we can infer when the ice was last present.

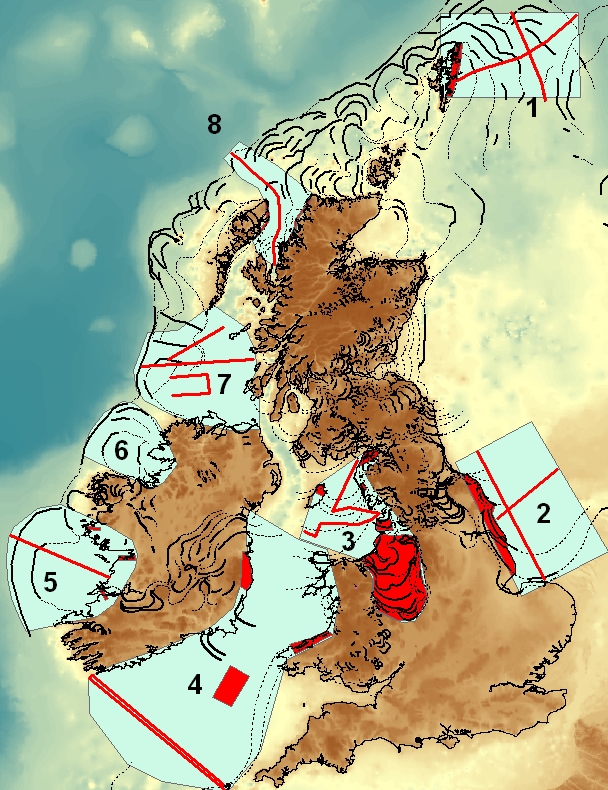
BRITICE-CHRONO's area of investigation. Image from Chris Clark

BRITICE-CHRONO’s  8 transects. Image from Chris Clark

As part of BRITICE-CHRONO people are collecting hundreds of samples from all over Britain and Ireland. Guided by the BRITICE work, they are sampling features tied into different stages of the death of the ice sheet. The goal is to build up a large and robust dataset to understand how quickly the ice sheet shrank.

To the sea

When the ice sheet was there, sea levels were much lower (because the water was in the ice) and the ice left many traces on what is now the seabed.  BRITICE-CHRONO is using geophysical techniques to understand the distribution of glacial sediment on the seabed (sometimes on land too). Collecting cores from the sediments on the seabed also provides samples for dating. Cores from far offshore contain large rock fragments. These show that floating icebergs melted overhead, dropping stones scraped from land that became entombed within the ice sheet. Marine fossils offer their own special insights.

Offshore features. Image from Chris Clark.

Ice retreat features, both offshore and on. Image from Chris Clark.

There is a lot of interest in understanding features on the sea-bed – construction of offshore wind-farms requires better knowledge of what is out there. Also we now understand the potential for archaeology under these shallow seas. The British-Irish ice sheet may be long dead, but that doesn’t mean people never saw it1.

Recreating the ice sheet ‘in silico’

We know a lot about the world in which the last British ice sheet died. Ice from this time still exists, buried deep in the central parts of the Antarctic and Greenland ice sheets. It contains bubbles of air that once blew over a colder world. From this and other evidence, we have a good record of the climate spanning the period in question.

Scientists have built up sophisticated computer models of how ice sheets grow and die, in part based on research in Antarctica. Take known parameters, such as climate and topography and its possible to recreate an ice sheet ‘in silico’, to build up layers of ice within a computer and watch them disappear as the climate warmed.

BRITICE-CHRONO will build up a robust 4-D dataset of how the ice sheet retreated over time. Combining this with computer modelling will create a positive feedback, increasing our knowledge of how ice sheets behave, both in the past and the future.

Scientific Aims

BRITICE-CHRONO will test three main hypotheses, all of which are relevant to the goal of predicting the fate of modern ice sheets:

  1. The portions on ice close to sea level  collapsed rapidly (in less than 1000 years) but the rate of decay was slower for ice on land. Just how catastrophic was the death of the British-Irish ice sheet?
  2. The main ice catchments draining the ice sheet retreated synchronously in response to climatic and sea-level change. Was the retreat of the ice controlled entirely by external factors, or did the response vary over the ice sheet? This helps us understand the significance of local rapid retreat of ice in Antarctica. Does seeing it in one place necessarily mean it is happening to the whole ice sheet?
  3. The volume of ice-rafted debris depends on changes in ice sheet mass balance. Finding large stones in layers of offshore sediment is a direct record of where melting icebergs were found in the past. How is this linked to changes in the ice sheet? Does the amount increase when ice sheets grow, or when they retreat?

BRITICE-CHRONO is less than half way through its 5 years so it is too early to draw any conclusions. The goal is to produce a robust set of data so individual dates will not be published until the full picture is know. Last year saw a massive sampling effort that will continue this year. Although the focus is dating, put experts in the field and they will find new features such as a whole new suite of moraines in Scotland.

The consortium has a blog and is active on Twitter so you can join me in following their progress as they bring an ice sheet back from the dead.

Traces of glacial ice and water

There’s an immediacy to the study of the Quaternary (the last few million years) that is rather seductive. Most geology is (after John McPhee) studying ‘the former world’ but the Quaternary is close enough in time that it is still this world, capped by ice and full of familiar animals and human beings. We can study this period of time in tremendous detail using things – piles of sand, the pattern of the landscape, peat bogs – that are unlikely to be preserved in the geological record.

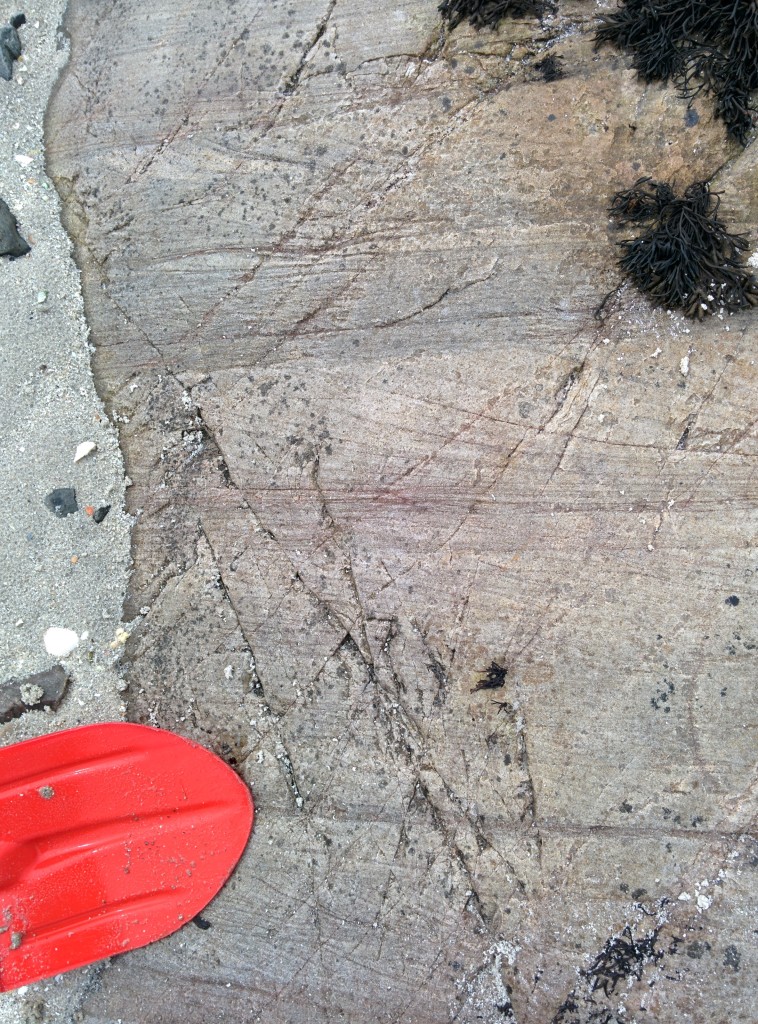
An outcrop of Irish gabbro tells us about conditions deep within the earth, but the mountain range, even the continent it formed in are all gone. The smooth shape of the outcrop and its covering of fine scratches were caused by the scraping of stones in ice, part of a massive icesheet that stretched across the British Isles. The ice is gone but it flowed over this hill, down that valley. On a chilly day it can feel like it only just left.

Stone moved by ice

One outcome of the great ferment of ideas in 19th Century Britain was the recognition that much of the northern British Isles were once covered by of thick sheet ice. One of the earliest recognised forms of evidence for these vanished ice sheets is found in the form of glacial erratics. These are pieces of rock, sometimes very large, dumped by the ice. The most useful sort come from a distinctive rock type, a granite intrusion perhaps, that allows you to know precisely where the erratic came from and so infer which way the ice was flowing. On the Yorkshire coast in England there are erratics from Norway1, showing that the ice flowed across what is now the North Sea.

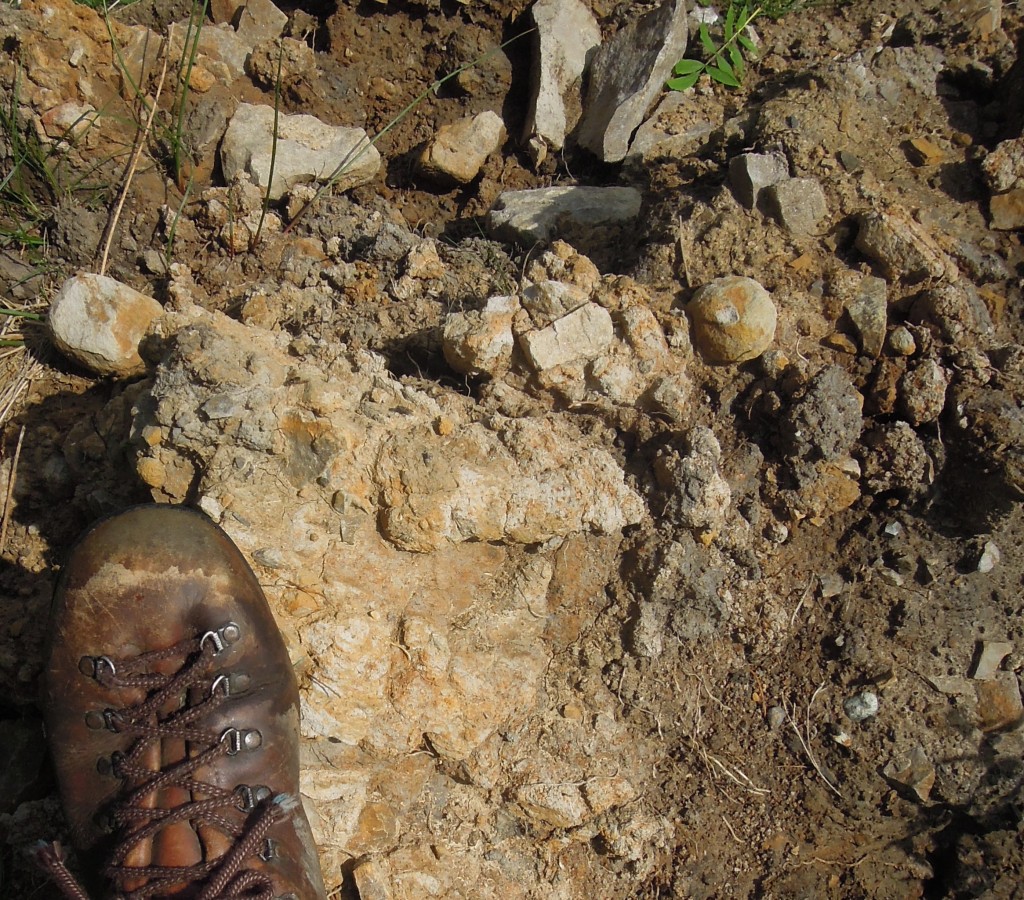
Freshly dug glacial drift from Cheshire.

Freshly dug glacial drift from Cheshire.

Volumetrically the biggest record of glaciation is glacial drift. This is sediment that was moved and ground-up by the ice. It is a very jumbled, poorly-sorted sediment, with big blocks mixed up with sand and silt. If you find a sediment like this, you know there has been glaciation. This applies to ancient sediments just as much as recent ones.

Studying drift, people realised that things were quite complicated. A single place might have multiple layers of glacial drift separated by more normal sediments. They realised that term ‘Ice Age’ is a simplification; this was phenomena that pulsed. Outside of the Polar regions, the ice caps came and went many times, dancing in time with the stately precession of the earth’s axis.

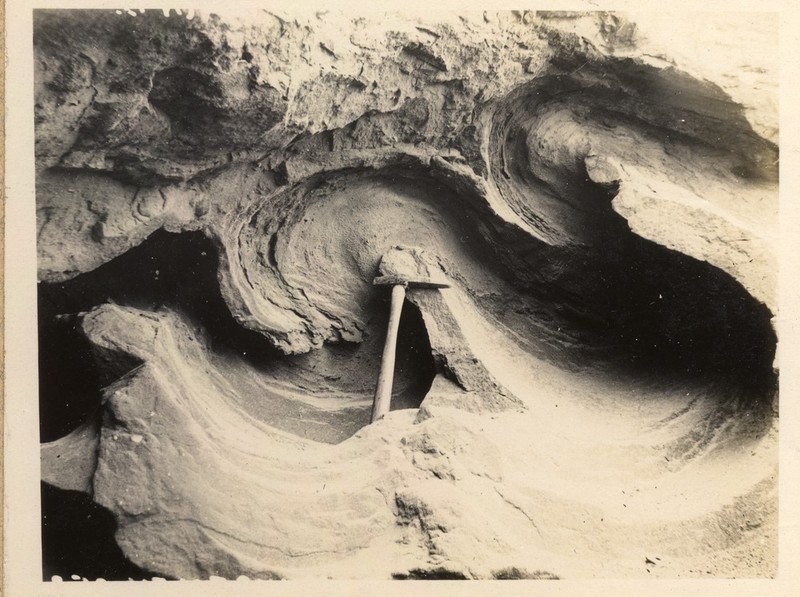
Isoclinal folding in glacial sand and clay. Photo from 1921 courtesy of British Geological Survey. P249721 http://geoscenic.bgs.ac.uk/asset-bank/action/viewAsset?id=78063&index=55&total=56&view=viewSearchItem

Isoclinal folding in glacial sand and clay. Photo from 1921 courtesy of British Geological Survey. P249721

Sometimes, soft drift gets pushed around by advancing ice. Sometimes this results in beautiful folds, other times it puts sediments containing marine shells deep inland. 2. For this reason, the presence of drift is fairly uninformative. To make firmer conclusions about the most recent advance of Ice, we must turn to more subtle features.

Fainter traces

Glacial sediments aren’t laid down in thin even layers, but in various ways, both elegant and ugly. Valley glaciers often have moraines: piles of sediment at the end or sides that fell out of the melting ice. The same principal applies to Ice Caps, such as covered most of Northern Europe and North America. Successive belts or ridges of moraines can record the retreat of an ice sheet.

Drumlins are piles of glacial sediment that have been moulded by ice flow. They are very beautiful features, with an aerodynamic shape. They can look like the back of a huge whale, somehow rising out of the ground. Often found grouped together, their shape indicates the direction in which the ice was moving when last it was flowing.

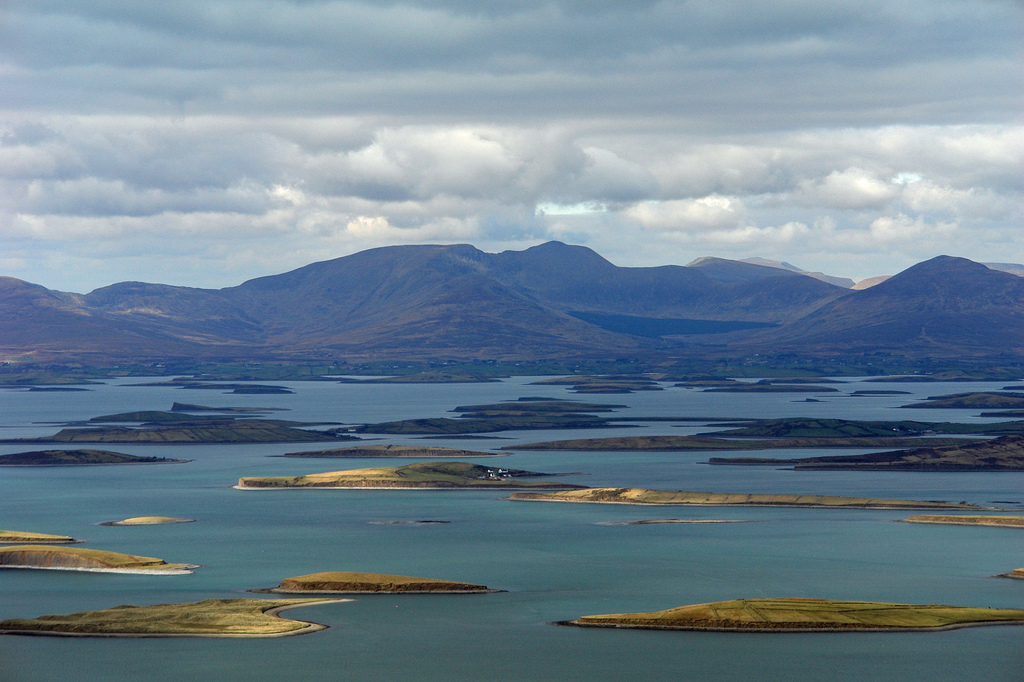
A pod of Drumlins swimming in Clew Bay, Ireland. Photo from chrispd1975 on Flickr under CC. http://www.flickr.com/photos/8289745@N03/2384936935/sizes/l/

A pod of Drumlins swimming in Clew Bay, Ireland. Photo from chrispd1975 on Flickr under CC.

Glacial striations and polishing are common features found on land that was once under the ice. Stones in the ice slowly scratched their way across bed-rock. Asymmetric features known as roche moutonnée tell us the direction of ice flow.

A flock of Scottish roche moutonee (ice flowing to the right). Image from British Geological SurveyP008317 http://geoscenic.bgs.ac.uk/asset-bank/action/viewAsset?id=7032&index=14&total=182&view=viewSearchItem&movedBr=null

A flock of Scottish roche moutonee (ice flowed to the right). Image from British Geological Survey P008317

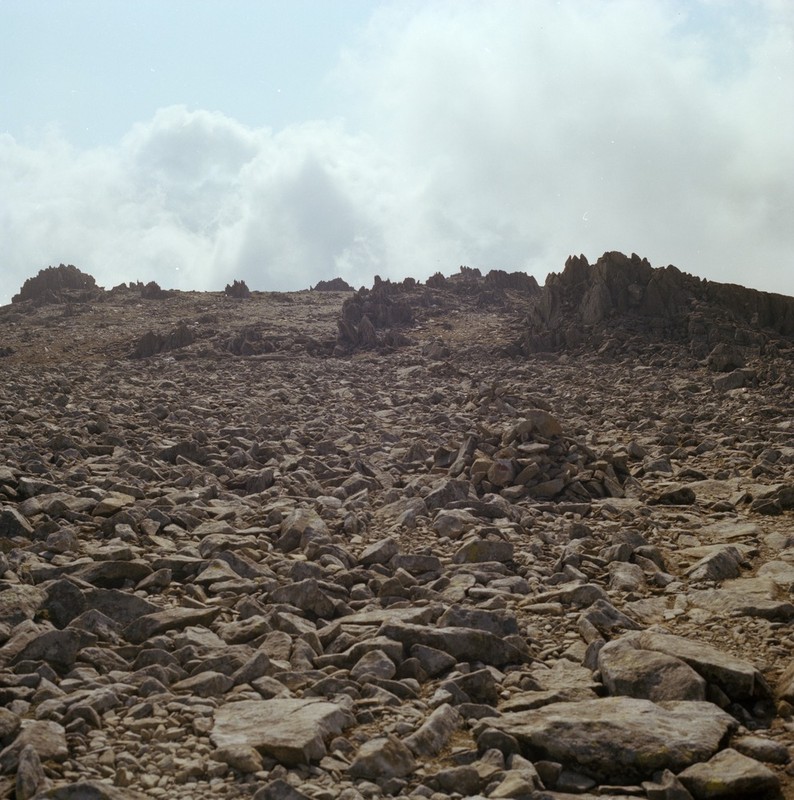
A common experience when walking one of the bigger mountains in Britain is to start in a valley filled with glacial till, perhaps with some moraine visible. Next a climb up a ridge shows lots of polished rock. Finally, the summit pyramid is covered in a great thickness of loose stone3. Between this summit block field and the scraped stone below is the trim line that captures the top of glacial erosion. Map out trim lines on multiple mountains and it tells you something about the vertical extent of the ice4.

Summit block field of Glyder Fawr in Wales. Image courtesy of British Geological Survey. P222636 http://geoscenic.bgs.ac.uk/asset-bank/action/viewAsset?id=29270&index=23&total=38&view=viewSearchItem

Summit block field of Glyder Fawr in Wales. Image courtesy of British Geological Survey. P222636

When ice melts, it turns into water. In my gin and tonic this is fine, but when the melting ice is 100s of metres thick, it will have a big impact. Around my home town of Macclesfield in England there are glacial lake deposits. They are sitting above the edge of the Cheshire Plain – there’s no way you could have a lake there today. The only way to explain this vanished body of still water is: it was dammed by the ice.

Other evidence of water flowing in odd ways if found in glacial meltwater channels. These look like small stream beds, but they have no stream today. Sometimes they flow along slopes or uphill for a time -evidence that when the water was flowing, the ice was still around.

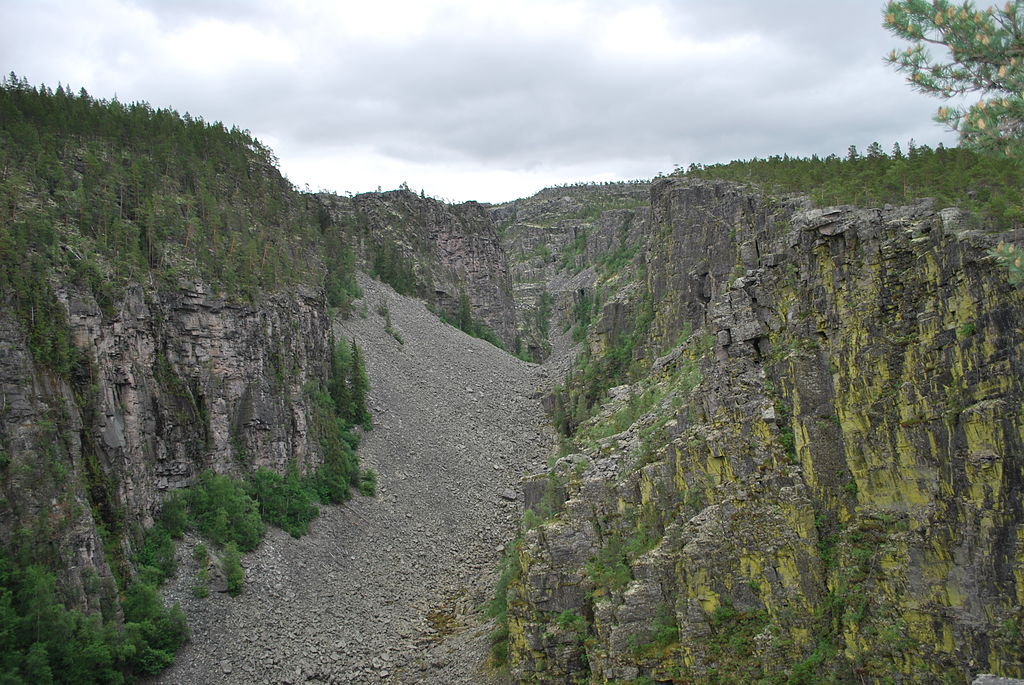
If you were building a dam to make a huge lake and you proposed making it out of ice, you wouldn’t get far as an engineer, because at some point the dam will fail and all the water will come flooding out. This happened with melting ice in several places. The huge scoured landscape of the channeled scablands in Washington State, USA, are the biggest example, but my favourite is the Jutulhogget or ‘Giant’s Cut’ in Norway.

Jutulhogget http://commons.wikimedia.org/wiki/File:Jutulhogget_01.jpg

Jutulhogget  Image from Wikimedia Commons.

Of limited scientific use, but rather beautiful, iceberg keel marks are more evidence for glacial lakes.

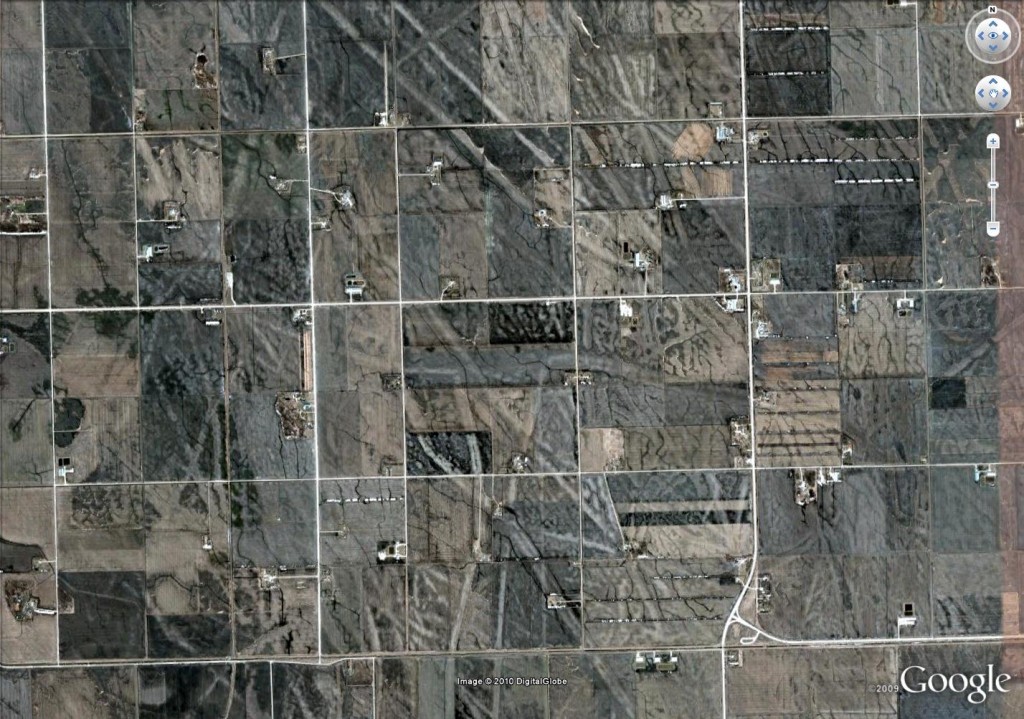
Glacial keel-marks from Canada. Google Earth image.

Aerial view of glacial keel-marks from near Manitoba, Canada. Square lines are roads: see here for more details

 To the science

Knowing about these features really enhances your view of the world – it gives you a way to read landscapes and discover a world of ice so close in time we can almost touch it.  But the best thing about these features is that they tell us about the now-vanished ice. Modern researchers have mapped them to track the ice’s ebb and flow. They combine these maps with computer modelling, insights from active ice sheets and techniques for dating so advanced that they seem almost magical. Their goal is to predict the future. In the face of a changing climate, an ice-cap died in Britain 15,000 years ago. Understanding this process better may help us predict that fate of earth’s remaining ice caps. I’ll write more about this next….