Wooden layers through time

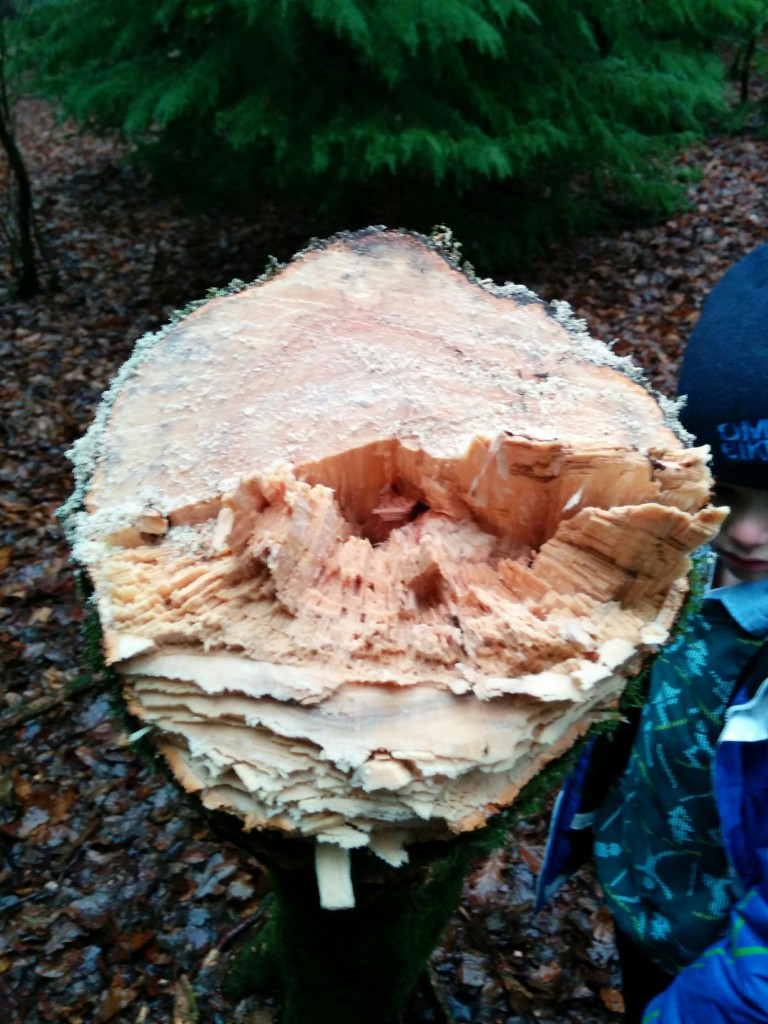
As I chopped my first tree down it was wonderful to realise that – of course – counting the rings would tell me how old it was. Traversing through the layers of wood and so through time is one of the ways in which trees stimulate the imagination. As with wood, so with woodland.

IMG_20150718_165328

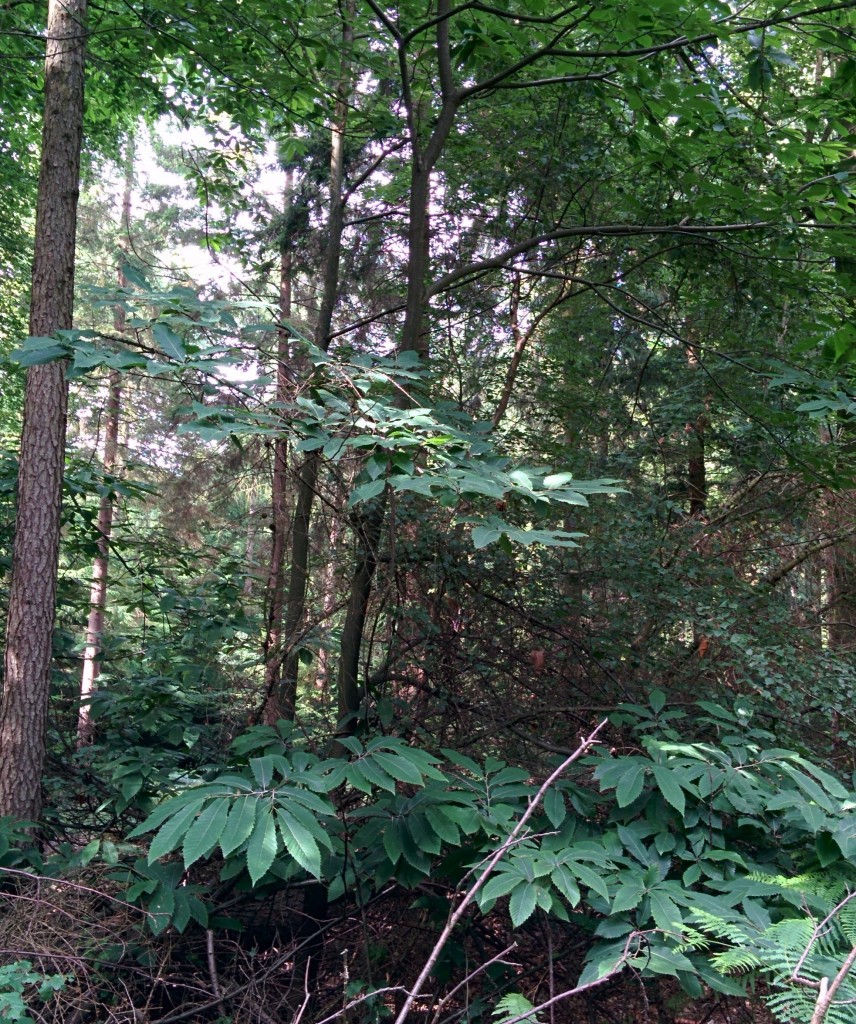
Woodland in the Summer

Layers of life

The leaves lying on the ground fell only a few days ago, transforming the appearance of the woodland. The tops of the high beech trees are no longer shrouded in deep green mystery, their bare crowns are suddenly visible. By contrast the evergreen conifers seem almost luminous, dangerously catching the eye of a new woodland owner keen to make his axe a bit less shiny.

You always know what time of year it is in an English wood. The annual cycle of deciduous trees – winter starkness alternating with the lush privacy of summer – is matched on the woodland floor. Beech woodlands in the Chiltern hills of southern England are renowned for the spring flush of bluebells, as these and other spring-flowering plants make the most of the returning warmth in the brief window before the trees come into leaf and plunge the ground below into a dappled gloom.

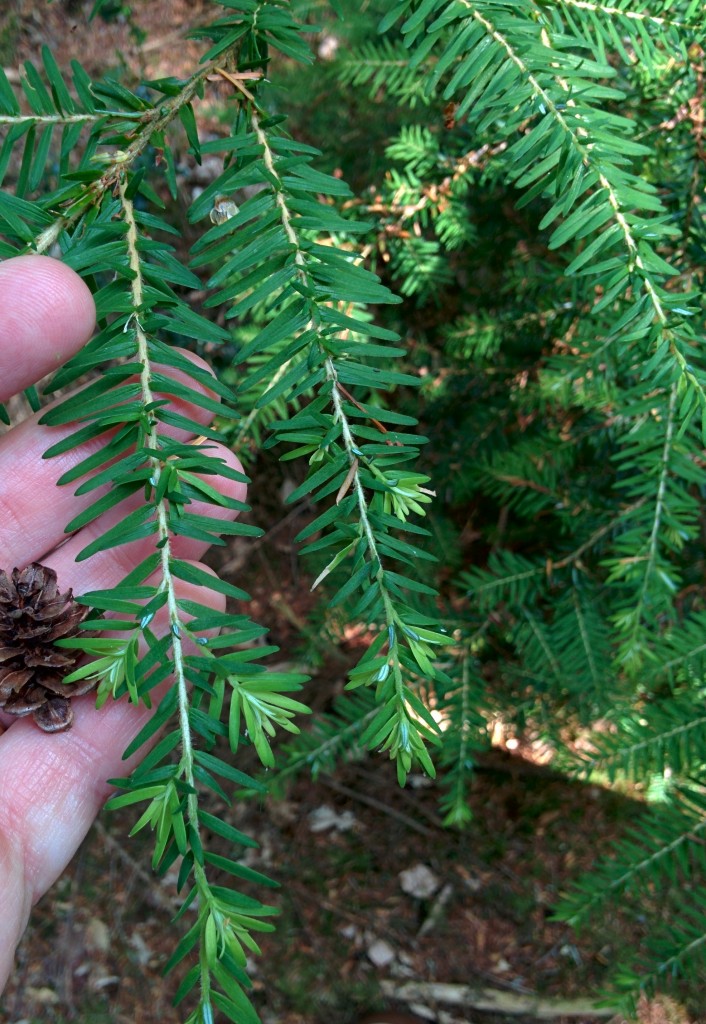
Moving our sights up to the layer above we enter the world of saplings and small trees. Here they grew during the last 30 years, when very little happened to this woodland1. Some areas have a spread of native species: beech, oak, wild cherry, birch, rowan and doubtless others I’ve not spotted yet. Elsewhere flocks of fluffy evergreen western hemlock spruce saplings have spread wide beyond the base of their mother trees.

IMG_20150808_131817 (1)

Western Hemlock Spruce

Many woodland owners see these as alien intruders, to be quickly exterminated. The bad reputation non-native conifers now have has a reasonable basis – shed needles acidify the soil and native wildlife can be baffled by the unfamiliar habitat. Four legged invaders such as grey squirrel and edible dormouse also roam the area, stripping bark and damaging trees. But arguments framed in terms of ‘alien invaders’ swamping the ‘natives’ who truly belong here are obviously bogus and repellent when applied to people. Is it really that different for trees? Why not view these saplings as second generation immigrants, adding variety and interest to their new home?

IMG_20160103_151804

Nature versus nurture

Trees aren’t people of course, which is why it’s OK for me to attack them with an axe. In doing so, I’m part of a long tradition. These woods have been used and managed by humans for hundreds, probably thousands, of years. The large evergreens (larch, spruce and western red cedar) were planted during the ‘locust years’2 the period after the second world war when ‘scientific’ management was applied to British woodland. During this time ancient trees were cleared or even poisoned and great numbers of fast growing softwood trees planted, to be managed on an industrial scale. This caused great damage to wildlife, not purely because of the species chosen. Old gnarled half-dead trees are a great habitat, and the new trees were planted for timber, meaning close together so they grow straight. In the gloom below, little grew.

So did this invasion of aliens destroy a primeval forest, in tune with nature? Not at all. The North American concept of old growth forest simply doesn’t apply on this busy little island. For several hundred years the traditional beech woods of the Chilterns were managed for the furniture trade, especially here, near to High Wycombe. The ‘last bodger’ Owen Dean worked close nearby. Bodgers were craftsmen3 using traditional tools to make furniture within the woodland itself. The grand beech trees towering up in the canopy above me now were grown for timber and so lack side branches for many metres. These same trees are seen as slender youths in pictures of Mr Dean from the 1950s.

Down into the past

To go further back in time we need to look to the layers below. The soil will contain some trace of older vanished trees, even if we cannot read it directly. The top humus-rich layer is the result of hundreds of years of leaf-fall, never ploughed and rarely dug. The mushrooms that dot the forest floor in Autumn are just minor decorations on top of the mycelium, the fine fungus filaments that thread round roots and through rotting matter. Here is a potential continuity, providing a link – even if only an imaginative one –   to the time of Shakespeare when the Chilterns were a major source of wood fuel for the nearby city of London.

This is an ‘ancient woodland’ site since we know if has been constantly wooded since at least 1600. Before this time we can only guess what grew and how it was used. Before oak trees were selectively removed to build the sinews of empire (bark for tanning leather, beams for warships) and beech favoured for furniture this was likely a mixed deciduous woodland made up of species that crept north into Britain after the end of the last Ice Age.

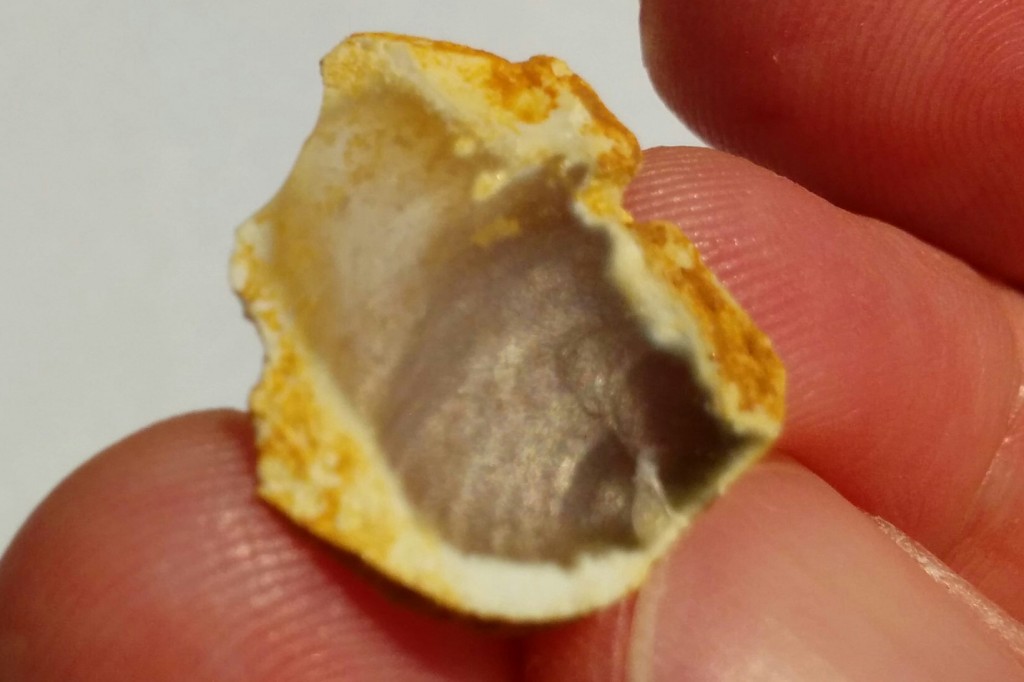
Humans were here too, for thousands of years. At some point a person sat on a stump to knap flint – banging pieces of this glassy stone together to make a sharp edge. I’ve yet to find a tool – an arrow head to kill deer perhaps, or an axe to chop firewood – but some of the useless discarded chips were in the first upturned tree I found.

IMG_20150719_205119

The subsoil here is called ‘clay with flints’ which while descriptive is a bit of a cop-out of a name. It is a thin layer found on the very top of the chalk hills that make up the Chilterns. It’s basically the geology of southern England in minature: after the chalk it’s just about different ways of rearranging piles of flint. Soft soluble chalk contains a lot of hard flint – at first some thought clay with flints was simply the residue of the chalk dissolving over millions of years. But it’s likely there some trace of the younger marine sediments in there as well, all mixed up by the churning of the frozen ground during the Ice Ages (the scouring ice sheets never quite got this far).

The layers below the chalk are hidden, but will include Jurassic rocks – which further east are the source of North Sea oil deposits – and perhaps Carboniferous rocks – which to the north are rich in coal. Man’s interactions with these deeper layers brings us back to surface and to the future.

Back to the future

Think about woodlands and you keep coming back to cycles – the diurnal creeping of birds and animals, the annual dance of leaves and buds, changing fashions of woodland management over the generations. The biggest and most important is the carbon cycle. Across the world, ancient forests are being dug-up and burnt, releasing fossil carbon into the air. For the moment this is giving my trees a little boost, the extra carbon dioxide having a fertilising effect. In time though – probably in my life time – changing climate will make some of my trees deeply unhappy, through drought or storms or flooding or new pests or diseases.

One of the main joys of owning this little patch of woodland – other than hitting things with an axe – is the opportunity to plan what it will look like in 30 years time and then see it come to pass (touch wood). I’m still thinking the details through. The main goals – encourage wildlife, a source of firewood, a place my family can play outdoors – are clear.  But the details – plant this, cut these down – are not. For me getting from one to the other means understanding all the layers of the wood, its past, its present and its likely future. It’s a process I’m enjoying hugely and the chances are I’ll write some more about it here. I hope you’ll be interested in what I have to say.

Paths across the Cheshire Peak

Driving west across the edge of the English Peak District is a good way to see how geology shapes landscape. Tracing the routes that cross it – feeling their shapes with a finger on a map or with your body as the car swings round bends – hints at how they are shaped by the landscape beneath, but also the intentions of the people who first made them. Paths across the Cheshire peak were shaped by dramatic changes across both human and geological history.

http://www.geograph.org.uk/photo/1093601

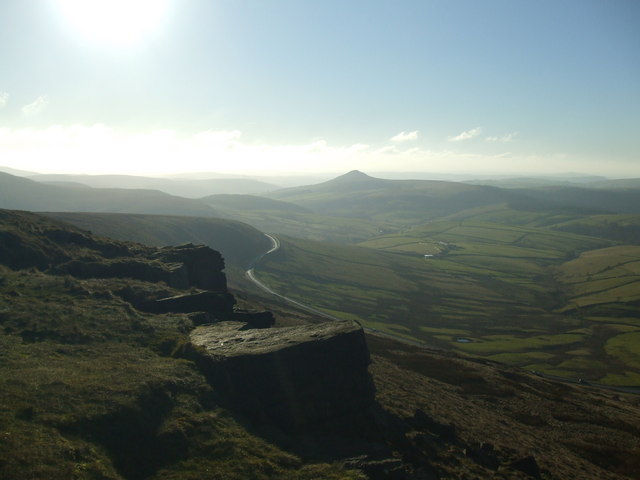
The new Buxton road winds below Shining Tor. © Copyright Jonathan Wakefield and licensed for reuse under this Creative Commons Licence

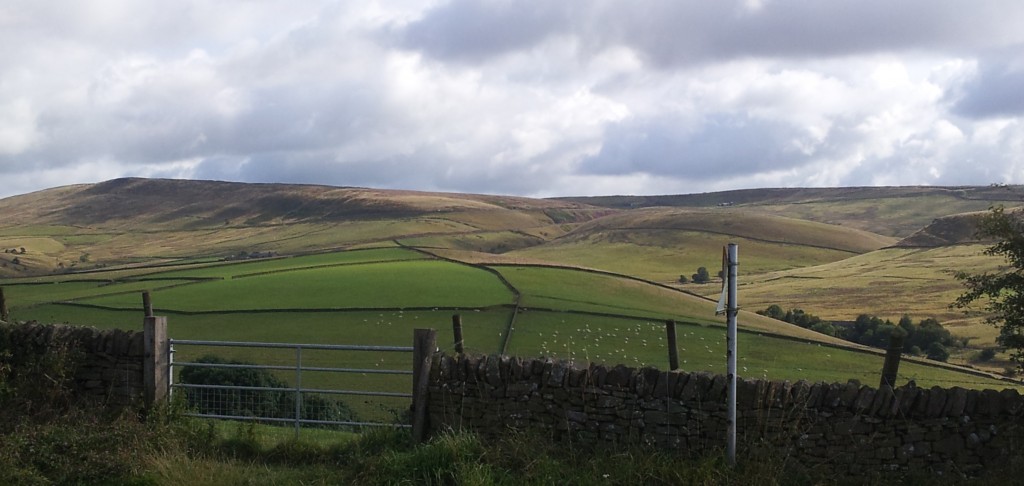
Roads in Derbyshire’s ‘White Peak’ are shaped by the limestone beneath; they sit in the bottom of ‘dales’ – steep gorges etched into rock – or wind across a bucolic landscape of green fields tessellated by white stone walls. But drive out of Buxton on the Macclesfield (“Cat and Fiddle”1) road and you suddenly enter a wilder world. Within a few feet, the stone walls at the side of the road turn from pale grey to a buff beige.  The landscape is brown and open, empty under a sky that is rarely entirely blue, mantled by peat bog and growing little but heather. You are entering one of the ‘Dark Peak’, one of the wild moors of northern England, the wuthering heights where Heathcliff roamed and Ted Hughes’ hawk roosts.

Further west, at the edge of the moors everything changes again – the Cheshire Plain appears laid out for inspection. On a clear day – or better still night – the view takes the breath away. The homes and lights of 3 million people twinkle and beguile. The depth of detail invites you to study, to pick out Jodrell Bank, flights descending into Manchester airport, Alderley Edge….

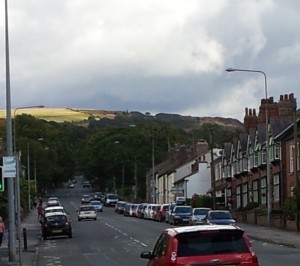
The Buxton road climbs up out of Macclesfield. Taken near Toll Bar Avenue.

The Buxton road climbs up out of Macclesfield. Taken near Toll Bar Avenue.

Drivers shouldn’t enjoy the spectacle: this road needs your full attention. It’s popular with motorcyclists for its many bends. Sadly some are total idiots, making the A537 one of Britain’s most dangerous roads. Their attitude to the area is not much different from many other modern travellers – this is a place to enjoy yourself in. Older generations – those who made this and other routes – had other motivations.


Early trade-routes

Some old routes over the high moors of northern England are know as the Saltways. The ‘wiches’ of Cheshire: Nantwich, Northwich and Middlewich, are towns based on salt. Thick layers sit deep within the Cheshire Basin, formed as a shallow sea was repeatedly evaporated under the Permian desert sun.

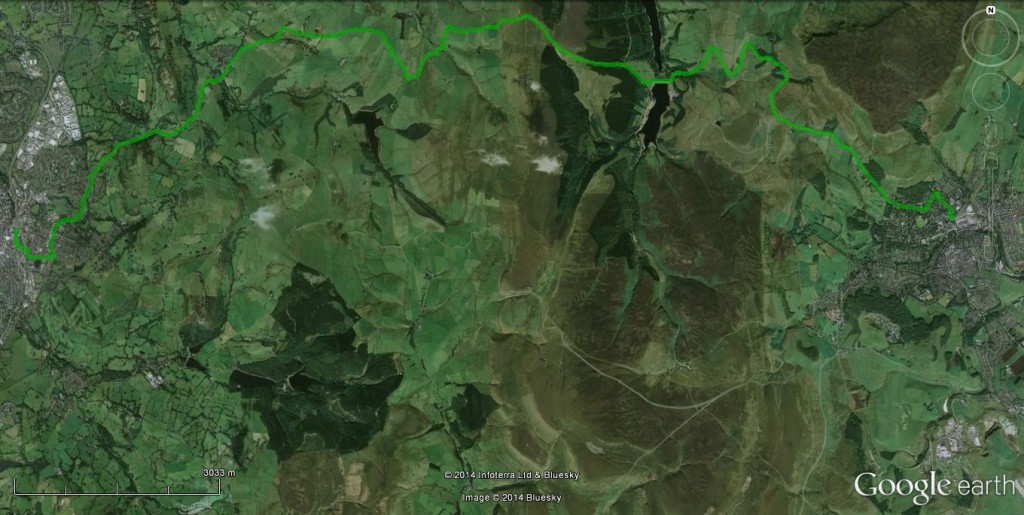
Salt has been produced in Cheshire since at least Roman times. An important commodity essential to food preservation (cheese! bacon!) it was transported across the country by salt traders (“salters”) who name attached to their routes. Below is my inference as to the route taken by salters through this area, passing through Saltersford Hall.

Trace of Salters way

Trace of Salters way in green. Macclesfield is the town on the left, Buxton on the right. The brown area in the middle is the moor

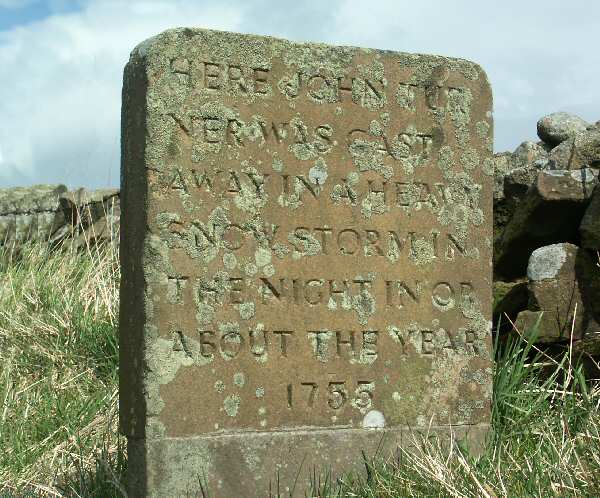
Buxton was a Roman town  and a direct line from the salt towns to there passes this way, but there is not good evidence it is that old. These routes are pre-industrial though, used by men and horses walking through the landscape, at the mercy of the elements. A reminder of how perilous this could be – hard to remember when speeding in a warm car – comes from an odd memorial stone on the route, that reads: “Here John Turner was cast away in a heavy snow storm in the night in or about the  year 1755. The print of a womans shoe was found by his side in the snow where he lay dead”

http://www.carlscam.com/rainow/turner.htm

The front of the memorial stone. Source

 The modern age approaches

Even as John Turner grew cold in the snow,  the epoch-making2 Industrial Revolution was hotting up. Using new technology to centralise production in factories only make sense if you can then get your goods to the people who buy them – new forms of transport were an important factor.

The 18th Century – early on in the Industrial Revolution – innovation came in the form of many new roads, called turnpikes. These were independently financed toll roads, sanctioned by Acts of Parliament.

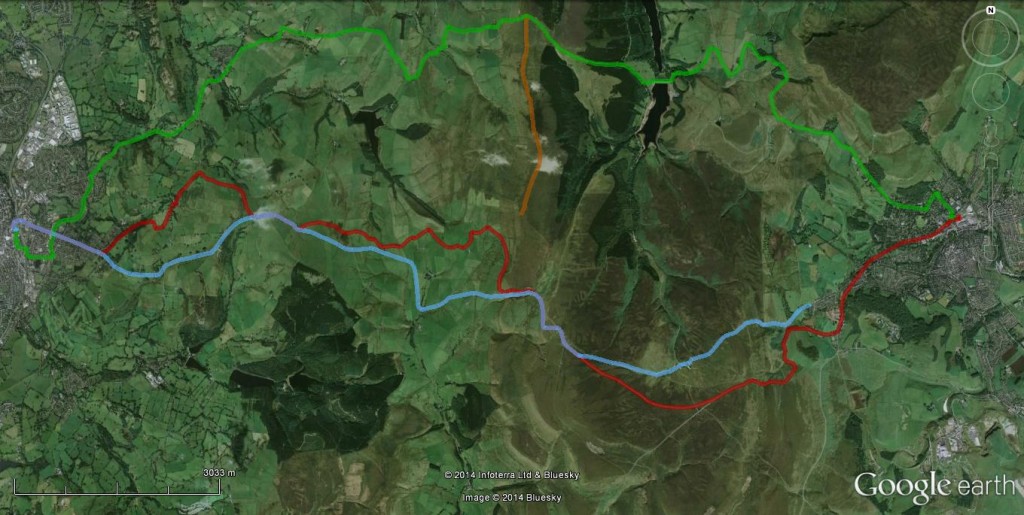
The first Macclesfield-Buxton toll road followed an old route, was ‘engineered by a blind man, John Metcalfe’, and opened in 1759. Initially controversial, it was opposed by some (local coal producers) but championed by the new industrialists.

Old Buxton road in blue, new road in red. Route over Shining Tor in brown.

Old Buxton road in blue, new road in red. Route over Shining Tor in brown.

This road and the salters way are both direct but steep. This is ideal when moving goods with pack horses, but horse-drawn wagons work better with more gradual slopes, even if the route is longer. By the dawn of the 19th Century, new road-building techniques had emerged that cut into the hillside to make wider carriage-ways that avoided steep slopes even over hilly terrain.

New and old Buxton roads cross the far hillside. Cat and Fiddle pub right hand skyline

New and old Buxton roads converge on the far hillside. The Cat and Fiddle pub is on the right hand skyline

In 1808, a new Eddisbury bypass just above Macclesfield was built by the famous engineer Thomas Telford, the “Colossus of Roads”. In 1821 the rest of the Macclesfield-Buxton road was modified with new winding flatter routes and a pub for the weary. The new road is wider than the old and climbs more gradually. To achieve this is has many bends, which attract the loonies in leather on their motorcycles.

A new ancient road

The transition from White to Dark peak, as you go east from Buxton is dramatic to us, but the incoming darkness would have been felt much more keenly by the Carboniferous inhabitants. The sparkling tropical seas where trilobites frolicked in crinoid forests were suddenly snuffed out by the arrival of massive amounts of sand and mud. Rocks made from the remains of life are replaced by those where fossils have to be sought out – traces in sand, crushed shells in rare marine muds or eventually, coal.

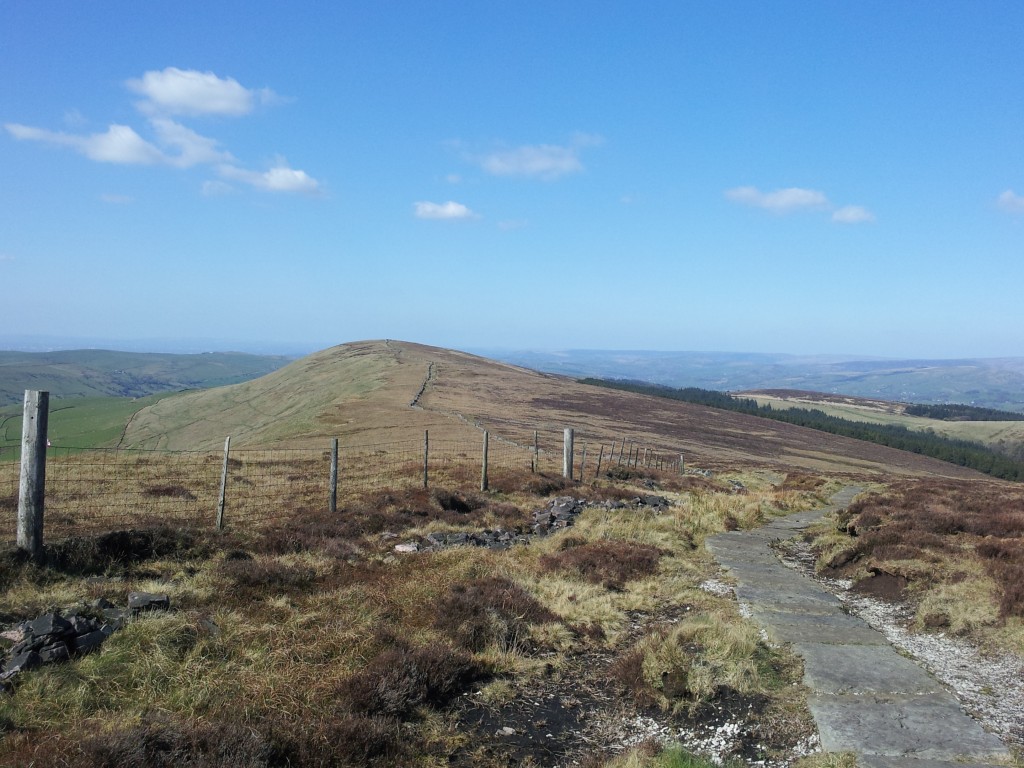
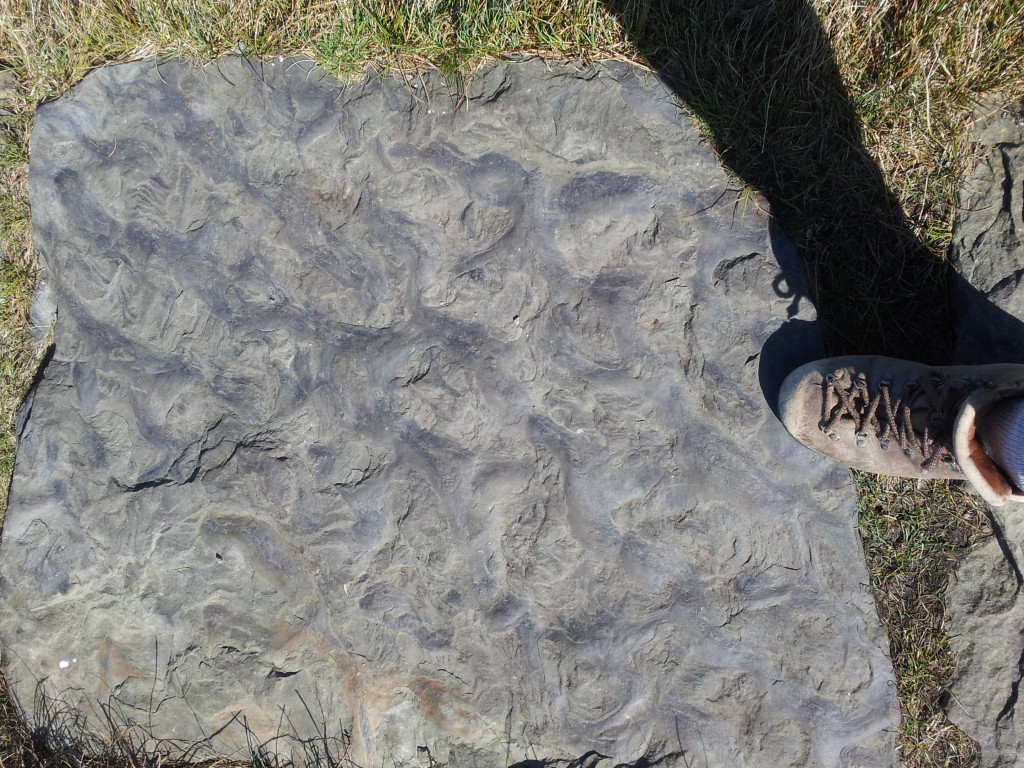
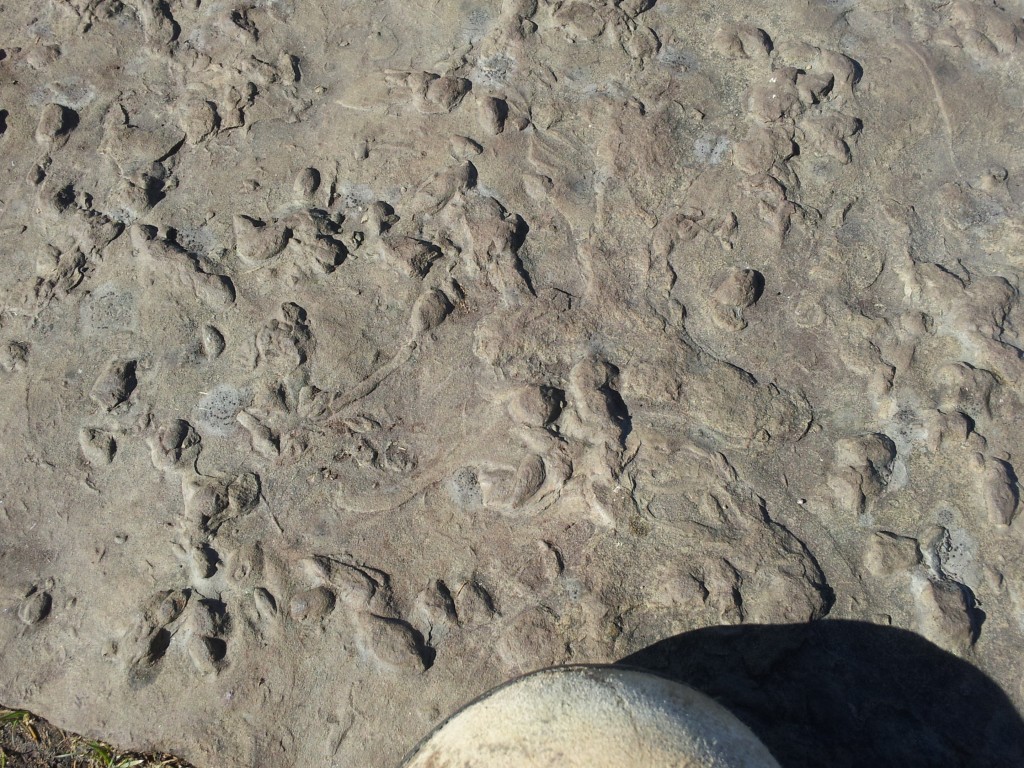
The most modern path across the Peak is also the most ancient. Walking across these hills for pleasure is extremely popular and paths easily cut into the soft peat. The most popular routes are now paved with big slabs of the local sandstone – along Shining Tor there are hundreds of them. Covered in ripples and the traces of burrowing bivalves, walking along these makes you feel like you are on a sandy shore 300 million years ago.

wpid-wp-1398008342435.jpeg

Slabs of sandstone along Shining Tor


Ancient ripples

Ancient ripples

"Lockeia" - traces of burrows from bivalves

“Lockeia” – traces of burrows from bivalves

BRITICE-CHRONO: death of an ice sheet

Using many different techniques, dozens of scientists are studying the death of an ice sheet that once covered Britain and Ireland. They want to understand the future fate of modern-day ice.

The phrase “ice sheet” doesn’t do justice to our subject: this is not something you shatter when stepping on a frozen puddle. Covering over a million square kilometres, this sheet is also kilometres thick. As it grew it pulled enough water out of the world’s oceans to lower them by metres, affecting tropical coastlines as well as the land entombed beneath the ice. The vast bulk even pushed down the crust beneath, slowly moving the underlying mantle aside.

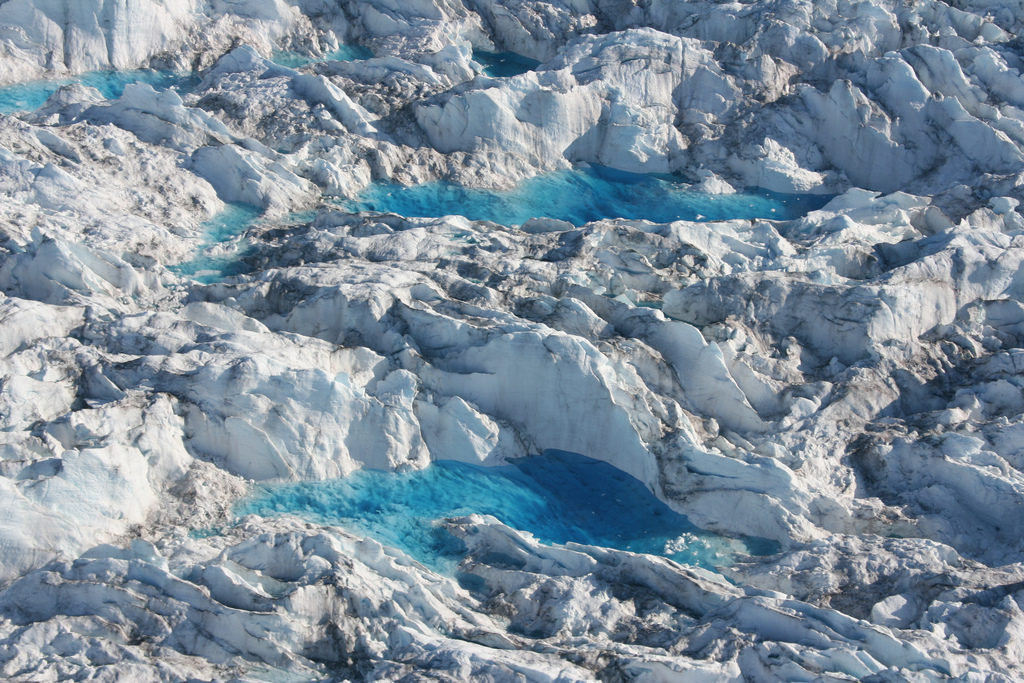
Melt pond on icesheet. Photo by Leif Taurer used under Creative Commons.

Melt pond on ice sheet. Photo by Leif Taurer used under Creative Commons.

The ice is constantly in motion. Snow falling on the ice sheet will eventually make its way to the sea, slowly flowing down and along.  Most is channelled into fast moving ice-streams.  This ice sheet is ‘marine-influenced‘, it sits partly on land, partly on the sea – most of its ice will end its days as an iceberg. The edges of the sheet can become undercut by the oceans, turning the edge into delicate ice shelves.

In the way it grows and flows, this ice sheet can seem almost alive. It will surely die, one day. Changing climate tips the balance between snow build-up and melting, the unstable ice shelves collapse and the ice-streams send ice to melt in the sea. In time the sheet thins to nothing and the world is transformed again.

BRITICE-CHRONO

My description of an ice sheet applies to the modern West Antarctic sheet. Scientists who study it worry about how, in the face of a rapidly changing climate, it might collapse, flooding cities across the globe. The IPCC identified this risk and highlighted how little we know about it.

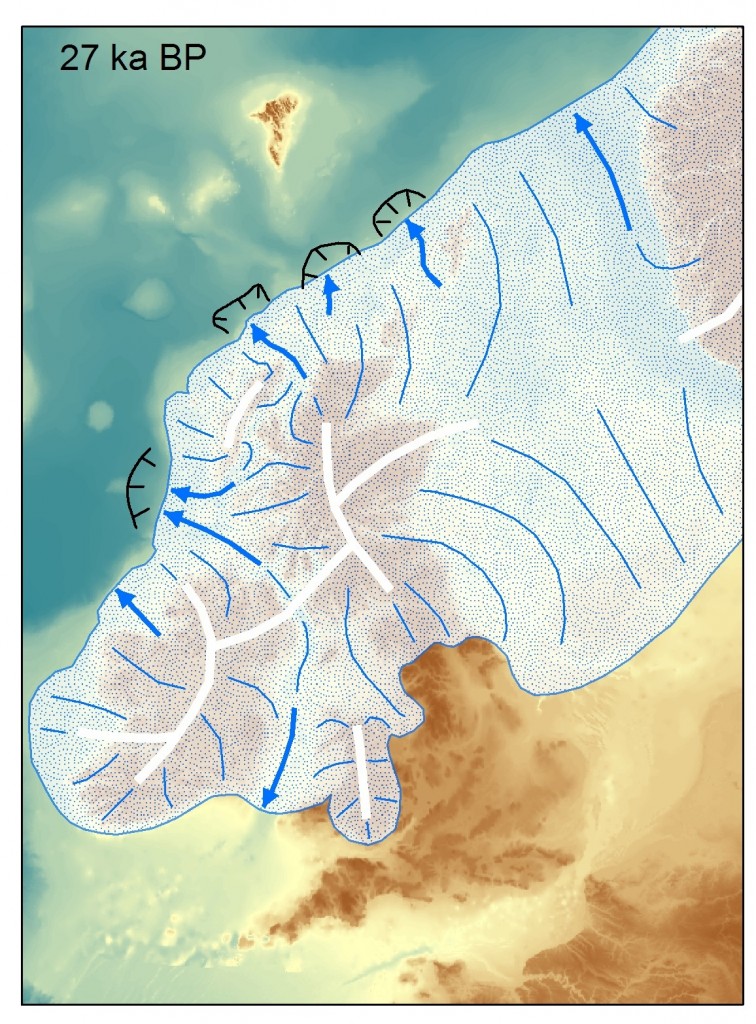
27,000yearsago (2)

The British & Irish ice sheet, 27,000 years ago. Image courtesy of Chris Clarke.

My description also applies to the ice sheet that sat over Britain & Ireland 25,000 years ago.. A multi-disciplinary consortium, called BRITICE-CHRONO will greatly improve our understanding of the death of this ice sheet. This will be of great local interest, but will also help us predict the potentially troubled and troubling future of both the West Antarctic and Greenland ice sheets. The ancient climate change that killed the ice sheet was natural, but modern human-made warming melts ice just the same.

BRITICE

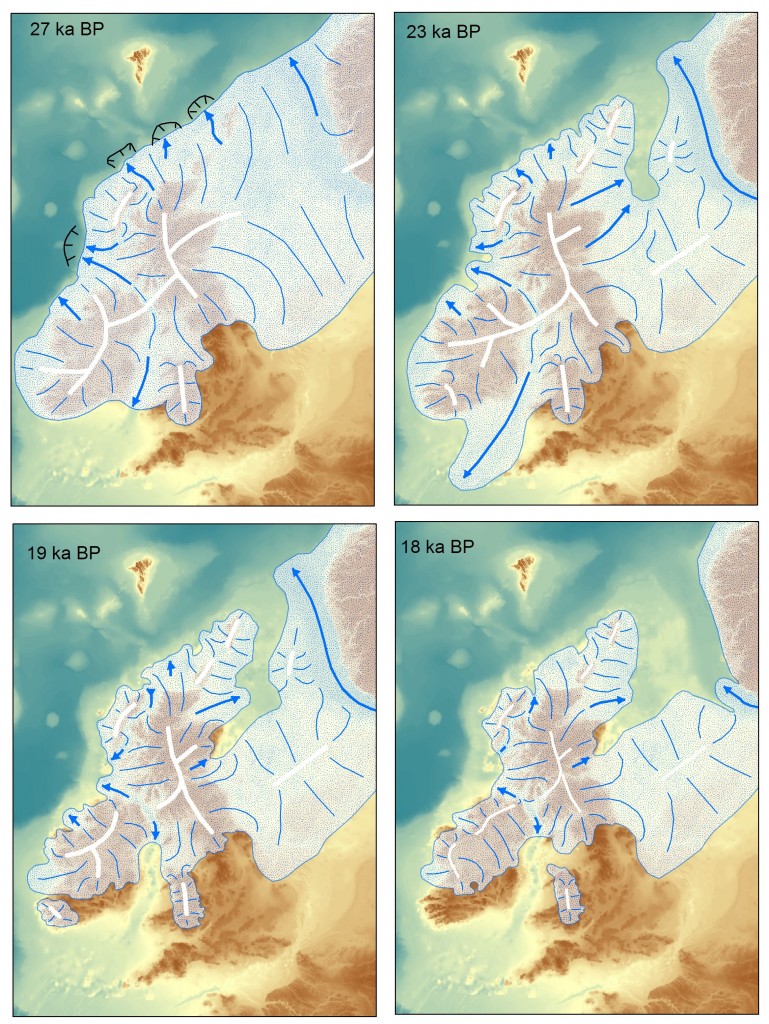
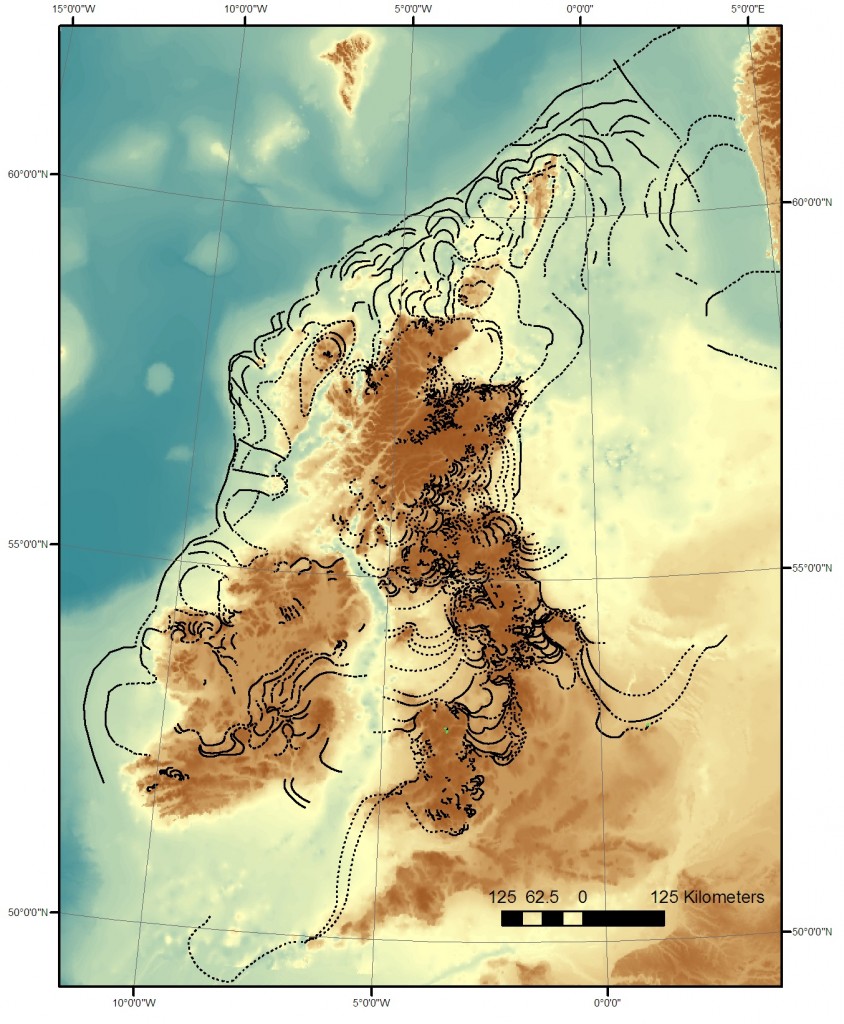
The physical traces of the death of the British ice sheet are easy to find: erratics, moraines and glacial lake deposits are just a few of the subtle but distinctive features to found over much of Britain. A now complete project called BRITICE, led by Professor Chris Clark of Sheffield University, mapped them all, focussing on traces of the final retreat of the ice sheet. Similar work in Ireland allows the pattern of retreat for the entire ice sheet to be inferred.

Maps showing the evolution of the British & Irish icesheet over time. Image from Chris Clark.

Maps showing the evolution of the British & Irish ice sheet over time. “19 ka BP” means 19,000 years before present. Image from Chris Clark.

CHRONO

BRITICE-CHRONO involves nearly 50 researchers from 8 universities plus the British Antarctic and Geological Surveys. A big part of the work of BRITICE-CHRONO is working out the age of various features. Familiar techniques such as radiocarbon dating are useful, but a new generation of dating techniques can do things that seem almost magical.

Optical stimulated luminescence (OSL) dates the last exposure of sunlight for individual quartz grains. Natural radioactivity traps electrons within defects in the crystal lattice of the quartz grains. If light comes through it frees them again and produces more light (the luminescence). Quartz exposed to sunlight at the surface does not show luminescence, but grains that have been buried in a sand bank for thousands of years do. Measuring luminescence in the lab allows an estimate how long they have been buried for and therefore when the sand was deposited.

Conversely, TCN (terrestrial cosmogenic nucleides) is a technique used for dating how long a surface has been exposed. Cosmic radiation is constantly streaming down on us and within minerals at the Earth’s surface it produces radioactive elements such as 10Be and 36Cl. The more of these we find, the longer the surface has been exposed to space. Apply this technique to a boulder dropped by a glacier and we can infer when the ice was last present.

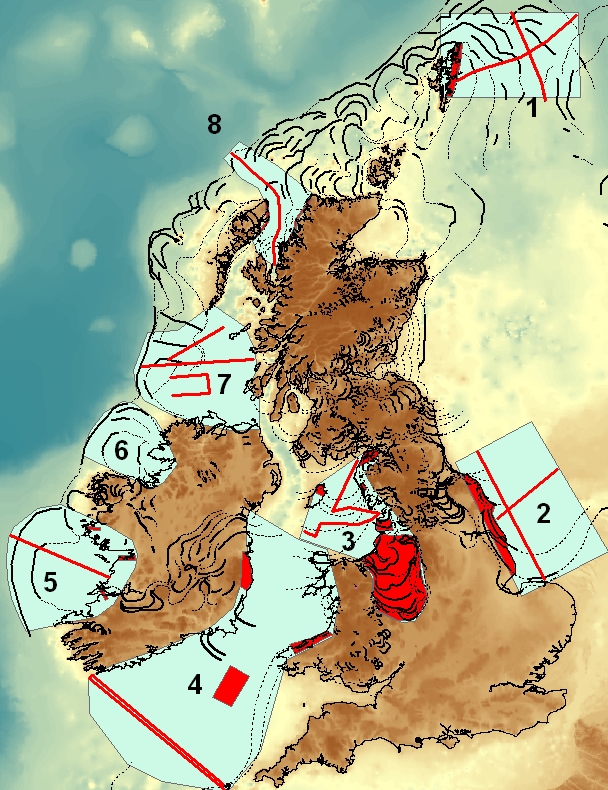
BRITICE-CHRONO's area of investigation. Image from Chris Clark

BRITICE-CHRONO’s  8 transects. Image from Chris Clark

As part of BRITICE-CHRONO people are collecting hundreds of samples from all over Britain and Ireland. Guided by the BRITICE work, they are sampling features tied into different stages of the death of the ice sheet. The goal is to build up a large and robust dataset to understand how quickly the ice sheet shrank.

To the sea

When the ice sheet was there, sea levels were much lower (because the water was in the ice) and the ice left many traces on what is now the seabed.  BRITICE-CHRONO is using geophysical techniques to understand the distribution of glacial sediment on the seabed (sometimes on land too). Collecting cores from the sediments on the seabed also provides samples for dating. Cores from far offshore contain large rock fragments. These show that floating icebergs melted overhead, dropping stones scraped from land that became entombed within the ice sheet. Marine fossils offer their own special insights.

Offshore features. Image from Chris Clark.

Ice retreat features, both offshore and on. Image from Chris Clark.

There is a lot of interest in understanding features on the sea-bed – construction of offshore wind-farms requires better knowledge of what is out there. Also we now understand the potential for archaeology under these shallow seas. The British-Irish ice sheet may be long dead, but that doesn’t mean people never saw it1.

Recreating the ice sheet ‘in silico’

We know a lot about the world in which the last British ice sheet died. Ice from this time still exists, buried deep in the central parts of the Antarctic and Greenland ice sheets. It contains bubbles of air that once blew over a colder world. From this and other evidence, we have a good record of the climate spanning the period in question.

Scientists have built up sophisticated computer models of how ice sheets grow and die, in part based on research in Antarctica. Take known parameters, such as climate and topography and its possible to recreate an ice sheet ‘in silico’, to build up layers of ice within a computer and watch them disappear as the climate warmed.

BRITICE-CHRONO will build up a robust 4-D dataset of how the ice sheet retreated over time. Combining this with computer modelling will create a positive feedback, increasing our knowledge of how ice sheets behave, both in the past and the future.

Scientific Aims

BRITICE-CHRONO will test three main hypotheses, all of which are relevant to the goal of predicting the fate of modern ice sheets:

  1. The portions on ice close to sea level  collapsed rapidly (in less than 1000 years) but the rate of decay was slower for ice on land. Just how catastrophic was the death of the British-Irish ice sheet?
  2. The main ice catchments draining the ice sheet retreated synchronously in response to climatic and sea-level change. Was the retreat of the ice controlled entirely by external factors, or did the response vary over the ice sheet? This helps us understand the significance of local rapid retreat of ice in Antarctica. Does seeing it in one place necessarily mean it is happening to the whole ice sheet?
  3. The volume of ice-rafted debris depends on changes in ice sheet mass balance. Finding large stones in layers of offshore sediment is a direct record of where melting icebergs were found in the past. How is this linked to changes in the ice sheet? Does the amount increase when ice sheets grow, or when they retreat?

BRITICE-CHRONO is less than half way through its 5 years so it is too early to draw any conclusions. The goal is to produce a robust set of data so individual dates will not be published until the full picture is know. Last year saw a massive sampling effort that will continue this year. Although the focus is dating, put experts in the field and they will find new features such as a whole new suite of moraines in Scotland.

The consortium has a blog and is active on Twitter so you can join me in following their progress as they bring an ice sheet back from the dead.

Traces of glacial ice and water

There’s an immediacy to the study of the Quaternary (the last few million years) that is rather seductive. Most geology is (after John McPhee) studying ‘the former world’ but the Quaternary is close enough in time that it is still this world, capped by ice and full of familiar animals and human beings. We can study this period of time in tremendous detail using things – piles of sand, the pattern of the landscape, peat bogs – that are unlikely to be preserved in the geological record.

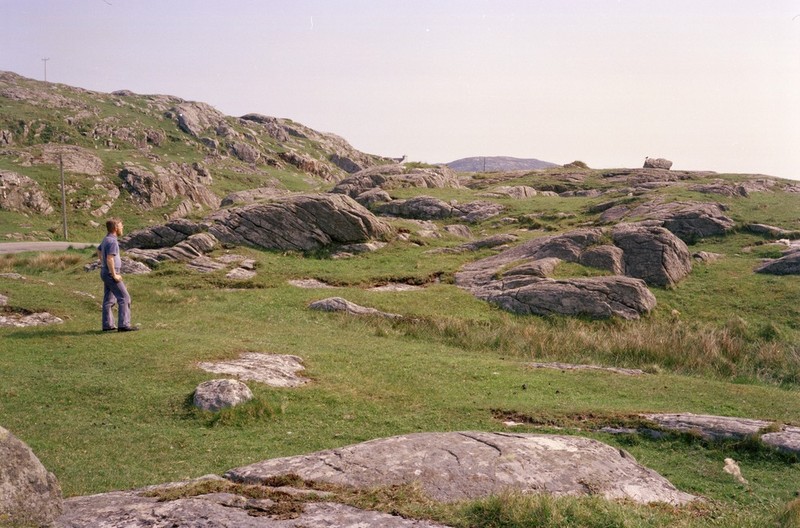
An outcrop of Irish gabbro tells us about conditions deep within the earth, but the mountain range, even the continent it formed in are all gone. The smooth shape of the outcrop and its covering of fine scratches were caused by the scraping of stones in ice, part of a massive icesheet that stretched across the British Isles. The ice is gone but it flowed over this hill, down that valley. On a chilly day it can feel like it only just left.

Stone moved by ice

One outcome of the great ferment of ideas in 19th Century Britain was the recognition that much of the northern British Isles were once covered by of thick sheet ice. One of the earliest recognised forms of evidence for these vanished ice sheets is found in the form of glacial erratics. These are pieces of rock, sometimes very large, dumped by the ice. The most useful sort come from a distinctive rock type, a granite intrusion perhaps, that allows you to know precisely where the erratic came from and so infer which way the ice was flowing. On the Yorkshire coast in England there are erratics from Norway1, showing that the ice flowed across what is now the North Sea.

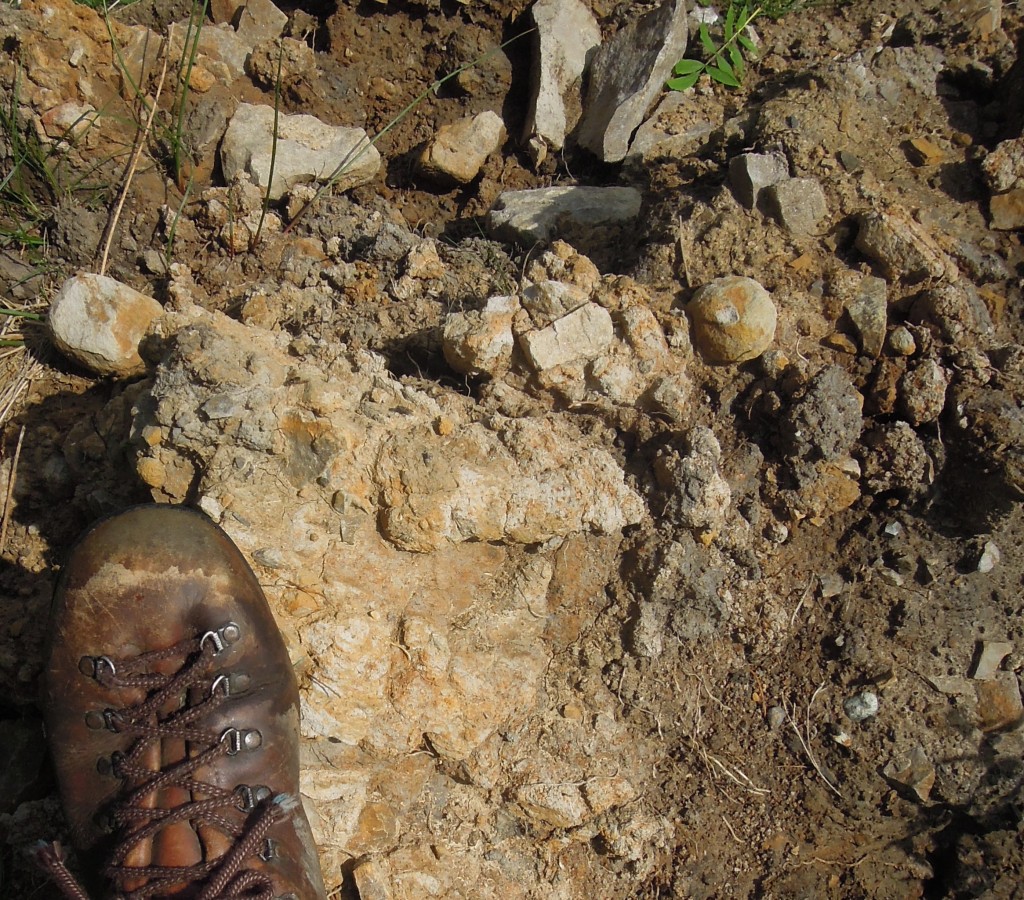
Freshly dug glacial drift from Cheshire.

Freshly dug glacial drift from Cheshire.

Volumetrically the biggest record of glaciation is glacial drift. This is sediment that was moved and ground-up by the ice. It is a very jumbled, poorly-sorted sediment, with big blocks mixed up with sand and silt. If you find a sediment like this, you know there has been glaciation. This applies to ancient sediments just as much as recent ones.

Studying drift, people realised that things were quite complicated. A single place might have multiple layers of glacial drift separated by more normal sediments. They realised that term ‘Ice Age’ is a simplification; this was phenomena that pulsed. Outside of the Polar regions, the ice caps came and went many times, dancing in time with the stately precession of the earth’s axis.

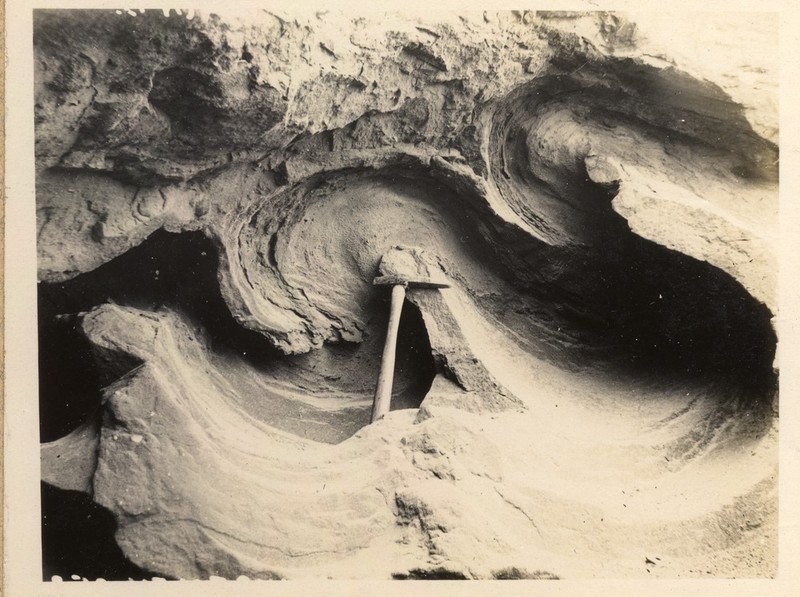
Isoclinal folding in glacial sand and clay. Photo from 1921 courtesy of British Geological Survey. P249721 http://geoscenic.bgs.ac.uk/asset-bank/action/viewAsset?id=78063&index=55&total=56&view=viewSearchItem

Isoclinal folding in glacial sand and clay. Photo from 1921 courtesy of British Geological Survey. P249721

Sometimes, soft drift gets pushed around by advancing ice. Sometimes this results in beautiful folds, other times it puts sediments containing marine shells deep inland. 2. For this reason, the presence of drift is fairly uninformative. To make firmer conclusions about the most recent advance of Ice, we must turn to more subtle features.

Fainter traces

Glacial sediments aren’t laid down in thin even layers, but in various ways, both elegant and ugly. Valley glaciers often have moraines: piles of sediment at the end or sides that fell out of the melting ice. The same principal applies to Ice Caps, such as covered most of Northern Europe and North America. Successive belts or ridges of moraines can record the retreat of an ice sheet.

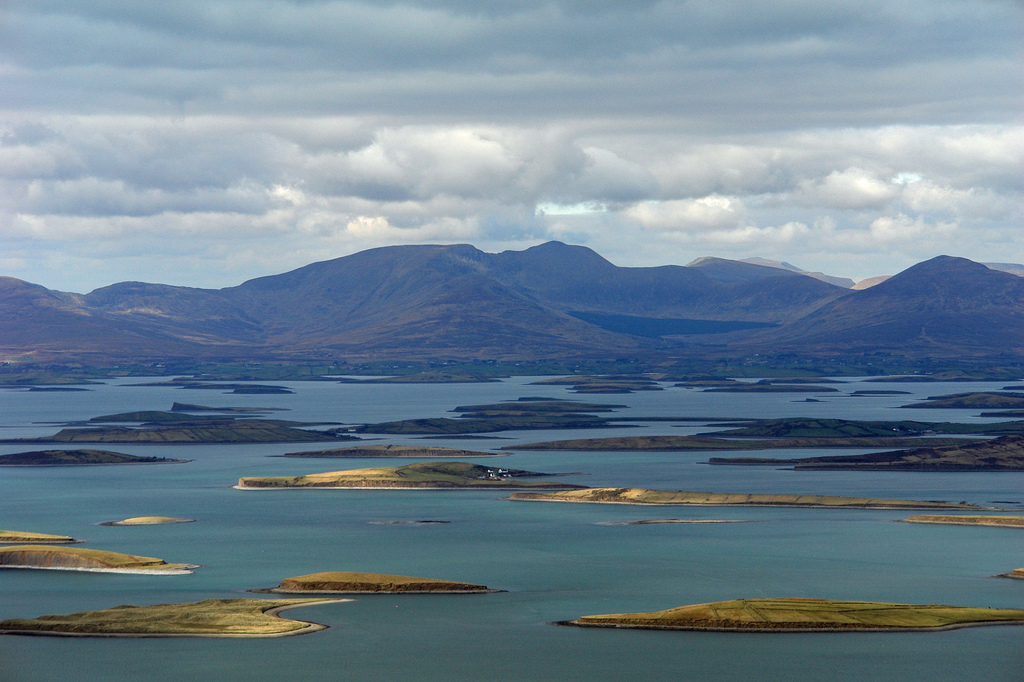
Drumlins are piles of glacial sediment that have been moulded by ice flow. They are very beautiful features, with an aerodynamic shape. They can look like the back of a huge whale, somehow rising out of the ground. Often found grouped together, their shape indicates the direction in which the ice was moving when last it was flowing.

A pod of Drumlins swimming in Clew Bay, Ireland. Photo from chrispd1975 on Flickr under CC. http://www.flickr.com/photos/8289745@N03/2384936935/sizes/l/

A pod of Drumlins swimming in Clew Bay, Ireland. Photo from chrispd1975 on Flickr under CC.

Glacial striations and polishing are common features found on land that was once under the ice. Stones in the ice slowly scratched their way across bed-rock. Asymmetric features known as roche moutonnée tell us the direction of ice flow.

A flock of Scottish roche moutonee (ice flowing to the right). Image from British Geological SurveyP008317 http://geoscenic.bgs.ac.uk/asset-bank/action/viewAsset?id=7032&index=14&total=182&view=viewSearchItem&movedBr=null

A flock of Scottish roche moutonee (ice flowed to the right). Image from British Geological Survey P008317

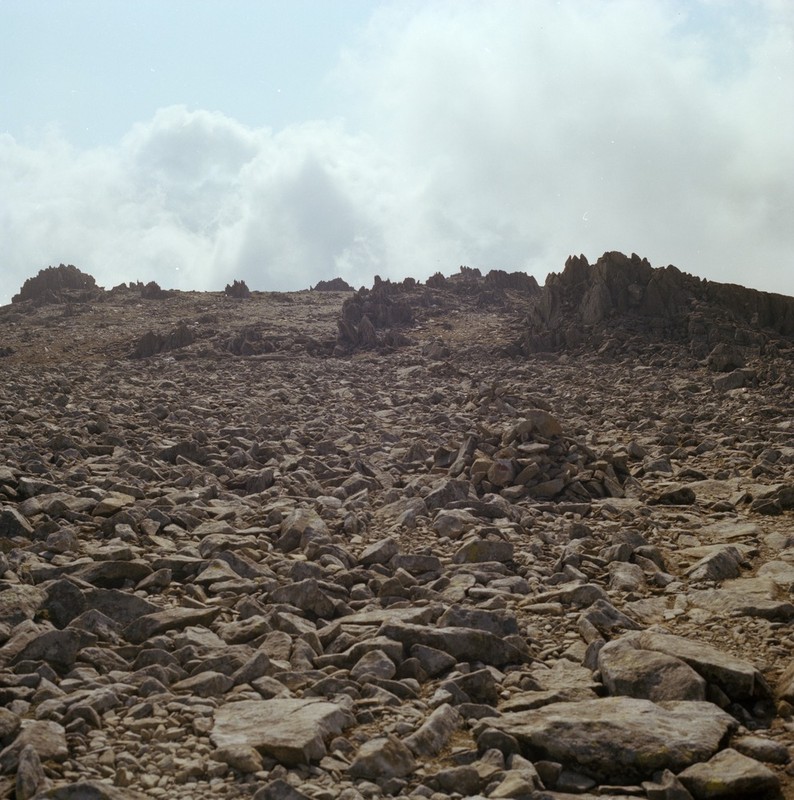
A common experience when walking one of the bigger mountains in Britain is to start in a valley filled with glacial till, perhaps with some moraine visible. Next a climb up a ridge shows lots of polished rock. Finally, the summit pyramid is covered in a great thickness of loose stone3. Between this summit block field and the scraped stone below is the trim line that captures the top of glacial erosion. Map out trim lines on multiple mountains and it tells you something about the vertical extent of the ice4.

Summit block field of Glyder Fawr in Wales. Image courtesy of British Geological Survey. P222636 http://geoscenic.bgs.ac.uk/asset-bank/action/viewAsset?id=29270&index=23&total=38&view=viewSearchItem

Summit block field of Glyder Fawr in Wales. Image courtesy of British Geological Survey. P222636

When ice melts, it turns into water. In my gin and tonic this is fine, but when the melting ice is 100s of metres thick, it will have a big impact. Around my home town of Macclesfield in England there are glacial lake deposits. They are sitting above the edge of the Cheshire Plain – there’s no way you could have a lake there today. The only way to explain this vanished body of still water is: it was dammed by the ice.

Other evidence of water flowing in odd ways if found in glacial meltwater channels. These look like small stream beds, but they have no stream today. Sometimes they flow along slopes or uphill for a time -evidence that when the water was flowing, the ice was still around.

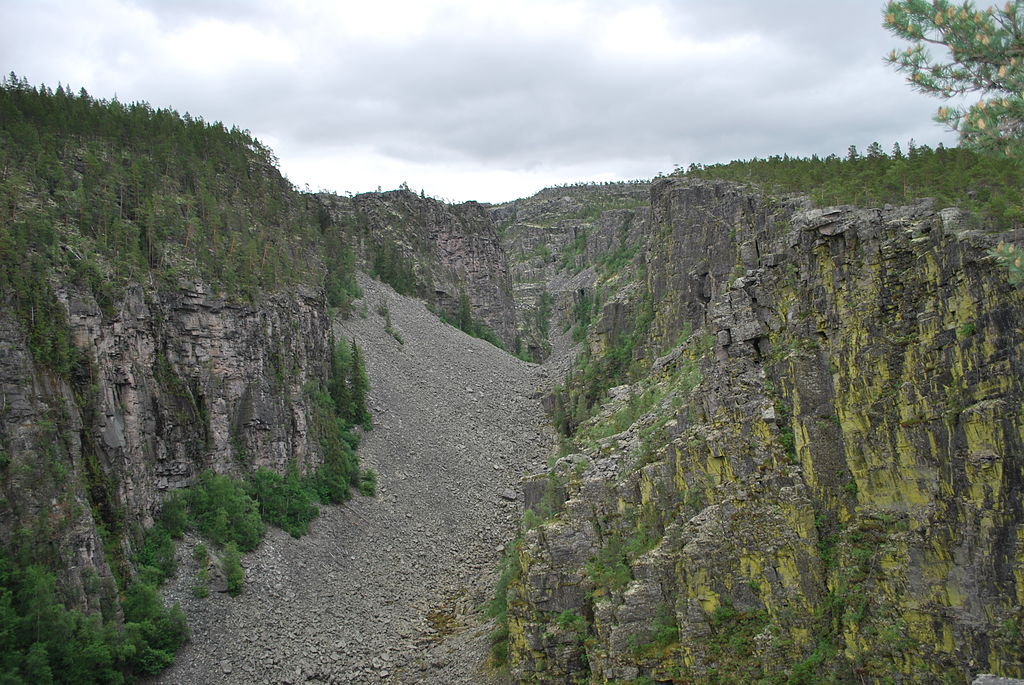
If you were building a dam to make a huge lake and you proposed making it out of ice, you wouldn’t get far as an engineer, because at some point the dam will fail and all the water will come flooding out. This happened with melting ice in several places. The huge scoured landscape of the channeled scablands in Washington State, USA, are the biggest example, but my favourite is the Jutulhogget or ‘Giant’s Cut’ in Norway.

Jutulhogget http://commons.wikimedia.org/wiki/File:Jutulhogget_01.jpg

Jutulhogget  Image from Wikimedia Commons.

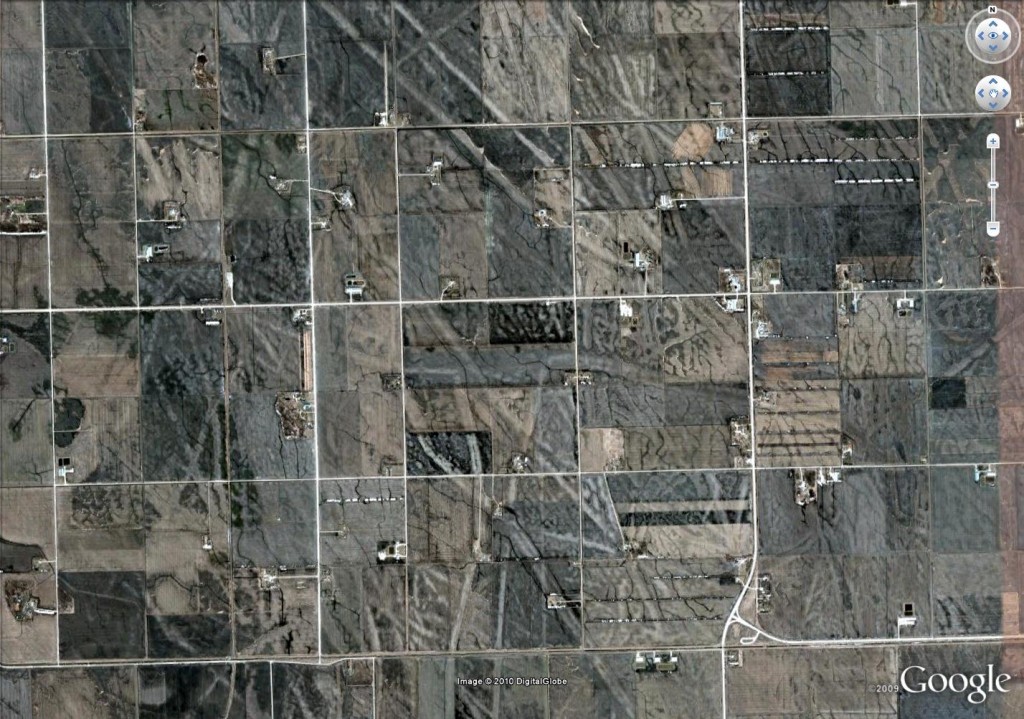
Of limited scientific use, but rather beautiful, iceberg keel marks are more evidence for glacial lakes.

Glacial keel-marks from Canada. Google Earth image.

Aerial view of glacial keel-marks from near Manitoba, Canada. Square lines are roads: see here for more details

 To the science

Knowing about these features really enhances your view of the world – it gives you a way to read landscapes and discover a world of ice so close in time we can almost touch it.  But the best thing about these features is that they tell us about the now-vanished ice. Modern researchers have mapped them to track the ice’s ebb and flow. They combine these maps with computer modelling, insights from active ice sheets and techniques for dating so advanced that they seem almost magical. Their goal is to predict the future. In the face of a changing climate, an ice-cap died in Britain 15,000 years ago. Understanding this process better may help us predict that fate of earth’s remaining ice caps. I’ll write more about this next….